
Abstract
Expressing identity socially involves a balance between conformity and innovation. One can adopt existing labels to express belonging to a certain community or introduce new labels to express an individual sense of identity. In such a process of co-creation, the existing identity labels of a community shape one's sense of identity, while individual expression changes that of a community. Social media has introduced new opportunities to study the expression of collective identity. Here we study the group behavior of individuals defining their identities with hashtag self-labels in their Twitter profiles from mid-2017 through 2019. These timelines of personal self-labeling show behavior incorporating innovation, conservation, and social conformity when defining self. We show that the collective co-labeling of popular concepts in the context of identity, such as #resist and #maga, follow the dynamics of a modified Yule–Simon model balancing novelty and conformity. The dynamics of identity expression resemble the collective tagging processes of folksonomies, indicating a similarity between the collective tagging of external objects and the collective labeling of ourselves. Our work underpins a better understanding of how online environments mediate the evolution of collective identity which plays an increasingly important role in the establishment of community values and identity politics.
Export citation and abstract BibTeX RIS
1. Introduction
Identity and its manifold expressions feature prominently in our public life, across a variety cultural, scholarly, and scientific domains [1, 2]. Social media is suspected to have played an important role in this trend, possibly by connecting formerly disconnected individuals and providing them with a platform to develop a sense of collective identity [3]. Twitter has been a beachhead of this phenomenon through its emphasis on the use of #hashtags. Their construction, a token preceded by a hash character (#), explicitly signals a desire to label an abstract notion that is either already recognizable by one's social awareness, e.g. #sportsteam, or an conceptual innovation that one is seeking to introduce into one's community, e.g. #newidea. As common knowledge representations [4], hashtags are useful as social coordination signals [3] as has been seen in the rise of social movements like the Gezi park protests, Occupy Wall Street, #metoo, and #blacklivesmatter [5–7].
Twitter supports the expression of personal identity by allowing users to create personal profiles where they can communicate a variety of items, such as a user name, an image, and profile text that serves as a description of self. The use of hashtags in these profiles is particularly interesting because of the dual nature of a hashtag in this context as an a personal label and a reference to a socially-known concept. For example, the hashtag #chelsea is useful if one's community understands it as a marker for Chelsea Football Club fan membership, but at the same time it is intended to individually express one's own identity as a supporter. The collection of personal self-labelings held in Twitter profile descriptions then can represent a collective labeling of what identity is and how it changes.
Twitter profile data has been underutilized due to difficulty in obtaining histories of profile descriptions from the standard Twitter API (see section 5). One study has analyzed identity from Twitter profiles, combining social theory and natural language processing to classify users into categories [8]. We take a different approach, considering the self-description of individuals with hashtags as a collective curation of identity-relevant labels. Specifically, we track labeling behavior whenever a user redefines self with at least one new label compared to their previous self-labeling state. This criterion, combined with an untapped source of Twitter profile data, enables us to extract a large collection of exact instances where users both care about curating their identities and specifically take self-labeling actions (see section 5). The resulting co-labeling behavior captures the relatedness of labels used in public, online identity signaling, a relatedness that can go beyond simple semantic similarity [9, 10].
Figure 1 shows examples of self-labeling timelines from four individuals who identified with #resist at some instance. The numbering in each timeline indicates the chronological order for that individual, but these updates could be chronologically interspersed across individuals given the time stamp of any profile update. Although the common label chosen for these examples is political, we see a blending of political signaling (#impeach), interests (#starwars), and purely personal attributes (#infj, #musician). Of note, labels can be added and potentially conserved within an individuals' identity progression, hinting at a Yule–Simon process [11–13]. In addition, we see the use of identical labels alongside #resist conserved across individuals (#lgbtq, #bluewave).
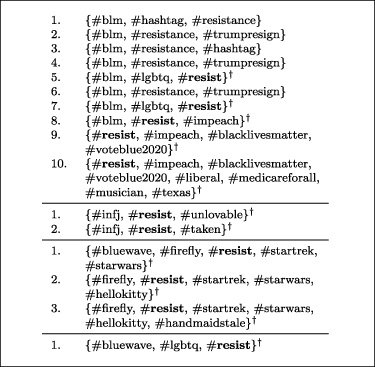
Figure 1. Exemplar progressions of self-labeling profile updates for four individuals who identify with #resist (in bold). Each numbered instance shows the set of hashtags observed within the individual's Twitter profile when a new hashtag is added, compared to its previously observed state. Of note is the cure for a lonely heart, as well as the coexistence of incompatible science fiction fandoms. Within individual timelines, labels can be added and conserved over time, hinting at a potential Yule–Simon process. The presence of identical labels is also demonstrated across individuals. We are interested in group self-labeling behavior surrounding specific labels, indicated with  for the case of #resist.
Download figure:
Standard image High-resolution imageWe analyze self-labeling behavior from the perspective of complex systems, in particular those involved in the dynamics of folksonomies, established after widespread adoption of crowdsourced tagging systems on the internet roughly a decade ago [14, 15]. Although these services might now be outmoded, the processes that underlie the collective tagging and definition of external objects may be translated to the modern focus on defining and maintaining collective identity.
2. Results
Here we study group behavior of individuals collectively defining their identities with hashtag self-labels; e.g. the behaviors shown in figure 1 in aggregate. We specifically define groups as those collectively self-labeling in the context of a common hashtag, an 'anchor' for group behavior surrounding that particular hashtag (#resist, for the cohort of four in figure 1). Table 1 shows the five anchor labels used by the largest cohorts of individuals overall in our data, showcasing groups' coalescing around specific topics, from social and political movements (#resist, #maga, #blacklivesmatter) to personal interest (#music), and sports teams (#mufc: Manchester United Football Club).
Table 1. The top five most common anchor self-labels by number of individuals' use, aggregated across our data. Each individual can use the anchor label in a number of profile updates, in conjunction with co-labels in the same profile update.
| Label | No. of individuals | No. of profile changes | No. of co-labels | No. of distinct co-labels |
|---|---|---|---|---|
| #resist | 1432 | 4595 | 17 596 | 3421 |
| #blacklivesmatter | 1206 | 2202 | 5599 | 2108 |
| #maga | 1184 | 4519 | 21 398 | 3000 |
| #music | 1027 | 2318 | 14 949 | 3978 |
| #mufc | 986 | 1795 | 5151 | 2136 |
In particular, we consider the frequency–rank (F–R) distribution of co-labels surrounding an anchor label in any profile update over all individuals. Figure 2 shows the F–R distribution for co-labels of the anchor label #resist (see supplementary material for F--R distributions of the other anchor labels). Given the traits discussed in labeling behavior in figure 1, and the Zipf-like behavior shown for the F–R distribution in figure 2, we hypothesize that a Yule–Simon process could underlie group labeling of self in the context of an anchor label.

Figure 2. Frequency–rank (F)–(R) distribution of labels co-occurring with #resist in individual self-labeling updates. Each point plots the normalized co-labeling frequency vs. its decreasing frequency rank. The top seven most frequent co-labels are annotated; #fbr is an acronym for Follow Back Resistance, a hashtag campaign associated with the 'resistance' political movement.
Download figure:
Standard image High-resolution imageYule–Simon processes can be formalized as the building of a history of symbols, where at every step one flips a coin with bias p to either (1) add a symbol never seen before, or (2) re-use an existing symbol in the history with uniform probability over the history of symbol positions [13, 15]. This last memory stipulation translates to the rich-get-richer phenomenon that is associated with Yule–Simon processes. As seen in the work of Cattuto et al on folksonomies, however, one can add a recency bias to the process, weighting the probability of more recent symbols in the simulated history higher [15, 16] than more distant ones. This has implications for the F–R distribution resulting from the history constructed with the memory-modified, or 'augmented', Yule–Simon process (see supplementary material for the effects on F–R distributions translating from a standard infinite memory to one with high recency bias).
We now investigate the empirical properties of the histories of co-labels surrounding each of the anchor labels in table 1, built by individuals in their profile updates. Figure 3 shows the autocorrelation of co-labels contributed over all relevant profile updates in our data. Autocorrelation here is the probability of identical co-labels  positions apart in the flattened history of co-labels for an anchor label. As a toy example from figure 1, a hypothetical chronological ordering of profile updates [{#bluewave, #lgbtq, #resist}, {#bluewave, #firefly, #resist, #startrek, #starwars}] would give a flattened history of [#bluewave, #lgbtq, #firefly, #startrek, #bluewave, #starwars], removing the anchor label and randomizing intra-profile label order, and giving an autocorrelation of 1/2 at
  from the identical #bluewave. The drop-off seen for very small
  in both empirical and null results comes from co-labels in the same profile being compared, and therefore unable to be identical as elements from the same set.

Figure 3. Autocorrelation of the co-labeling histories for each of the anchor labels in table 1. We observe a bias in autocorrelation toward small  in all cases, relaxing towards the 95% pointwise null confidence interval band afforded by random permutation of chronological profile update order in the data. Power-law fits decaying towards expected null random-order autocorrelation indicate the tendency for groups to collectively use similar co-labels in close temporal proximity. The drop-off seen for very small
  in both empirical and null results comes from co-labels in the same profile being compared, and therefore unable to be identical as elements from the same set.
Download figure:
Standard image High-resolution imageWe observe a bias in self-similarity toward small  for all anchor labels, relaxing toward the baseline null autocorrelation obtained by random permutation of chronological profile update order in the data (95% pointwise confidence interval band). In addition, we present the expected null random-order autocorrelation of co-labels
  where pi
is the probability co-label i for a particular history. Every pi
corresponds to a ranked probability plotted in a F–R distribution, as in figure 2 for #resist. See supplementary material for autocorrelation over the full range of
where pi
is the probability co-label i for a particular history. Every pi
corresponds to a ranked probability plotted in a F–R distribution, as in figure 2 for #resist. See supplementary material for autocorrelation over the full range of  afforded by the data.
We take a cue from Cattuto et al [14, 15], fitting this autocorrelation decay with a power-law in  over the random-order expectation:
  , where α is a normalization factor, λ indicates decay rate, and c is defined as before. We fit for
  to avoid the drop-off caused by intra-profile co-labels discussed earlier. Note that these fits are not meant to show definitive power-law behavior for each anchor label, but as a general principle of bias for these groups to collectively use similar co-labels in close temporal proximity.
Taking this empirical evidence for recency bias in collective self-labeling behavior, we employ an augmented Yule–Simon simulation model including memory bias similar to Cattuto et al to reproduce the behavior in any empirical co-labeling history H [14, 15]. Beginning with an opening sequence of n0 labels, we build a simulated history  by adding single labels at each step t up to a final length of
  . For each step t, we flip a biased coin. With probability p, the model appends a new label not seen in the history before; with probability
  , it looks back in time and selects an existing label to append, according to the following mass function:

where x is the number of steps back in time from t and factor Qt
normalizes  to 1. The form of this mass function is inspired from the general autocorrelative behavior seen in figure 3. Parameter τ controls the memory behavior of the model, where lower τ biases the selection of labels to those most recently added to
  (see supplementary material).
We fit the simulated F–R results of this model to empirical anchor label F–R distributions via parameter search over p, τ, and n0, fixing T to the empirical history length for the anchor label (i.e. the number of co-labels in table 1). n0, the parameter governing the length of the starting sequence for each simulated history, takes three values spanning evenly in  space from
  to
to  . These values are chosen to smoothly capture the range of effects n0 has on the resulting F–R distribution (see supplementary material). The starting sequence itself is filled with n0 distinct symbols.
We select τ search values on a spectrum between two extremes of labeling memory behavior. As a lower bound, τ = 0 recovers a simple power law, with historic probability selection biased towards recently used co-labels. As τ increases, this normalized power law gradually approaches a uniform distribution over historic labels, eliminating any memory bias and approaching the standard Yule–Simon model [11, 12]. We approximate this limiting behavior with an upper bound of  213 9800, since #maga has the largest number of co-labels, and therefore the largest history to simulate. We sample τ on a
  scale to guarantee a smooth transition between the two memory modeling extremes (see supplementary material). Through experimentation, we sample p search values linearly,
  .
.
We conduct the parameter search for a single anchor label's  by running the simulation for every parameter combination
  over parameter samples described above. Given a single parameter combination, we simulate
  30 times, obtaining normalized F–R distributions for each. We calculate the error of the model given the parameters as the sum of absolute residuals of the mean simulated F–R values vs their empirical counterparts. We search through all parameter combinations 80 times. The best parameter combination produces the lowest error in the search, therefore the mean simulated F–R distribution most similar to the measured distribution. Figure 4 shows the error contours produced by the search over p and τ, given the best n0, for three example anchor labels. The best
  combination is marked, and the resulting simulated F–R distribution mean and 95% pointwise confidence interval band for 250 simulations is plotted against its empirical counterpart. Lowest error parameter combinations are robust to random variation in simulation, settling into local basins of the error landscape over the 80 repeated parameter searches.

Figure 4. Simulation results for the co-labeling histories of the five example anchor labels in table 1, using the Yule–Simon process with biased memory described in the text. Lower τ corresponds to greater recency bias in the model. Left column: comparison of simulation-derived frequency-rank (F)–(R) distributions vs. empirical data for the lowest-error parameter combination found. Simulated F–R outcomes are represented with point-wise mean and 95% pointwise confidence intervals of normalized frequency values per rank from 250 simulations. Right column: error contours produced by the search over p and τ, given the best n0, for the anchor label in each row. The grid of points represents the p and τ searched. For each anchor label, the heatmap overlaying the error contour indicates the lowest-error parameter combinations over 80 parameter searches. Black points indicate the overall best combination whose values are annotated and simulation results displayed in the corresponding F–R distribution plot at left. The horizontal line spanning each contour indicates an approximate lower bound for τ beyond which the augmented Yule–Simon process becomes a pure Yule–Simon process (see supplementary figure 3). Lowest-error parameter combinations are robust to random variation in simulation, settling into local basins of the error landscape, and typically reside outside the zone recovering a pure Yule–Simon model.
Download figure:
Standard image High-resolution image
3. Discussion
We suggest that the dynamics of collective self-labeling on Twitter studied in this work are similar to that of folksonomies, even though the latter pertains to multiple individuals labeling different external objects and the former to only one 'object' being labeled: the individual's own identity. Hence, the self-labeling process on social media could be viewed as a folksonomy of 'many selves' over time, with semi-permeable barriers between individuals' self-curation. Instead of individuals tagging each others' identities directly, as in the simple folksonomy analogy, individuals can curate the meaning of identity labels by expression of their own changing sense of identity, adopting common and evolving 'zeitgeists' of what specific hashtags mean.
This study seeks to show the applicability of models that describe the dynamics associated with folksonomies to the process of collective identity formation from individual self-labeling. As an initial step, we have treated the co-labeling of specific, common anchor labels as a blended group behavior. Given the recency bias in co-labeling behavior across multiple individuals in figure 3, it seems like common patterns of labeling for each of these concepts (#resist, #music, etc) are affected by social trends. Therefore, both the historical aspect and the novelty aspect of a Yule–Simon process would seem to be combinations of personal and socially-influenced behaviors. Incorporating these separate social vs. personal aspects is an obvious next step, in a similar expansion as what has been done previously with folksonomies and collective online behavior [17, 18].
Another relevant process to consider for accumulation of co-labels around each anchor label is the Chinese restaurant process (CRP)[19]. Both the traditional Yule–Simon and CRP select the addition of an existing co-label with probability proportional to the existing labels' relative presence in the labeling history. However, the CRP explicitly sets the probability of adding a new, unforseen label inversely proportional to the length of the history at the time of addition. In the Yule–Simon process this parameter is constant and independent of history length.
4. Conclusion
In this work, we collect an unprecedented data set of self-labeling on Twitter, harvesting timelines of self-labels inherently connected to an individual's sense of identity from their presence in designated self-descriptions. The self-labeling updates in these timelines are made by individuals interested in curating their online identities and capture the exact instances when individuals act to curate and modify their stated identities. We demonstrate collective definition of several popular hashtag concepts through the co-labeling behavior surrounding their representative hashtags. Through autocorrelative analysis of empirical co-labeling behavior and simulation of augmented Yule–Simon processes recovering traits of the empirical data, we show the collective labeling of identities display similar stylized facts as those associated with folksonomies, indicating a potential similarity in underlying processes.
5. Materials and methods
We collected the relevant Twitter data without subject interaction, using only data that already existed and that was collected for a reason other than use in this research study. Therefore, our research project does not involve human participants. Our data collection and analysis has been reviewed and deemed 'Exempt' by the Indiana University Institutional Review Board (Protocol #1707249405). Our Twitter data is de-identified by the removal of all individual identity markers, stored on a secure server, and subsequently analyzed in the aggregate without references to the identities of individual Twitter users.
The Twitter API delivers tweet JSON objects, each containing a 'user' object with the user's self-description. Tweets obtained from the standard API provide user information reflecting information at the time of the API request, not the time of the tweet. In contrast, Twitter's streaming sample API preserves user profile descriptions as it delivers tweets in the stream, providing a historical record of self-descriptions as tweet objects are delivered. All tweet records harvested for this work come from the Twitter streaming 'decahose', a quasi-random sample of 10%[20] of daily tweets, made available specifically to researchers at Indiana University through the decahose archive of the Observatory on Social Media [21]. The user profiles are held in the 'user' object within each tweet JSON record provided, under the 'description' field. Bots are filtered out using Botometer [5, 22]. After consultation with the creators of Botometer, standard practice is to classify any user with a score  as a bot. To increase our accuracy, we consider any user with an English bot score
  to be a bot.
There is a difference between the timing of the tweet record and the timing of the profile description provided within the tweet record. The tweet provides exact timing information of the tweet itself, but only an upper bound for the timing of profile description creation. Any individual can alter their profile description at any time, and the change is not represented in API-derived data until the next time that individual tweets and the tweet is provided in the streaming sample. We are interested in a cohort of individuals who actively maintain their profiles. Therefore, for all tweets harvested for a individual: we sort them chronologically, then retain only tweet objects where the profile changes from the one before via a set difference of tokens. This necessarily throws out the earliest tweet harvested for any individual, and establishes that all subsequent profiles have been edited and therefore actively maintained in the harvesting period.
We apply the following methodology to create our user sample: we pre-screen existing decahose samples from 2012, 2013, and 2014 for users exhibiting active profile maintenance, defined as at least one profile edit within each year, producing an initial pool of 107 370 93 accounts. Using Botometer scores we exclude users with bot scores higher than the mentioned conservative threshold (based on their latest 3200 tweets up to Fall 2019), producing an potential user pool of 475 5274. We then harvest the decahose tweets of these same users occurring from August 2017 through December 2019, creating 208 9173 user profile change timelines derived from their retrieved tweets. Of these, 197 2863 have only English as their specified language in their user metadata. 347 252 of these users have profiles containing hashtags, and 121 084 have timelines certain to lie in 01 August 2017 through 31 December 2019 after discarding their initial profile description (described above). Furthermore, we exclude organization accounts marked by the Humanizr classifier [23], retaining 113 034 user accounts that were not deemed organizational but belonging to individuals. Our analysis thus focuses on a smaller, vetted subset of individuals whose interaction with the top-five anchor labels is described in table 1. We specifically end collection before 2020 to avoid the exogeneous influence and possible discontinuities introduced by the COVID pandemic.
The following is a rigorous definition of our profile update formulation. Let φ denote a hashtag that is used to label identity and Φ as the set of all hashtags used in our data set. Each tweet, posted at time instance i, that we obtain for a individual u can contain a set of hashtags, denoted by  . Thus, for each individual, we obtain a time-ordered sequence of profile hashtag sets
  , in which ou
denotes the number of tweets that we obtained for individual u and i indexes increasing time. We are interested in the profile instances where a individual decides to update their expression of self, assembling a set of self-labels containing at least one new label and possibly reusing previous labels. Therefore we build a sub-sequence of profile updates Uu
out of Lu
for every individual u, retaining every hashtag set that includes labels not present in the set directly previous:
, in which ou
denotes the number of tweets that we obtained for individual u and i indexes increasing time. We are interested in the profile instances where a individual decides to update their expression of self, assembling a set of self-labels containing at least one new label and possibly reusing previous labels. Therefore we build a sub-sequence of profile updates Uu
out of Lu
for every individual u, retaining every hashtag set that includes labels not present in the set directly previous:  .
.
Label sets in any individual's Uu
hold two desirable qualities for the study of identity: (i) they represent the instances when a individual shows interest in redefining self, and (ii) they hold label combinations that are significant to the individual when defining self. From these qualities, we can measure how labels relate to one another in the broad context of identity definition for the population of individuals. Taking a high-level perspective, we pool all profile updates into  . Selecting a particular hashtag as an 'anchor' label of interest, we collect all the update sets in
  where this anchor label is present. Then, we can summarize collective co-labeling behavior in the context of this anchor label in a F–R distribution, shown in figures 2 and 4.
Acknowledgment
A T J B and J B are grateful for support from the NSF Social, Behavioral and Economic Sciences [SBE] Grant 1636636. A T J B was partially funded by the National Science Foundation NRT Grant 1735095, 'Interdisciplinary Training in Complex Networks and Systems.' Any opinions, findings, and conclusions or recommendations expressed in this material are those of the authors and do not necessarily reflect the views of the National Science Foundation. We thank the Observatory on Social Media and the Network Science Institute at Indiana University, with support from the Knight Foundation and Craig Newman Philanthropies, for making the Twitter profile data available to our analysis.
Data availability statement
The code and datasets generated and/or analyzed during the current study are available in the GitHub repository https://github.com/CogentMentat/Online_Identity_Collective_Labeling_Process, archived at Zenodo repository https://doi.org/10.5281/zenodo.7065809, in the following forms: Per the Twitter Developer Agreement and Policy, raw tweet and profile data is not allowed to be redistributed, but we do include a supplementary file of the Twitter User IDs whose profiles are analyzed in this work. Profile data for these users may be harvested through the Twitter API. We also provide the profile hashtag updates analyzed in reduced form: with time ordering and user marker information, but without Twitter User IDs.
Contributions
A T J B and J B defined the research methodology. A T J B. collected the data and performed the analyses. A T J B, J B, and M t T co-authored the manuscript text.
Conflict of interests
The authors declare that they have no competing financial interests.
Supplementary data (0.9 MB PDF)