
Abstract
Reinforcement corrosion seriously impacts the bearing capacity and durability of reinforced concrete(RC) structures. It is very important to detect reinforcement's corrosion state in concrete timely and effective. This paper introduced the magnetic memory method to the quantitative detection of reinforcement corrosion. Based onfirst- principles, the causes of material magnetism were explained from the point of view of particles. The microscopic models of reinforcement corrosion were established and the correlation between the absolute value of magnetization M and mass loss rate α had been analyzed. The experiment of magnetic memory testing of the rebar corrosion was carried out, and the magnetic induction curves of the rebars at different mass loss rates were obtained. Finally, the random forest algorithm was used to realize the quantitative recognition of steel corrosion. The results of microscopic models showed that |M| increased nonlinearly with α. The tangential and normal magnetic induction curves obtained by the experiment showed a trend of overall movement and increasing volatility with the increase of α, then four magnetic indexes (I1xn, I1zn, I2xn, I2zn) were proposed based on tangential and normal magnetic induction curves to characterize the mass loss rate α. The regularity of I-α curves was consistent with that of |M|-α curves obtained by the microscopic model. The random forest algorithm was introduced to solve the nonlinear and discrete problems of magnetic indexes, and a hierarchical prediction model of rebar corrosion was established. The prediction accuracy of the model was 85.7%, which can realize the state recognition of steel bars under low corrosion degrees.
Export citation and abstract BibTeX RIS
1. Introduction
Rebar corrosion is one of the significant diseases of concrete structures, which seriously affects the bearing capacity and durability of concrete structures [1, 2]. Timely and effective detection of the corrosion state of the rebar inside the structure is a difficult problem to solve in the field of civil engineering.
The electrochemical method is a widely used nondestructive testing method for steel bar corrosion at present, but it requires surface treatment of concrete and can only provide a fuzzy qualitative evaluation of the corrosion status of steel bars. To realize non-destructive quantitative detection of steel bar corrosion, physical methods [3–9], including ultrasonic testing (UT), infrared thermography, acoustic emission(AE), magnetic flux leakage (MFL), and metal magnetic memory (MMM), have been developed rapidly. Among them, the magnetic memory method [7, 9] uses the 'natural magnetic field' around the steel bar to detect and evaluate its corrosion state without an excitation device. In addition to detecting macroscopic defects of ferromagnetic components, the magnetic memory method can also detect stress concentration, which has great advantages and has aroused the attention of many experts and scholars.
In terms of mechanism research, the self-leakage magnetic field theory [10–12] proposed by Dubov is the main one. The theoretical magnetic field distribution can be solved by the magnetic dipole model and finite element simulation based on the Maxwell equation. The analysis results of the theoretical model show that the tangential magnetic field of the defect site will have a wave peak, and the normal magnetic field will reverse to form a wave peak and trough, and the fluctuation amplitude increases with the corrosion depth.
In terms of experimental research, Zhou Jianting and Zhang Hong [13–15] used the magnetic memory method to detect the corrosion of steel bars inside concrete, and the obtained magnetic field distribution curve was similar to the theoretical magnetic field, so the corrosion location of steel bars could be determined according to the magnetic field distribution characteristics. However, the quantitative detection of steel corrosion is a major difficulty in this field, and the 'natural magnetic field' is easily affected by other factors. A series of literature [2, 16–18] studied factors such as initial magnetic field, environmental magnetic field, steel bar size, and lifting height, and proposed methods to reduce the impact of these factors. The magnetic indexes were constructed based on the magnetic field curve, and they were positively correlated with the mass loss rate of the steel bar, but the indexes were non-linear and discrete.
The existing theoretical model can only describe the magnetic field distribution characteristics of corroded rebars, and cannot deeply explain the essential reason of magnetization induced by corroded rebars. The microscopic mechanism of magnetic memory quantitative detection of steel corrosion is unclear, and the evolution law of magnetic characteristics induced by steel corrosion on the atomic scale is lacking. The nonlinear and discrete properties of magnetic indexes in the experiments also seriously affect the quantitative detection of steel corrosion.
Therefore, based on first principles, this paper analyzed the intrinsic reasons for the magnetic properties of rebar, established three kinds of Fe supercell models, and obtained the relationship between the mass loss rate α and the absolute magnetization intensity |M|. A magnetic memory detection test of corroded rebars was carried out, and the relationship between magnetic characteristics and the mass loss rate of the rebar was explored. Finally, the random forest algorithm was used to achieve the classification prediction of steel corrosion, which provided a way for quantitative detection of steel corrosion in engineering structures.
2. Microscopic modeling and result analysis
First-principles is based on the principle of interaction between the nucleus and electron. It is an algorithm to solve the Schrodinger equation directly after some approximate processing according to specific requirements. First-principles can be used to calculate the energy band structure, the density distribution of electronic states, and the atomic magnetic moment of iron, and thus reflect the microscopic mechanism of the magnetic memory effect [19, 20].
The metallographic structure of the rebar mainly consists of ferrite and pearlite, in which the proportion of ferrite is the largest and the carbon concentration in the ferrite is very small. The magnetic calculation of the ferrite can be realized by the α-Fe cell model, and a small amount of doping elements will not have a major impact on the magnetic characteristics [21], so the microstructure of the rebar can be simplified to the α-Fe cell model.
The Castep module in the Material Studio software was used to establish the α-Fe body-centered cubic lattice, and the single crystal cell structure was shown in figure 1. The K-point sampling was 16 × 16 × 16, the truncation energy of the plane wave basis function was 280ev, and the test value of the equilibrium lattice constant of Fe was 2.810 × 10⁻¹⁰m [22].
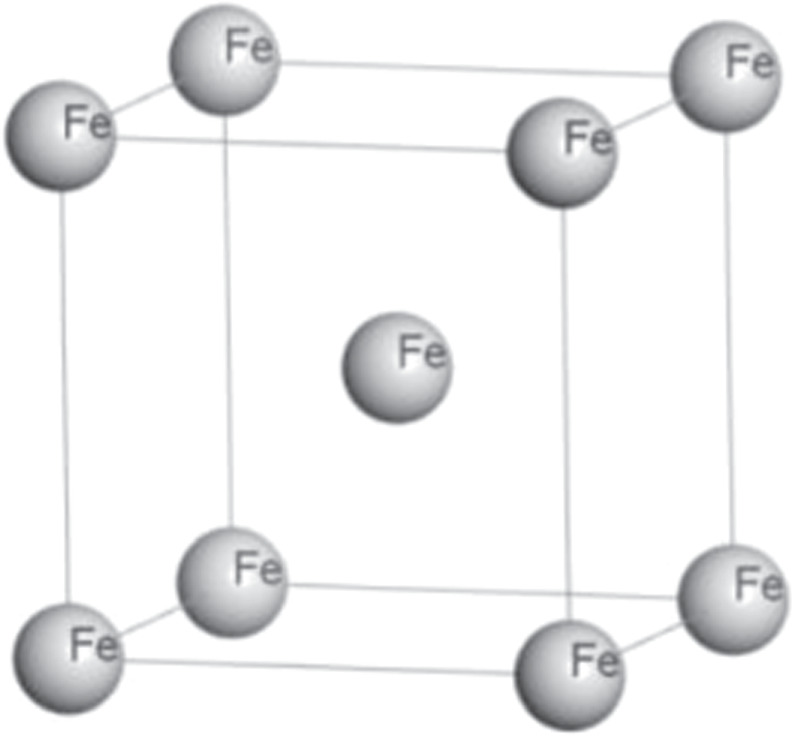
Figure 1. The single crystal cell of α-Fe.
Download figure:
Standard image High-resolution imageThe spin state density and band of electrons were calculated based on the α-Fe single crystal cell structure, and the calculation results were shown in figure 2.
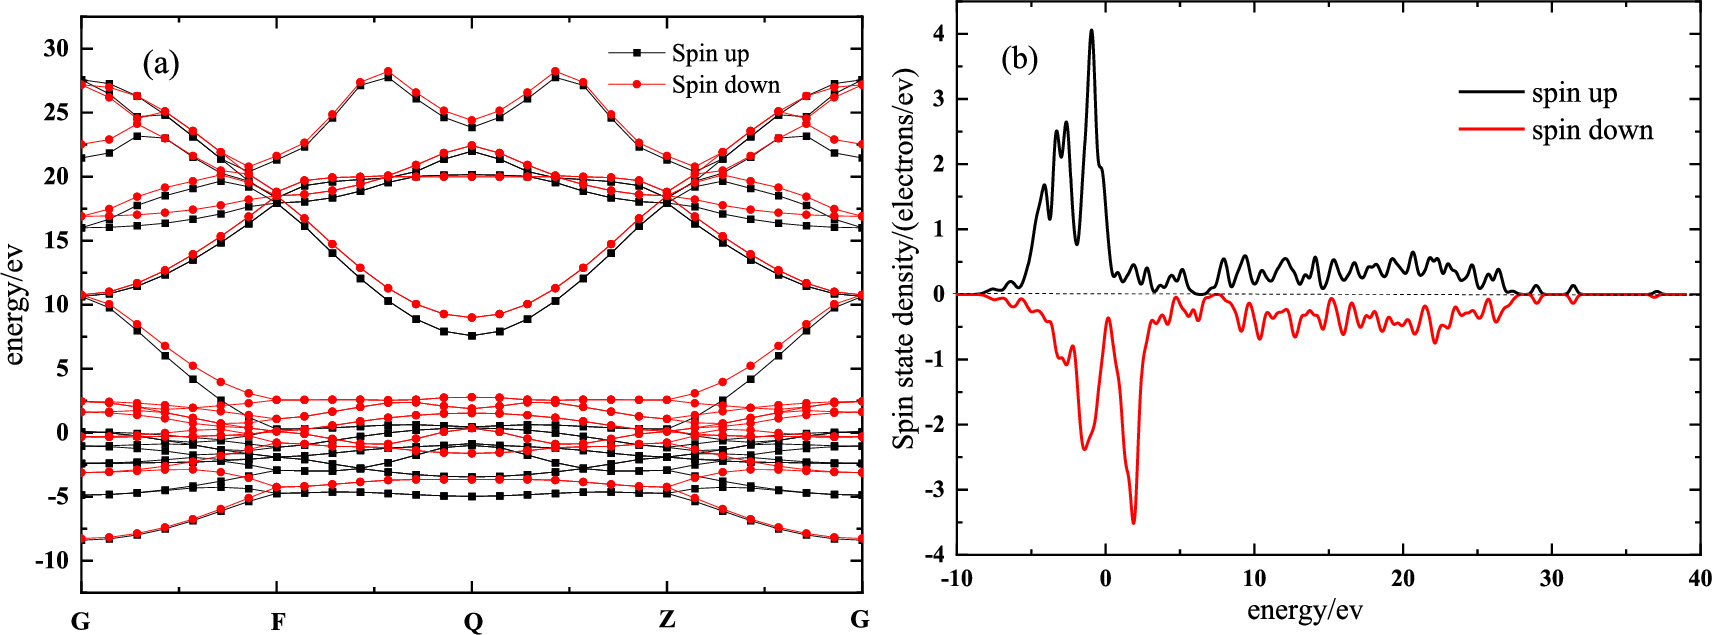
Figure 2. Energy band and state density distribution of α-Fe: (a) The energy band structure of Fe; (b) The distribution of spin state density.
Download figure:
Standard image High-resolution imageIt can be seen from figure 2(a) that the energy bands of the two kinds of spinning electrons did not coincide, indicating that they had different spatial wave functions. Meanwhile, in figure 2(b), the electron state density diagram showed that the upspin electron and the downspin electron were asymmetrical for the Fermi surface, and the two cannot be offset, so the remaining part would produce magnetic moments. In summary, it showed the crystal had good magnetism.
The above analysis explained the origin of the magnetic properties of steel bars from a microscopic scale. It is necessary to establish a microscopic model to investigate the variation of atomic magnetic moment after steel corrosion. Corrosion of steel bars leads to surface defects, and the iron is oxidized to rust. The main component of rust is Fe2O3, which belongs to the α cell structure in the natural state and does not have magnetic properties, so the steel corrosion can be simplified to simulate the absence of some Fe atoms in the crystal. The fundamental cause of atomic magnetic moment is electron exchange. If some atoms are missing in the cell, the exchange of the corresponding electrons will be lost, and the magnetic moment of the remaining atoms will change.
The single crystal cell model has been established(figure 1), which expanded in the direction of a, b, and c to form different Fe supercells (1#, 2#, 3#), as shown in figure 3.
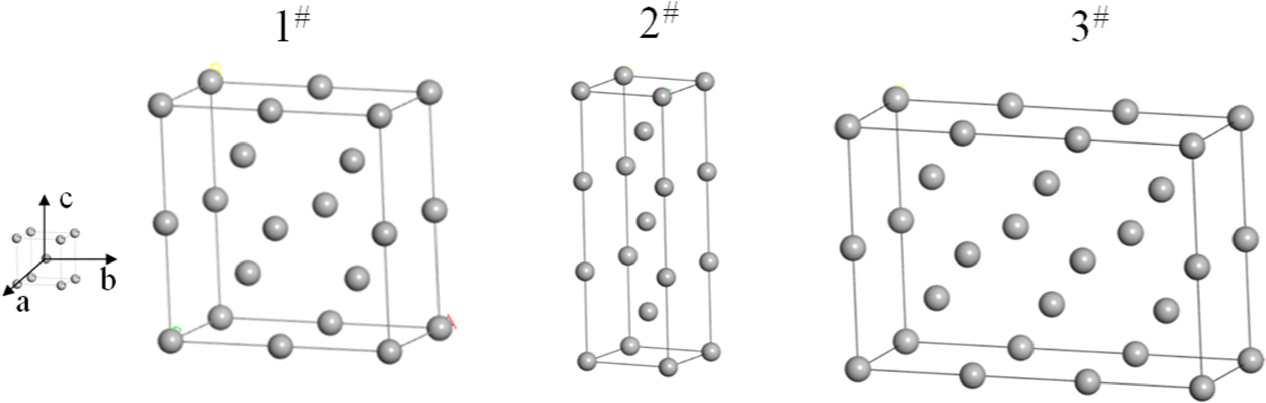
Figure 3. The different supercells.
Download figure:
Standard image High-resolution imageThe experimental measurement of the magnetic moment of a Fe atom is 2.21 μB [23], where μB is the magnetic moment produced by an electron orbiting the nucleus. The magnetic moments of Fe atoms in different supercells were calculated (set the initial magnetic moment to be 2 μB, spin polarization was considered, GGA function was used, truncation energy was 350 ev, and ultra-soft pseudopotential was adopted), and the convergence of the three kinds of supercells was shown in figure 4.
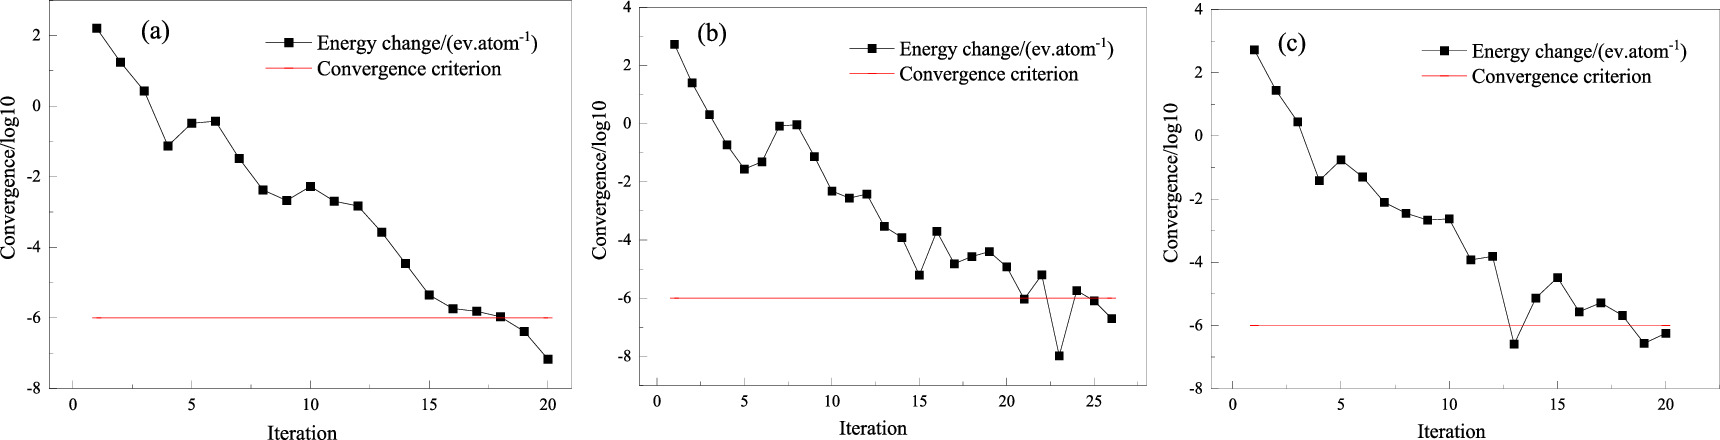
Figure 4. Convergence of three supercells: (a) 1# supercell; (b) 2# supercell; (c) 3# supercell.
Download figure:
Standard image High-resolution imageFigure 4 showed that the three supercell models reached the convergence standard after iterating a certain number of steps, indicating that the system met the principle of energy minimization and the system was in a stable state, and the calculated results at this time can accurately reflect the magnetic properties of the system.
The magnetic moments of Fe atoms calculated by three supercells were 2.26 μB, 2.32 μB, and 2.32 μB, respectively. The calculated values(2.26 μB, 2.32 μB, and 2.32 μB) were close to the experimental values in reference [23] (2.21 μB), indicating that the models were reliable.
The corrosion of steel bars was simulated by the absence of Fe atoms in the supercell, and the magnetic moments of Fe atoms at different mass loss rates were calculated. Taking 1# supercell as an example, the magnetic moment of each atom in the supercell was calculated when different numbers of atoms were missed, as shown in figure 5.
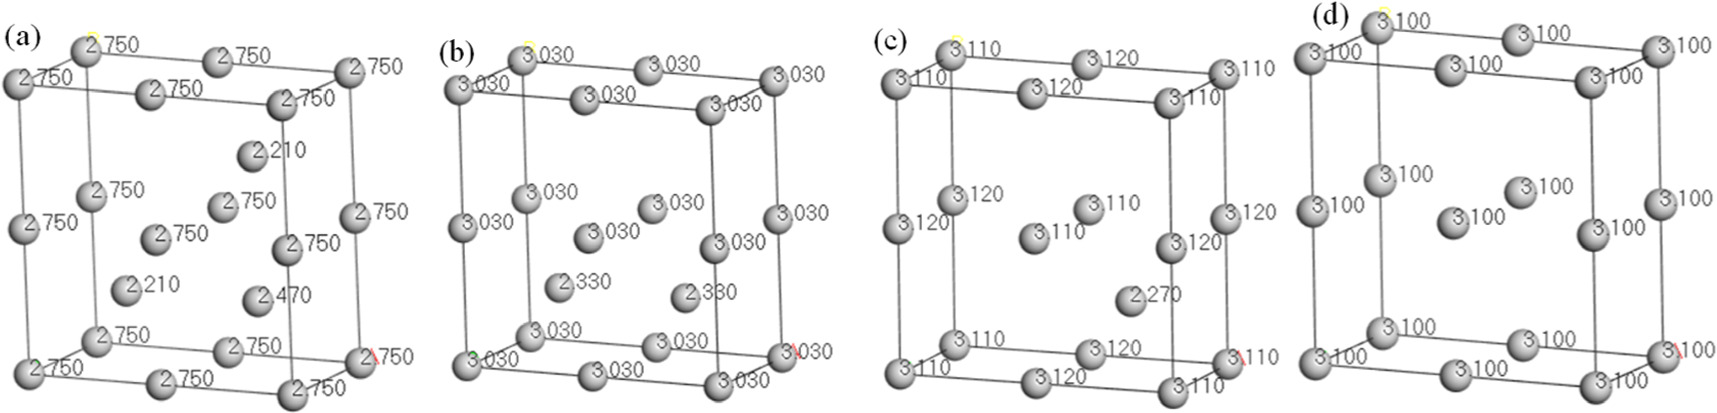
Figure 5. The magnetic moments of atoms of 1# supercell with different mass loss rates: (a) One atom was missing; (b) Two atoms were missing; (c) Three atoms were missing; (d) Four atoms were missing.
Download figure:
Standard image High-resolution imageFigure 5 showed that the atomic magnetic moment changed after the supercell defects occurred, which was because the exchange action caused by the missing atom changed. The relationship between the atomic magnetic moment and magnetization is shown in equation (1).

Where M is the spontaneous magnetization, μi is the atomic magnetic moment, and V is the volume. M is a vector, and positive and negative indicate that the direction of magnetization is different. Here we should focus on exploring the relationship between the absolute value of magnetization and the mass loss rate. Assuming that the volume occupied by each atom in the supercell is the unit volume, the absolute magnetization of the supercell can be calculated.
The mass of each atom in the Fe supercell is equal, the mass loss rate is the loss rate of the number of atoms. For example, in figure 5(a), the α of the supercell with one atom missed was 0.05, and the number of remaining atoms of the supercell was 21. There were 18 atoms with a magnetic moment of 2.75 μB, 2 atoms with a magnetic moment of 2.21 μB, and 1 atom with a magnetic moment of 2.47 μB, and the absolute magnetization of the supercell was calculated as follows:

|M| of the three kinds of supercells under different mass loss rates were calculated in turn. The relationship between the mass loss rate of the supercell and the absolute magnetization is shown in figure 6.
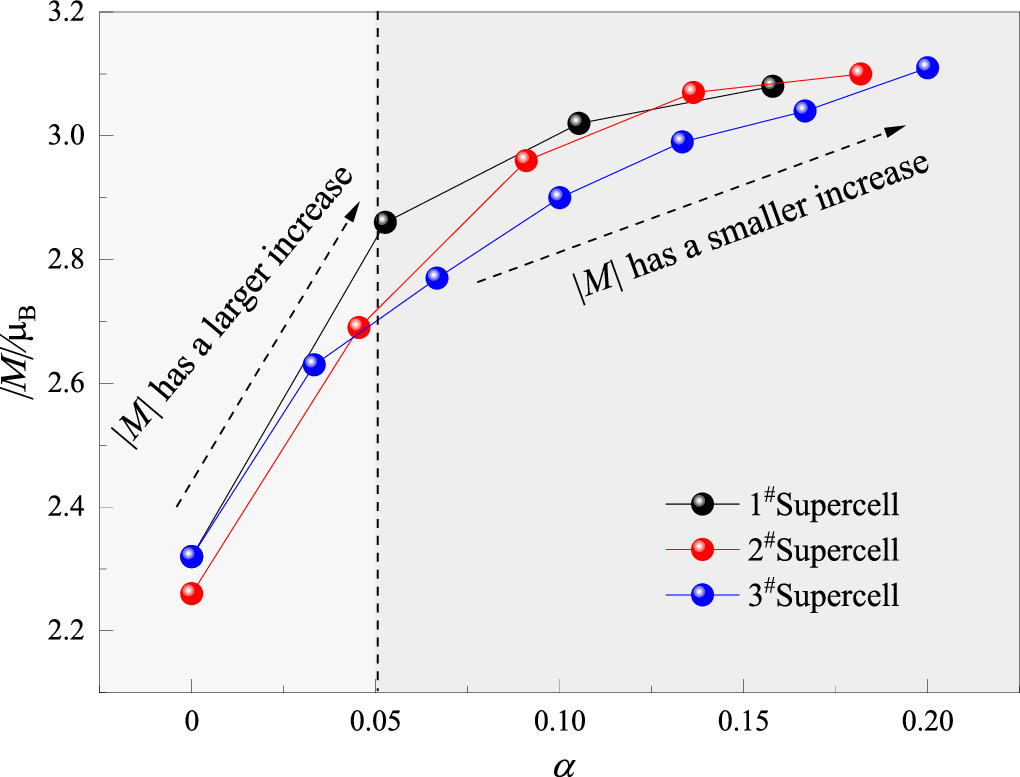
Figure 6. The relationship between |M| and α of the supercells.
Download figure:
Standard image High-resolution imageFigure 6 showed that |M| was positively correlated with α, and the growth range of |M| was inversely proportional to α.
Based on first-principles, the essential reasons for the magnetic properties of steel bars were analyzed, and the evolution of magnetic characteristics induced by corroded rebar was explored from the atomic scale, which provided microscopic support for the detection of corroded rebar by magnetic memory.
3. Experimental details
Nine threaded rebars with a diameter of 16 mm and a length of 1.6 m were prepared, and the steel bars were numbered 1#−9#, as shown in 7(a). The rebar corrosion was accelerated by the constant current method. The rebar was immersed in 5% NaCl solution and connected to the positive terminal of the DC power supply through a wire, and the carbon rod was connected to the negative electrode of the DC power supply. Therefore, the rebar, the carbon rod, the NaCl solution, and the DC power supply formed a closed loop. When energized, the Fe atoms lost electrons and were oxidized, thus accelerating the corrosion of the rebar, as shown in figure 7(b).
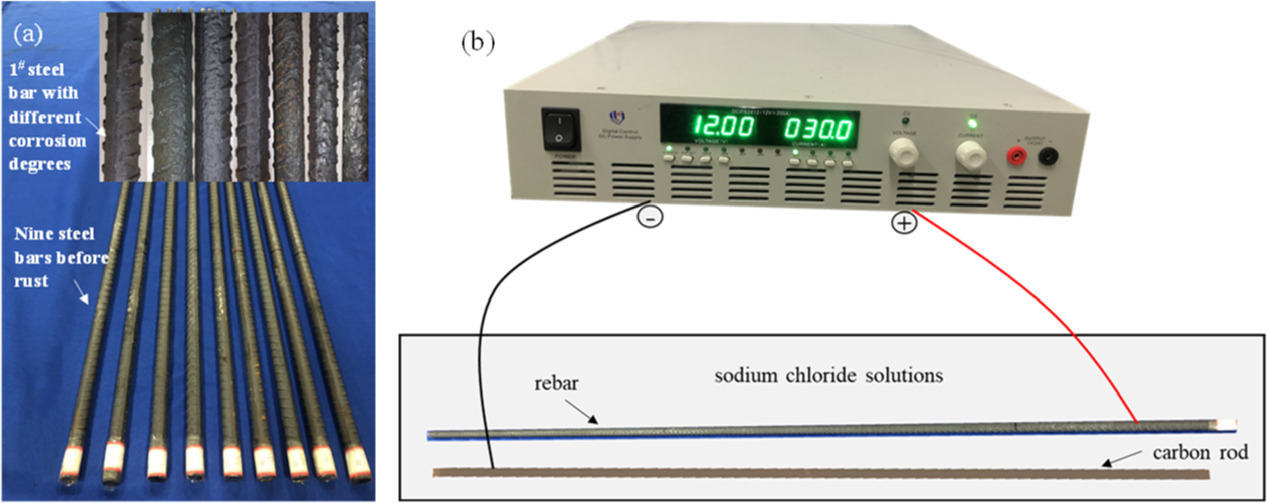
Figure 7. The corrosion of reinforcements: (a) Reinforcement before and after corrosion; (b) Accelerated corrosion of reinforcement.
Download figure:
Standard image High-resolution imageEach rebar was subjected to seven stages of corrosion, and the time and current of energize were set. The mass loss rate α of the seven stages was calculated according to the relevant formula of Faraday's first law of electrolysis, and the specific formulas were as follows:


In the above equations, Δw is the corrosion amount of steel bar in the time of T, m is the molar mass of iron(m = 55.847 g mol−1), n is the number of valence electrons lost by the iron atom(n = 2), F is Faraday constant (F = 96485 C), I is the corrosion current, T is the corrosion time, w is the quality of the rebar before rusting, D is the diameter of the steel bar before corrosion, ρ is the density of iron with the value of 7.8 g cm−3, l is the length of corroded steel bar. The calculation results were shown in table 1.
Table 1. The mass loss rate of reinforcement in each stage.
| Stage of corrosion | 1 | 2 | 3 | 4 | 5 | 6 | 7 |
|---|---|---|---|---|---|---|---|
| Time/s | 5760 | 11520 | 17280 | 23040 | 28800 | 57600 | 86400 |
| Current/A | 30 | 30 | 30 | 30 | 30 | 30 | 30 |
| α | 0.02 | 0.04 | 0.06 | 0.08 | 0.10 | 0.20 | 0.30 |
A magnetic scanning device was used to collect magnetic signals of rebars at different corrosion stages. The magnetic sensor was fixed at the front of the scanning device and can move along three fixed tracks. The three-dimensional magnetic inductance (Bx , By , Bz ) at a certain point in the space was collected, and the detection accuracy can reach 10−7T. During the detection, the magnetic probe was located directly above the rebar, 3.5 cm away from its upper surface, and the scanning range was 100 cm in the middle of the rebar. The scanning process is shown in figure 8. The magnetic induction above the rebar was collected before and after each corrosion stage so that the magnetic signals corresponding to different mass-loss rates can be obtained.
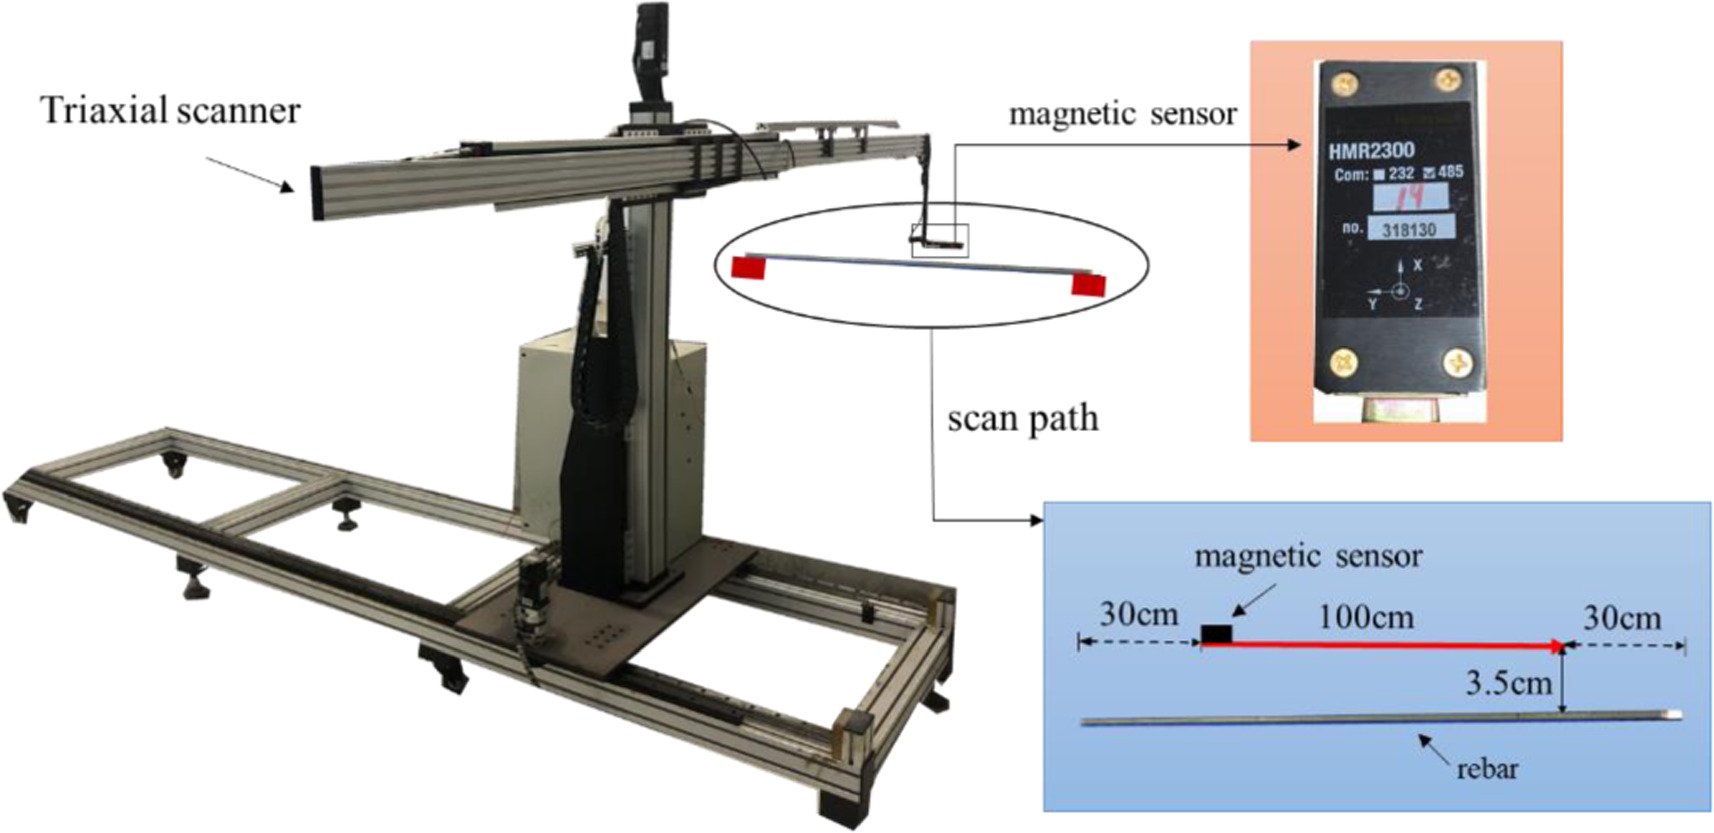
Figure 8. Magnetic signals acquisition of corroded steel bar.
Download figure:
Standard image High-resolution image4. Experimental results and analysis
The magnetic induction intensity B of rebar at different α was obtained through experiments, and the relationship between B and α was explored. According to relevant literature [18, 24], tangential magnetic induction intensity Bx along the length direction of the rebar and normal magnetic induction intensity Bz perpendicular to the length direction of the rebar had a strong correlation with the corrosion degree. The magnetic induction intensity caused by rebar corrosion as shown in formula (5).

Where Bcx,z was tangential or normal magnetic induction intensity caused by corrosion. Bix,z, and Bx,z were tangential and normal magnetic induction intensities of steel bars before and after corrosion respectively. The initial magnetic field of different steel bars before corrosion was different, so the influence of the initial magnetic field should be excluded, and Bcx and Bcz of different mass loss rates should be explored. The x-axis was set along the bar length direction, and Bcx and Bcz were taken as y-axes to draw magnetic induction intensity curves with different mass loss rates. With the change of α, the magnetic induction strength curves of all rebars had similar rules, and the curves of 5# and 7# rebars were analyzed as representatives. The Bcx and Bcz curves of rebars are shown in figure 9.

Figure 9. The magnetic induction curves of rebars at different α: (a) The Bcx curves of 5# rebar; (b) The Bcz curves of 5# rebar; (c) The Bcx curves of 7# rebar; (d) The Bcz curves of 7# rebar.
Download figure:
Standard image High-resolution imageThe rebar was magnetized due to corrosion defects, and the magnetic induction intensity also changed. Figure 9 showed that with the increase of α, the magnetic induction strength curves of the rebars presented the following rules: ① The absolute value of the magnetic induction strength of each point on the curves presented an increasing trend. ② The fluctuation of the curves increased. Combined with the characteristics of Bcx and Bcz curves, four magnetic indexes closely related to α were proposed, as shown in equations (6) and (7).


Where I1x and I2x were two magnetic indexes established by the Bcx curve, and I1z and I2z were two magnetic indexes established by the Bcz curve. Bcx,z(i) represented the Bcx or Bcz signals at the i-measured point, and Q represented the total number of detection points. I1x and I1z reflected the average level of the absolute value of magnetic induction of corroded steel bars, and I2x and I2z reflected the average level of magnetic induction intensity fluctuation at adjacent measuring points. I1x , I1z , I2x, and I2z of nine steel bars at different α were calculated and normalized to the interval [0, 1], and the relationship between normalized magnetic indexes and α was shown in figure 10.
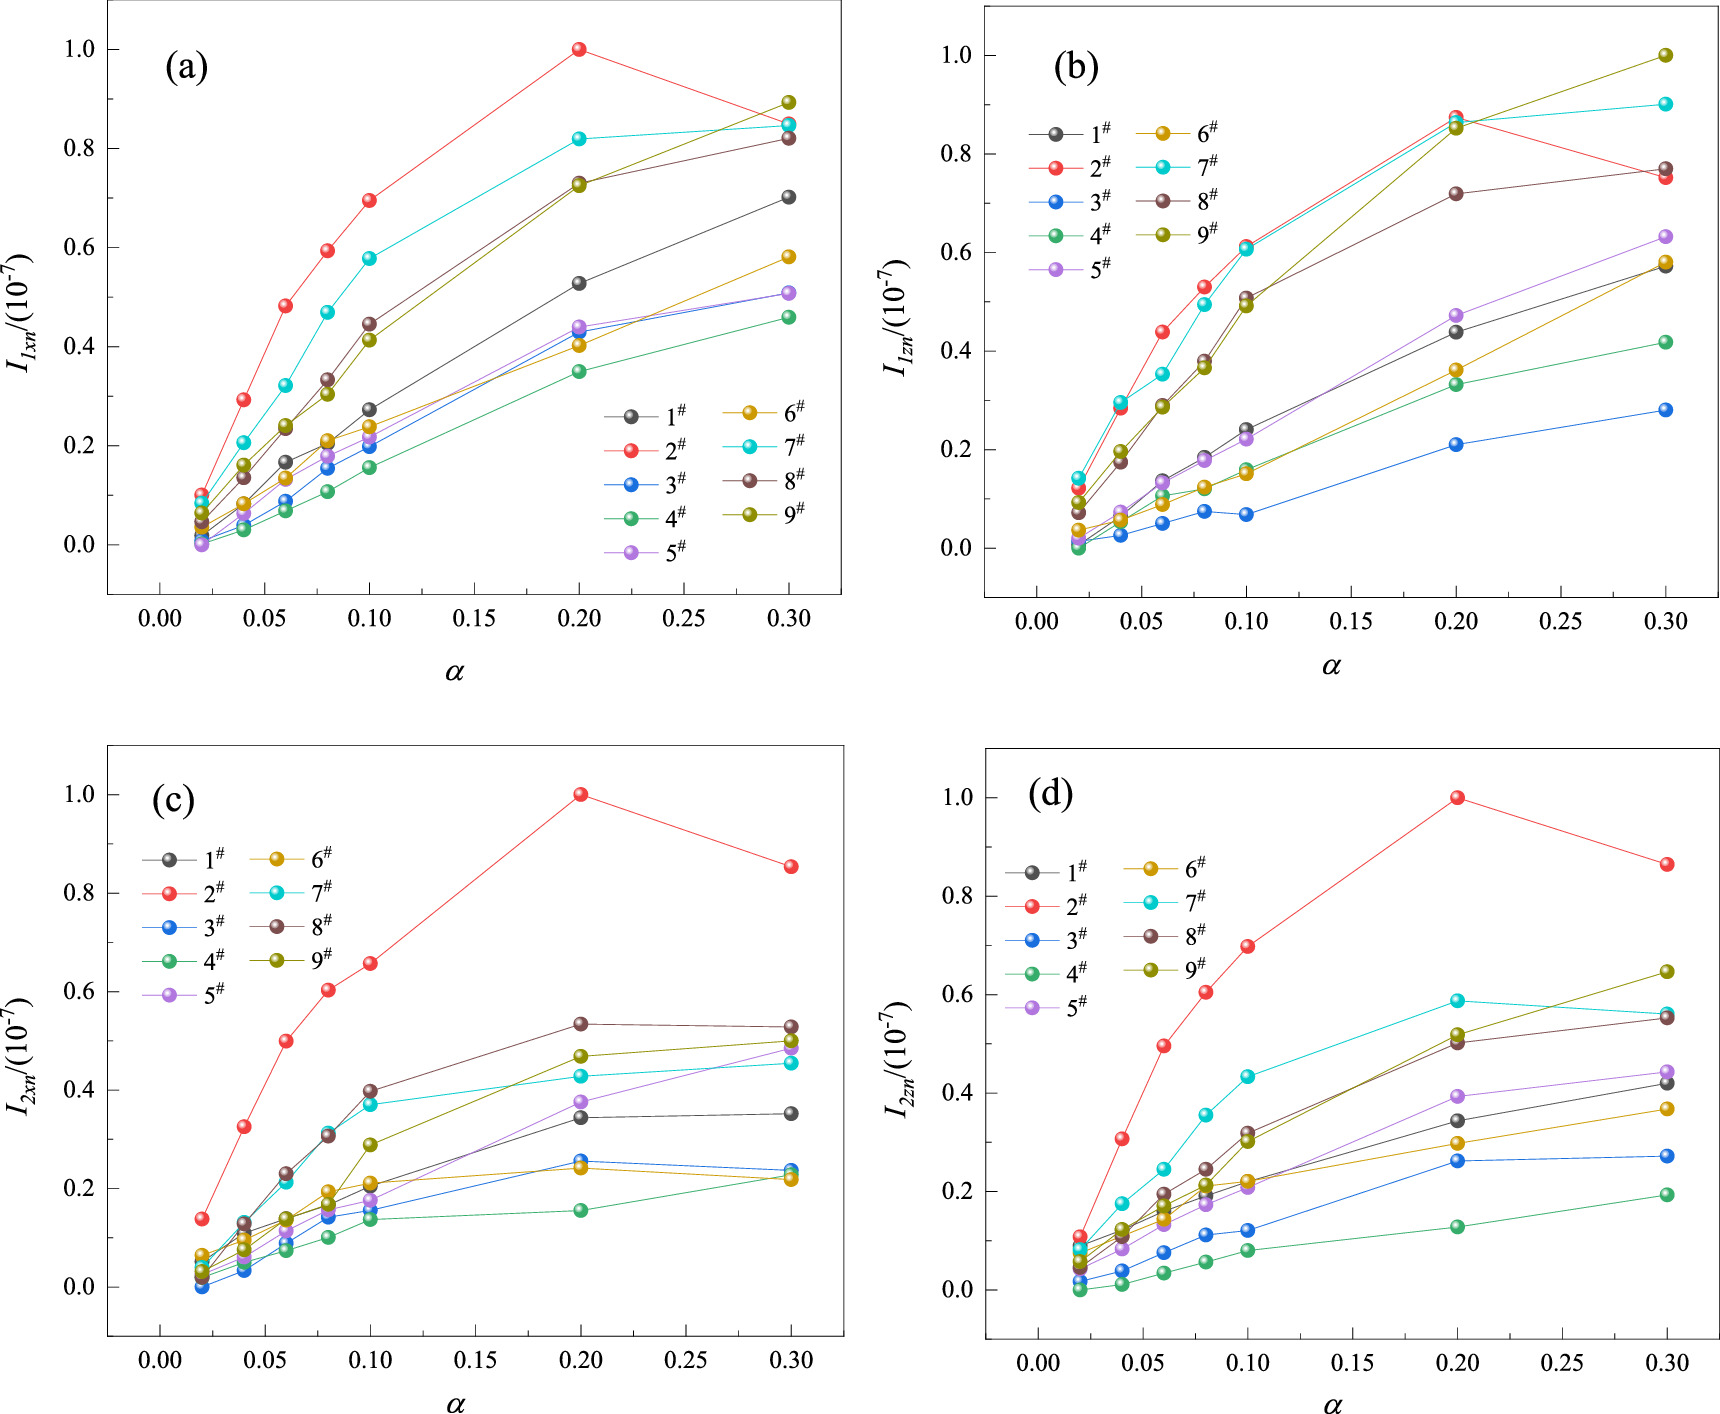
Figure 10. The relationship of magnetic indexes and α: (a) Distribution of I1xn with α; (b) Distribution of I1zn with α; (c) Distribution of I2xn with α; (d) Distribution of I2zn with α.
Download figure:
Standard image High-resolution imageFigure 10 showed that with the increase of α, four magnetic indexes showed a nonlinear growth trend, the indexes were discrete. The magnetic indexes(I1x,z , I2x,z ) were positively correlated with the magnetic induction intensity B, and the relationship between the magnetic induction intensity B and the magnetization intensity M was shown in the equation (8).

Where μ0 is the vacuum permeability (μ0 is a constant), H is the external magnetic field strength. When the external magnetic field H is constant, the B is proportional to the M. Therefore, the variation law of the magnetic indexes with the α in figure 10 was similar to the calculation results of the microscopic model in figure 6. The analysis of magnetic characteristics of steel corrosion at different scales showed that magnetic indexes had a positive correlation with the mass loss rate of steel, but the indexes were non-linear and discrete, which brought great difficulties to the quantitative detection of corrosion. According to the mass loss rates of rebars, the corrosion grade was classified, and the machine learning algorithm was used to detect the corrosion. According to relevant literature [25], when α was greater than 0.1, the bonding force between steel bars and concrete failed and cracks appeared on the concrete surface. Therefore, the magnetic memory detection should focus on the steel bars with α less than 0.1. Reinforcement corrosion can be classified as grade I (0 < α ≤ 0.02), grade II (0.02 < α ≤ 0.06), grade III (0.06 < α ≤ 0.1) and grade IV (α > 0.1).
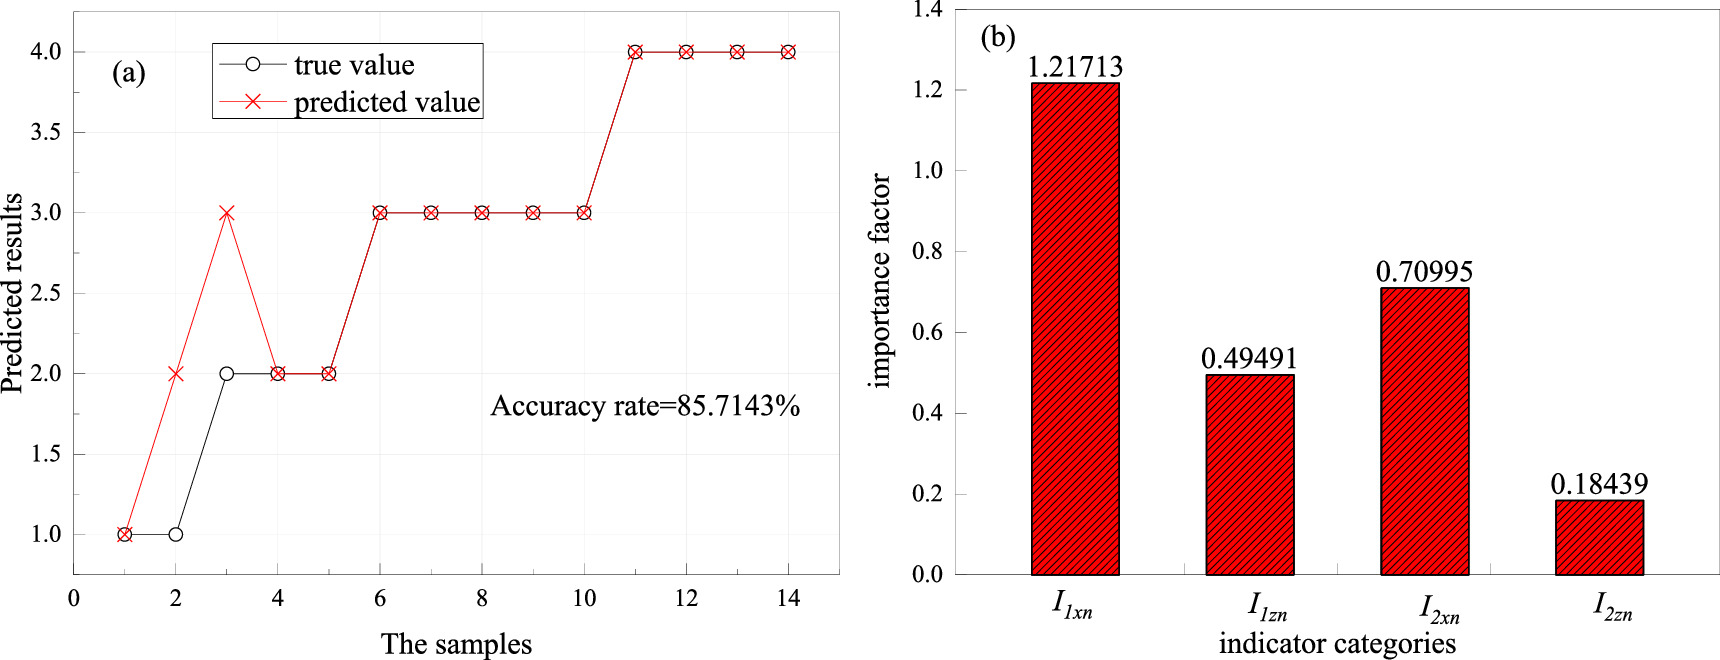
Random forest (RF) algorithm inherits the characteristics of highly efficient training and testing of decision trees and is suitable for multi-classification. Therefore, the RF algorithm was introduced into the prediction of corrosion grade in this paper. With magnetic indexes as inputs and corrosion grades as outputs, a classification model was established. The samples were randomly divided into a training set and a test set, with 49 samples in the training set and 14 samples in the test set. The classification algorithm was adopted to establish a prediction model of steel corrosion grade based on the magnetic indexes and corrosion grades of the training set. The magnetic indexes in the test set were input into the model to obtain the predicted results, and the importance of four magnetic indicators in the modeling was analyzed, as shown in figure 11.
Figure 11. Analysis of the prediction model: (a) The predicted results of the test set; (b) Significance analysis of magnetic indexes.
Download figure:
Standard image High-resolution image
Figure 11 showed that the prediction accuracy of the model based on RF reached 85.7%, which had good prediction ability. The importance coefficients of I1xn , I1zn , I2xn, and I2zn in modeling were 1.217, 0.495, 0.71, and 0.184, respectively. It showed that I1xn had a strong correlation with corrosion grade, and the correlation between I2zn and corrosion grade was weak.
The most widely used electrochemical method can only be used for fuzzy qualitative evaluation of steel bar rust, but the method proposed in this paper can evaluate the mass loss rate of corroded steel bars, which has a quantitative advantage compared with the traditional method.
5. Conclusions
Based on first-principles, the intrinsic reasons for the magnetic properties of rebars were analyzed from the microscopic scale, and the microscopic models of rebar corrosion were established. The crystal magnetizations at different mass loss rates were calculated. It is concluded that |M| was positively correlated with α, and the growth range of |M| was inversely proportional to α.
The magnetic memory experiment was carried out on nine corroded steel bars. With the increase of α, the absolute values of each point on the magnetic induction intensity curve showed an increasing trend, and the fluctuation amplitude of the curve increased. Based on tangential and normal magnetic induction curves, four magnetic indexes I1xn , I1zn , I2xn, and I2zn were proposed to characterize α. The correlation between the magnetic indexes and α was similar to the calculation results of the microscopic models, and the magnetic indexes had nonlinear and discrete characteristics.
According to α, the corrosion state of steel bars was classified into four grades. Based on the random forest algorithm, the prediction model of corrosion grades was established. The prediction accuracy of the model reached 85.7%, which can realize the state recognition of steel bars under low corrosion degrees. This method has significant quantitative advantages over traditional methods.
Acknowledgments
This work was supported by Chongqing Natural Science Foundation General Project (CSTB2022NSCQ-MSX0661), Chongqing Construction Science and Technology Plan Project (Chengke Zi 2023 No. 1-10), Science and Technology Research Project of Chongqing Municipal Education Commission (KJQN202304301).
Data availability statement
All data that support the findings of this study are included within the article (and any supplementary files).