
Abstract
Slope stability analysis is crucial since the instability of the slope contributes to the failure of many buildings in hilly areas. Numerous ground improvement techniques are used to address this issue, including vertical drains, grouting, soil replacement, geosynthetic reinforcement, and piling. Geosynthetics are used more frequently to stabilize the hill slope as an alternative and cost-effective approach. The behavior of a geogrid reinforced slope was investigated in the current work utilizing 3D numerical analyses using the finite element program MIDAS GTS NX 2021 v1.1. Five types of geogrid are made up of different materials such as Polyethylene Terephthalate (PET), High-Density Polyethylene (HDPE), Low-Density Polyethylene (LDPE), Polypropylene (PP), and Polyvinyl Chloride (PVC) were considered to stabilize the slope. The percentage Increase in Factor of safety for PET, HDPE, LDPE, PVC and PP Geogrid reinforced slopes are 18%, 17.1%, 16.7%, 15.6% and 16.3% respectively as compared to Unreinforced slope. The percentage decrease in deformations for PET, HDPE, LDPE, PVC and PP Geogrid reinforced slopes are 97%, 78.4%, 64.79%, 78.17% and 49% respectively as compared to Unreinforced slope. The PET geogrid reinforced Slope provides a higher factor of safety and lower deformation among other geogrid reinforced Slopes because PET geogrid provides maximum pull-out resistance among different types of geogrid. Similarly, the strain induced in PET geogrid-reinforced slope is minimum among other geogrid-reinforced Slopes due to the lower stiffness of PET geogrid. Hence the slope reinforced with PET geogrid performed well compared to different geogrid-reinforced slopes.
Export citation and abstract BibTeX RIS
List of Abbreviations
| PET | Polyethylene Terephthalate |
| FOS | Factor of Safety |
| LEM | Limit Equilibrium Method |
| FE | Finite Element |
| FEM | Finite Element Method |
| SEM | Spectral Element Method |
| CFS | Critical Failure Surface |
| PSO | Particle Swarm Optimization |
| GWO | Grey Wolf Optimization |
| SRM | Strength Reduction Method |
| SRF | Strength Reduction Factor |
1. Introduction
The infrastructure's design and development are currently the most critical needs. Due to a lack of space, infrastructural development frequently occurs on unsuitable soil. Civil engineers face a difficult challenge when building on poor-quality soil with significant loads. Construction of shallow foundations on weak soil results in excessive settlement and low bearing capacity, which may eventually cause structural damage. In such a case, either poor soil is replaced with strong soil, or its engineering features are improved using various ground improvement methods. Geogrid reinforcements are used effectively to strengthen the stability and service life of various Earthen structures such as embankments, foundations, retaining walls, etc. Compared to traditional approaches, reinforced embankments have decreased building costs and speed. Geogrids can greatly increase bearing capacity, minimize settlement and pore pressure, improve internal and external stability of the embankment, and control lateral translation. It can minimize shear stress, strain magnitudes, and plastic deformation in the foundation soil and improve embankment stiffness. When an embankment is reinforced with Geogrids, the reinforcement is arranged at the bottom and a specific distance from the bottom. Although limit equilibrium techniques are still frequently employed in practice, the finite element method has become very popular in recent years for rapid analyses of slope stability at the beginning stage. Although the generally established, routine application of elastoplastic analysis to slope stability problems is minimal. Finite element methods are significantly more advantageous than linear equilibrium approaches for some difficult geotechnical issues (Griffiths and Lane 1999, Kainthola et al 2011a, Kainthola et al 2011b, Kainthola et al 2012). Duncan 1996 presents a thorough overview of equilibrium slope stability analysis methods. The conventional method of slices, Bishop's modified approach, force equilibrium techniques, Janbu's generalized procedure of slices, Morgenstern and Price's method, and Spencer's method are a few of these methods. In the method of the slice, the total soil mass is divided into a small number of slices where the equilibrium of each slice will be examined. The internal equilibrium of the sliding mass is not considered by the circular and noncircular limit equilibrium methods, which only consider the equilibrium of the entire failing mass. There are numerous ways to calculate the FOS by utilizing the limit equilibrium method (LEM) and a circular pattern failure surface (Bishop 1955, Spencer 1967, McCombie and Wilkinson 2002). Simpler assumptions used in 2D slope stability analysis techniques have resulted in safety factors that are different from those used in 3D slope stability analysis techniques. Slope stability isn't treated to 3D analysis unless the geometry of the slope is long and complicated or the failure mechanism is complicated. Researchers compared alternative limit equilibrium solutions and a three-dimensional extension of the Bishop simplified technique (Hungr et al 1989). A three-dimensional slope stability analysis utilizing the column's approach has also been completed. The model expands the formulation for general limit equilibrium in two dimensions (Lam and Fredlund 1993). Researchers have calculated safety factors using the ubiquitous-joint model and looked at the stratified rock mass's anisotropic characteristics. The correlations between stratification dip angle, inclination, and slope stability were then examined using FLAC3D (Jiang et al 2009). Previous researchers have suggested a three-dimensional slope stability analysis that creates an appropriate velocity field and calculates the FOS using the equation of energy and work balance (Chen et al 2001). (Jeremić 2000) introduced the most recent method for simulating three-dimensional slope stability problems. Localized, continuous deformation, indicative of slope failure, is specified by a p-version of the finite element method. It is demonstrated how the novel method can be utilized to explain steep deformation gradients brought on by using a manageable number of finite elements to localize shear during the failure of slopes. (Griffiths and Marquez 2007) used a finite element (FE) program to study a Mohr-Coulomb failure criterion for the three-dimensional elastic-perfectly plastic soils while considering no dilatation effect. The authors reported the results from numerous 3D slope examples using an elastoplastic FE approach. They demonstrated that the three-dimensional safety factor and the two-dimensional result were increasingly convergent. (Li and Shao 2011) conducted the three-dimensional FE limit equilibrium approach (often referred to as 3DFLEM) that was created using the one-way sliding and the strength reduction principle. The Factor of safety equivalent to any shape of a sliding body is found using the mean value theorem of integrals. They contrasted the three-dimensional rigid limit equilibrium method to the three dimensional shear strength reduction (3DSSR) methodology. The authors discovered that there was good agreement between the two techniques for FOS and critical slide surfaces. (Kelesoglu 2016) carried out the strength reduction techniques and finite difference method for analyzing the effects of each component, such as the curvature of the slope, the contribution pile, and the external loading. To analyze the stability of massive landslides, (Tiwari et al 2015) used Specfem 3D Slope, an open-source spectral element method (SEM) tool. The spectral element method is significantly more favorable than FEM since it uses p-refinement methods instead of h-refinement methods to significantly reduce the massive computational burden. Due to its high accuracy and robustness, SEM has earned the right to have its computational method for simulating large-scale landslides. For soils that are uniformly cohesive, isotropic, or homogeneous, (Gens et al 1988) given a three-dimensional method. The slip plane is a cylindrical segment joined with flat or curved surfaces by splines, and analytical solutions were developed taking its shape into account. They created the DEEPCYL software program for the planar edges to compute the three dimension FOS and critical slip plane, using the numbers for the slope angle, length of the slice, and depth factor. A computer software called F3SLOP was also developed to compute three dimensional Factor of safety for any Slope (Stark and Eid 1998). The three-dimensional slope stability program CLARA 2.31 ignored the shear strength parameters on the sliding mass . As a result, the mobilized shear strength may be overestimated, while the three-dimensional FOS may be severely underestimated. (Arellano and Stark 2000) presented the most recent technique for including the shear resistance on both sides of the sliding mass in the 3D software that is already in use. The 3D/2D Factor of safety ratios increases when the width-to-height ratios decrease for a particular slope angle. When the inclination of the slope decreases for a particular width/height ratio, the ratio of the 3D/2D Factor of safety value increases. The difference in shear strength between the upper and lower layers has a greater impact on the 3D FOS value than it does on the comparable 2D value. (Chen and Karakus 2014) used FLAC3D software to carried out 3D stability analysis of a rock mass which compute nonlinear response based on Hoek-Brown yield principle.
The researchers invented that the Factor of safety is influenced by the convergence and boundary condition requirements. Comparatively to a slope with a steeper slope, it is noted that the boundary conditions have a more substantial influence on the Factor of safety value of a slope with a minor degree of inclination. (Reid et al 2015) invented a Scoops3D-i application which is helpful for search analysis. This application examines the stability of possible failure planes across a user-defined size range. It provides a coarse-to-fine search alternative while searching for the center of critical and most minor safety factors to reduce the overall run time. (Liu et al 2013) developed a multigrid method to determine the slope's safety based on factor finite element analysis. This technique effectively combines finite element and nonlinear limit equilibrium methodologies to assess the stability check for any surface of the sliding block. The nonlinear FE calculation applied the ideal elastic-plastic incremental analytical approach based on the Drucker-Prager yield criterion. Compared to those determined using the rigid-body LEM, the FOS values obtained by FEM were higher and extremely precise. Finding the location of the critical failure surface would be necessary for addition to determining the FOS using any usual method. The surface with the global minimum FOS is referred to as the CFS. Numerous potential failure planes are examined, and Factors of safety values are established for each to discover CFS in LEM. The lowest FOS value is found on the surface labeled as the CFS. The precise location of the CFS must be determined, which is a complex, time-consuming, and computationally demanding operation. The challenge of finding the CFS can be accomplished using a grid-based technique. This procedure involves creating a box-shaped grid with the positions of the centers of failure planes, creating failure planes with varied radiuses from these points, and then calculating FOS values. If not, the problem could be presented as a lesser problem, in which several optimization methods, including PSO and GWO, are used to identify the minimal Factor of safety value. These optimization algorithms are frequently used to find the coordinates of the centers of the slip circle and the corresponding radiuses. (Huang et al 2002) introduced a 3D version of methods that satisfies moment and force equilibrium along both directions for evaluating the slope stability status with any arrangement.
Additionally, they suggested a search method to locate the three-dimensional critical Factor of safety. To accomplish this, they took into account the use of effective optimization techniques, the deployment of suitable forms of failure plane consisting of quadrilateral, log spiral, or planar surfaces, and the availability of adequate geological and geometrical data. (Xie et al 2003) developed a novel column-based three-dimensional limit equilibrium method-based stability analysis model-based three-dimensional deterministic grid-based GIS model. Traditionally, homogeneous and heterogeneous slopes could be handled using a deterministic method. The critical safety factor of a three-dimensional slope was calculated using Monte Carlo Simulation (MCS). 3DSLOPEGIS, a computer application with a geographical information system component for carrying out spatial analysis, does all of the calculations.
The finite element method offers various advantages over the conventional LEM in analyzing the stability of the slope. First, a nonlinear relationship built between stress and strain of soil is taken in FEM analysis. Second, it is not necessary for the failure surface's shape and distribution and the interslice forces to be predetermined. Third, in natural conditions, failure of the slope occurs if the shear strength cannot support stress. The FOS in a FEM study can be determined using the strength reduction method. (Zienkiewicz et al 1975) Suggested using FEM's step-by-step SRM to calculate the FOS while preventing convergence of the equilibrium equation. The FOS is the reduction factor that occurs when the slope reaches the critical state. SRM is frequently employed in engineering projects to evaluate stability, including foundation stability for deep excavation, surface stability for tunneling, and slope stability. Numerous experiments have been carried out to determine slope stability. (Matsui and San 1992) looked into the cause of the failure and found that the rapture surface is where a failure shear strain zone develops. Stability, as well as deformation analysis of a high speed rail embankment constructed in soft clay, was carried out by (Likitlersuang et al 2018) with the help of SRM analysis. The findings showed a substantial displacement under a high-speed trainload. (Ho 2014) utilized the strength reduction method to examine the effects on boundary conditions of two-dimensional and three-dimensional models, demonstrating that the thickness direction boundary conditions are essential to three dimensional FEM analysis. In contrast, influence of length along the z-direction may be disregarded when the roller-roller conditions are used. (Griffiths and Marquez 2007) used the Strength reduction method to analyze the implications of boundary conditions in 3D models, including the canyon site's topography and the dam's geometrical features.
Geogrids have several application in the field of geotechnical engineering, transportation engineering and structural engineering. An important application of geogrid in the case of pavement is to reduce rut deformation by 90% as compared to unreinforced pavement. Rut deformation in pavements generally occurs due to repetitive wheel loading (Baadiga et al 2021). Geogrid used as a facing material for stabilization of nailed slope, where deformation is reduced by PET geogrid facing slope as compared to slope without facing (Nar et al 2020). Geogrid also used in reinforced backfill with gabion faced retaining wall for stabilization of slope (Wang et al 2021). Another important application of geogrid to stabilize the slope on a river levee in northen Croatia (Rossi et al 2021). To increase the stability of land fill slope, geogrid plays crucial role (Cortellazzo et al 2022). In most of the geogrid application, PET geogrids are used. Very limited research were found regarding application of other four type of geogrids also in the application of Hill slope.
2. Materials and methodology
2.1. 3D model development
Finite element analysis (FEM) is the numerical approach that has been considered in the present study, which is carried out with the help of commercially available software, MIDAS GTS NX 2021 v1.1 computer program was used to develop a three-dimensional geometric model of the slope. Under the criteria of plane strain, slope stability analyses were carried out. Triangular elements with 15 nodes were selected for the modeling to get more precise and sensitive results. The slope is located in the state of Meghalaya, India, which is home to some of the wettest places on Earth (Mawsynram and Sohra), and incessant rain is one of the main factors causing various landslides in various parts of the states (Shillong times 2020, Sarkar et al 2016, Umarao et al 2017). Some portions of the slope are considered in this study. Slope geometry is given in figure 1 with a soil slope height of 15 m and slope angle of 27°. The soil samples were collected and tested in the lab to find the properties used in FEM analysis for the 3D slope Model, shown in table 1. Five Geogrids of various polymers (Al-Barqawi et al 2021) are considered during the modeling of the slope. The properties of different Geogrid materials are shown in table 2. The Geogrids are placed at a vertical spacing of 3 m each along the slope. The detailed geometry of the Geogrid reinforced slope is shown in figure 2.
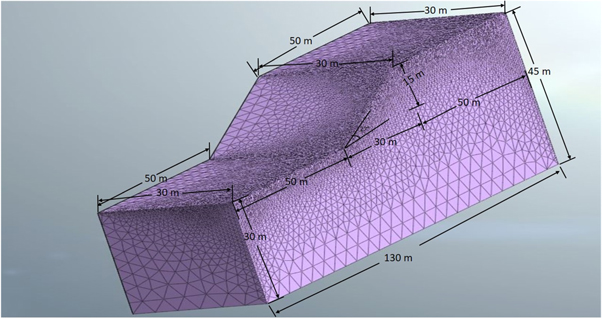
Figure 1. 3D unreinforced slope model along with its geometry.
Download figure:
Standard image High-resolution imageTable 1. Soil properties used in three-dimensional slope model.
| Parameters | Value |
|---|---|
| Effective friction angle (ϕ') | 19.31° |
| Effective cohesion (c') | 45 kN m−2 |
| Young's modulus of the soil (E') | 12717 kN m−2 |
| Unit weight (γ) | 16.775 kN m−3 |
| Poisson's ratio (ν) | 0.3 |
| Slope angle (β) | 27° |
| Material model | Mohr-Coulomb |
Table 2. Properties of various Geogrid materials (Al-Barqawi et al 2021).
| Polymer | Glass transition temperature, (°C) | Density (g cm−3) | Modulus of elasticity (GPa) | Tensile strength ultimate (MPa) |
|---|---|---|---|---|
| Polyethylene Terephthalate (PET) | 70–80 | 1.38 | 2.76—4.14 | 85 |
| High-Density Polyethylene (HDPE) | −125 | 0.93–0.97 | 0.65—1.5 | 26 |
| Low-Density Polyethylene (LDPE) | −125 | 0.91–0.94 | 0.19—0.52 | 10 |
| Polypropylene (PP) | −20 to −5 | 0.92–0.985 | 1.14—1.55 | 9—80 |
| Polyvinyl Chloride (PVC) | 87 | 1.40 | 0.003—4.14 | 0.00123—60.8 |
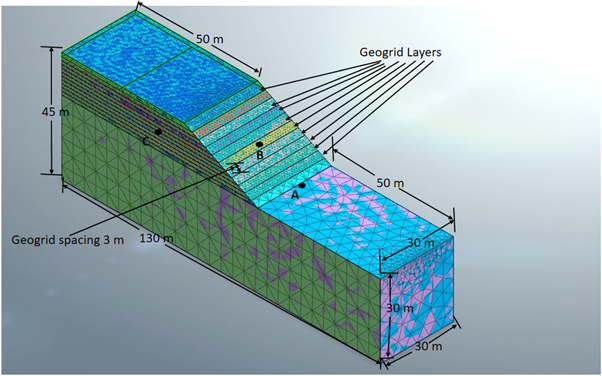
Figure 2. 3D Geogrid reinforced slope model.
Download figure:
Standard image High-resolution image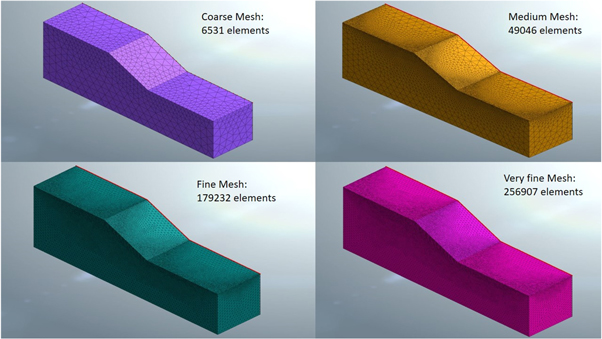
Figure 3. 3D Model with various coarseness.
Download figure:
Standard image High-resolution image2.2. Mesh convergence study
The Mesh convergence study is a technique, where the accuracy of work by a Finite Element software is ensured that means the result of an analysis are not affected by changing the size of mesh. Hence to get accurate result in this current study, unreinforced slope is taken into account as per figure 4. The FOS reduced by increase in number of elements because of convergency criterion which means the nodal unbalanced force becomes zero. The nodal unbalanced force is the sum of forces acting on a node from its neighboring elements (Dawson et al 2000).
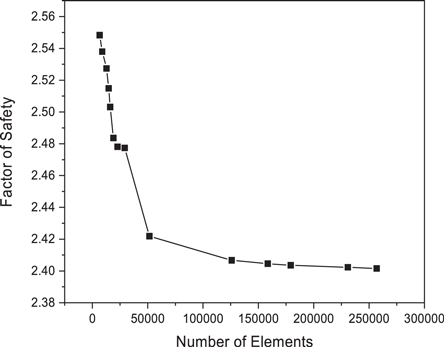
Figure 4. Variation of the Factor of safety with different numbers of elements.
Download figure:
Standard image High-resolution image3D mesh convergence analysis was carried out by taking the 3D FEM slope model and found that 6531 elements belong to coarse mesh, 49046 elements belong to medium mesh, 179232 elements belong to fine mesh, and 256907 elements belong to very fine mesh as shown in figure 3. When further increasing the number of elements beyond that in the fine mesh, the results did not change (i.e., the model converged). The outcomes from each model's fine mesh were used as the benchmark to assess the outcomes from the other meshes.
2.3. SRM and failure mechanism
Zienkiewicz et al 1975 first utilized SRM for slope stability analysis 1975. Later, it was known as the 'shear strength reduction technique' (Matsui and San 1992) and applied to the terms c' and tan ϕ' to apply various FoS. Using the strength reduction factor (SRF), the angle of internal friction and the cohesion values steadily decrease under the SRM method until the limit damage condition is reached. When numerical non-convergence occurs or the nodal displacement dramatically increases, the limit state is reached. In the failure state, soil stress fails to satisfy the equilibrium and the strength criterion (assumed to be a Mohr-Coulomb failure criterion). The SRF generally refers to the Factor of safety of a slope. This study uses SRM analysis to find the Factor of safety for unreinforced slopes and various geogrid reinforced slopes.
3. Results and discussion
3.1. Effects of different geogrid reinforced slopes on factor of safety
The Factor of safety for different slopes such as Unreinforced Slope (UR), slope reinforced with PVC Geogrid (PVCG), slope reinforced with PET Geogrid (PETG), slope reinforced with LDPE Geogrid (LDPEG), slope reinforced with HDPE Geogrid (HDPEG) and slope reinforced with PP Geogrid (PPG) are shown in figure 5. The safety factor for reinforced slopes is higher than that for unreinforced slopes. The safety factor for PET geogrid-reinforced slopes is higher among other geogrid-reinforced slopes. Hence PET Geogrid is more effective in stabilizing slopes among different geogrid types. The Factor of safety of PET geogrid reinforced slope is increased by 18% compared to the unreinforced slope. The Factor of safety of PVC geogrid reinforced slope is increased by 15.6% compared to the unreinforced slope. The Factor of safety of LDPE geogrid reinforced slope is increased by 16.7% compared to the unreinforced slope. The Factor of safety of HDPE geogrid reinforced slope is increased by 17.1% compared to the unreinforced slope. The Factor of safety of PP geogrid reinforced slope is increased by 16.3% compared to the unreinforced slope. Comparasion of Factor of Safety for different Reinforced slope with respect to Unreinforced slope is mentioned in table 3.
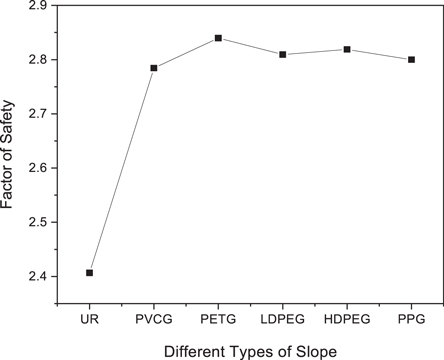
Figure 5. Variation of the Factor of safety for unreinforced slope and various types of reinforced slopes using different geogrids.
Download figure:
Standard image High-resolution imageTable 3. Comparasion of factor of safety for different reinforced slope with respect to unreinforced slope.
| Types of slope | Factor of safety | Percentage increase in factor of safety with respect to unreinforced slope |
|---|---|---|
| Unreinforced slope | 2.40664 | |
| Slope Reinforced with PVC Geogrid | 2.7844 | 15.6 |
| Slope Reinforced with PET Geogrid | 2.8398 | 18 |
| Slope Reinforced with LDPE Geogrid | 2.8094 | 16.7 |
| Slope Reinforced with HDPE Geogrid | 2.8188 | 17.1 |
| Slope Reinforced with PP Geogrid | 2.8 | 16.3 |
3.2. Effects of maximum deformation for different geogrid reinforced slope
The Failure surface showing maximum deformation for various slopes is shown in figure 6. For all the cases, the ultimate failure surface occurs near the toe of the slope except in PET geogrid reinforced slope, where the maximum failure surface appears at the top of the slope.
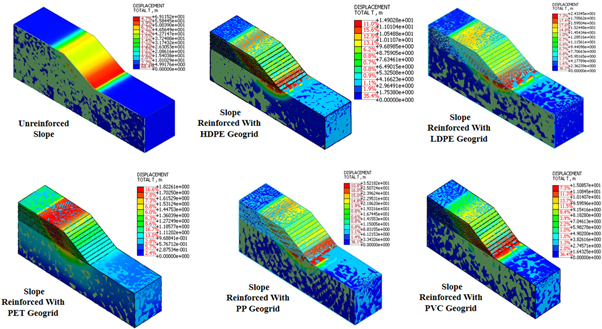
Figure 6. Maximum total displacement.
Download figure:
Standard image High-resolution imageThe failure surface showing maximum deformation along X-axis is shown in figure 7. In all cases, the maximum failure surface is observed at the slope's toe.
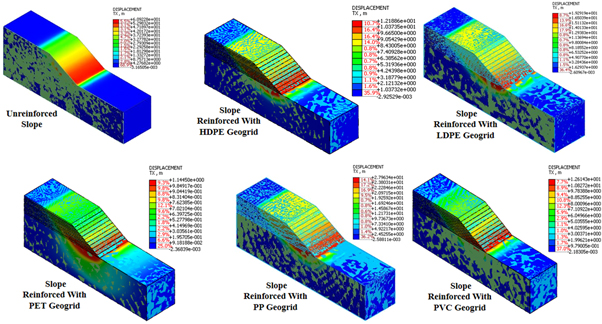
Figure 7. Maximum displacement along X-axis.
Download figure:
Standard image High-resolution imageThe failure surface showing maximum deformation along Y-axis is shown in figure 8. In all the cases, the failure surface has a significantly less significant effect.

Figure 8. Maximum displacement along Y-axis.
Download figure:
Standard image High-resolution imageThe failure surface showing maximum deformation along Z-axis is shown in figure 9. Here also maximum failure surface was observed at the toe of the slope.
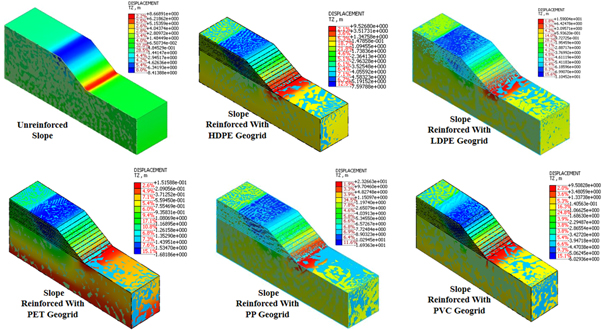
Figure 9. Maximum displacement along Z-axis.
Download figure:
Standard image High-resolution imageThe comparison between Maximum total deformation and maximum deformation along various directions for different type of slopes are shown in figure 10. The maximum deformation occurs in unreinforced slopes among all kinds of slopes. After being stabilized using geogrid, the deformation gets reduced. More deformations are shown in the case of slope reinforced with PP geogrid, whereas, Very less deformation is shown in the case of slope reinforced with PET geogrid among other geogrid-reinforced slopes. Hence PET geogrid is more effective for reducing deformation than different types of geogrid. The percentage of maximum displacement is reduced by 97% in the case of PET geogrid reinforced slope as compared to the unreinforced slope. The rate of maximum displacement is reduced by 78.17% in the case of PVC geogrid reinforced slope compared to the unreinforced slope. The percentage of maximum displacement is reduced by 64.79% in the case of LDPE geogrid reinforced slope as compared to the unreinforced slope. The rate of maximum displacement is reduced by 78.4% in the case of HDPE geogrid reinforced slope as compared to the unreinforced slope. The percentage of maximum displacement is reduced by 49% in the case of the PP geogrid reinforced slope compared to the unreinforced slope.

Figure 10. Variation of Deformation for different types of slopes.
Download figure:
Standard image High-resolution imageThree nodes, A, B, and C, are selected at the toe portion, the face of the slope, and below the crest, as per figure 2. Variation of total displacement at various nodes is shown in figure 11. Similarly, the interpretation of displacement in the X-direction at different nodes is shown in figure 12. Total displacements are lower in PET geogrid reinforced slope compared to other slopes. Similarly, displacement along the X-direction is lower in the case of PET geogrid reinforced slope.
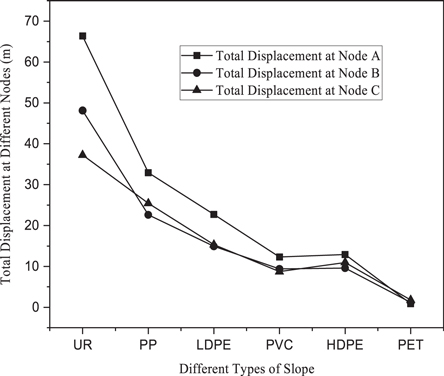
Figure 11. Variation of total displacement at different nodes.
Download figure:
Standard image High-resolution image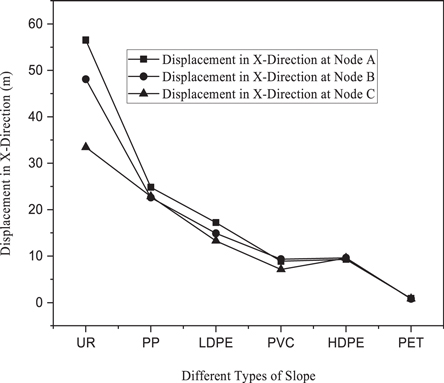
Figure 12. Variation of displacement in X-direction at different nodes.
Download figure:
Standard image High-resolution image3.3. Effects of total stress for different geogrid reinforced slope
Maximum stresses in a different direction, significant principal stress, minor principal stress, and maximum shear stress are shown in figure 13. The unreinforced slope shows maximum stresses as compared to other slopes. The slope reinforced with LDPE geogrid shows less stress than different geogrid-reinforced slopes. The maximum shear stress is high in the case of an unreinforced slope, whereas the maximum shear stress is low in the case of a slope reinforced with LDPE geogrid.
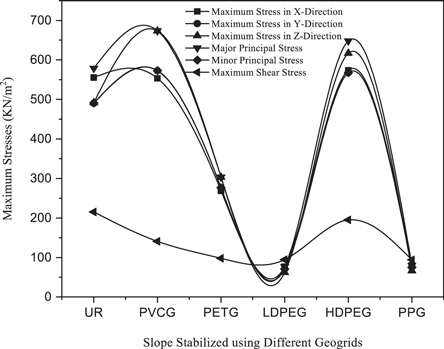
Figure 13. Variation of maximum stresses for different slopes.
Download figure:
Standard image High-resolution image3.4. Effects of total strain for different geogrid reinforced slope
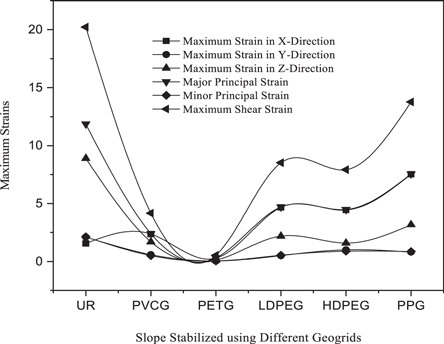
Variations of maximum strain for different types of slopes are shown in figure 14. The unreinforced slope shows maximum strain among other slopes. PP geogrid reinforced slope shows maximum strains among other geogrid reinforced slopes. Maximum shear strain is also high in the case of the unreinforced slope but low in the case of the PET geogrid reinforced slope.
Figure 14. Variation of maximum strain for different slopes.
Download figure:
Standard image High-resolution image
3.5. Validation
Vashi et al 2013 used two types of Geotextile, PET and PP, to investigate the reinforcement behavior on fly ash with clay embankment. The researchers found that reinforced embankment with PET geotextile provides a safer design than PP geotextile. In this research, the geogrid made up of PET also shows a maximum Factor of safety and minimum deformation compared to other types of the geogrid reinforced slope, which is in good agreement with Vashi et al 2013. Pant et al 2019 carried out pull out a test for transverse and longitudinal members of PET geogrid and found that transverse members of PET geogrid contribute (30–60)% pull-out resistance and exhibit higher contribution at more significant confinement stress, which is also a key parameter of increase in Factor of safety of PET geogrid reinforced Slope. Another critical parameter is the stiffness of the geogrid. As per the comparison between HDPE and PET geogrid, Pant et al 2019 found that the contribution of PET geogrid is more significant due to lower stiffness. PET geogrid provides an advantage over other geogrids in terms of resistance to creep elongation (Al-Barqawi et al 2021).
4. Conclusions
The behavior of a geogrid reinforced slope was investigated in the current work utilizing 3D numerical analyses using the finite element program MIDAS GTS NX 2021 v1.1. Five types of geogrid are made up of different materials such as Polyethylene Terephthalate (PET), High-Density Polyethylene (HDPE), Low-Density Polyethylene (LDPE), Polypropylene (PP), and Polyvinyl Chloride (PVC) were considered to stabilize the slope. Mesh convergence analysis was carried out to find the optimum mesh size. The stability analysis was carried out in terms of the Factor of safety and deformation of different types of slopes. Following conclusions were made from the above analysis.
- 1.The Factor of safety for the Geogrid reinforced slope is higher than the unreinforced slope as geogrid provides higher tensile strength to stabilize soil because the soil is strong in compression and weak in tension.
- 2.The PET geogrid reinforced slope provides a higher Factor of safety and lower deformation among other geogrid reinforced Slopes because PET geogrid provides maximum pull-out resistance among different types of geogrid.
- 3.The strain induced in PET geogrid reinforced slope is minimum among other geogrid reinforced slopes due to the lower stiffness of PET geogrid.
- 4.The percentage increase in the Factor of safety for PET geogrid reinforced slope is 18% compared to the unreinforced slope, which is higher than other geogrid reinforced slopes.
- 5.The percentage decrease in displacement for PET geogrid reinforced slope is 97% compared to unreinforced slope, which is higher among other geogrid reinforced slopes.
Data availability statement
All data that support the findings of this study are included within the article (and any supplementary files).
Author contributions
The manuscript was written through the contributions of all authors. All authors have given approval to the final version of the manuscript.
Conflict of interest
There is no competing interest from other parties and the authors did not receive any external funds to support the work.
Funding
The authors have no relevant financial or non-financial interests to disclose.
Ethical approval
Not applicable.
Consent to participate
Not applicable.
Consent for publication
Not applicable.