
Abstract
Laser cladding is a new surface treatment technology that is widely used for surface modification of metal parts, and the high quality of the surface geometry of the cladding layer can save a lot of resources for the company. To obtain high quality of the clad layer, the L25 Taguchi experiment of laser cladding process parameters was designed to laser-clad a single 15-5PH layer on the surface of 45# steel; the effect of process parameters on the surface morphology and dilution rate of the coating was determined by ANOVA; the optimal combination of process parameters was obtained by combining gray correlation and fuzzy inference system method. The ANOVA results show that the scanning speed among the laser cladding process parameters plays a key role in obtaining the best superposition of the four geometrical features of the cladding layer simultaneously; With the optimization objectives of larger clad width and height, smaller clad depth, and 30% dilution rate, the optimal combination of process parameters, (P: 600W, V: 500 mm min−1, F−1: 1.3 r min−1), obtained based on the Gray-fuzzy Taguchi Approach, was compared and analyzed to find a significant improvement in the geometric quality characteristics of the optimized clad layer. The analysis of microstructure, physical phase, hardness, wear resistance and corrosion resistance showed that the 15-5PH clad layer was able to effectively enhance the surface properties of the 12Cr13 substrate. The optimization method proposed in this study can solve the problem of parameter optimization in the industrial multi-parameter and multi-response processes.
Export citation and abstract BibTeX RIS
1. Introduction
15-5PH precipitation hardening martensitic stainless steel has excellent mechanical properties, exhibits high strength and hardness, good corrosion resistance and low deformation [1]. 15-5PH can meet the strict mechanical properties required by the aerospace and nuclear industries. It is also widely used in the petroleum industry, power generation and general metal-processing industries. At the same time, since 15-5PH has good weldability [2, 3], a group of scholars have done a lot of work on the welding repair of damaged parts of 15-5PH. Weinberger et al [4] investigated the effect of stir friction welding and its process on the post-weld quality to solve the welding problem of 15-5 PH. Zhang et al [5] prepared Mo coatings using a three-cathode high-energy plasma spraying system on a 15-5PH steel surface again and analyzed an in-depth study of the effect of process parameters on the coatings and the wear compliance properties. However, due to the huge heat input and the requirement to preheat the parts to a very high temperature, conventional repair methods such as arc surfacing welding, argon arc surfacing welding and plasma arc surfacing welding, etc, will inevitably lead to greater deformation of the parts and even internal structure changes [6]. Unlike the traditional welding technology which requires preheating and a large amount of heat input, laser cladding has the characteristics of rapid heating and cooling process, and can easily obtain fine crystal organization and produce new phases that cannot be obtained in equilibrium state to enhance the cladding layer. Moreover, due to the low dilution rate of the cladding layer, it can form a solid metallurgical bond or an interfacial diffusion with the substrate, the composition and dilution rate of the cladding layer can be controlled by the adjustment of process parameters to obtain a good cladding layer.
As an advanced technology for surface modification and repair [7], laser cladding can not only clad a high-performance coating on the low-performance and inexpensive substrates, but also make a strong metallurgical bond between the two materials, generate a large amount of hard phase and cementite [8, 9], and then obtain a coating that can meet the requirements of the working conditions [10]. It can reduce the demand for precious metals and rare metal materials, thereby saving material costs. However, the laser cladding technology still faces the problem of cracks and pores in the cladding layer, mainly due to the mismatch of process parameters [11]. As the requirements for laser cladding coatings increase, laser cladding coatings need to be studied in depth to improve the quality of the coatings. One of the effective means to improve the coating quality is to optimize the laser cladding parameters. During the laser cladding process, the laser, powder, protective gas and substrate work together and interact with each other, which results in a complex mapping relationship between laser cladding coating quality and process parameters. If the relationship between the established laser cladding process parameters and the coating quality is not accurate, it is not easy to get the parameters with the best coating quality. Therefore, many methods for optimization of laser cladding process parameters have been proposed by many scholars, such as response surface method, machine learning, Taguchi method, mathematical modeling method, etc, all of which can better solve the complex mapping relationship between process parameters and coating quality [12].
The optimization of laser cladding process parameters has been studied by many scholars. Luo et al [13] introduced the line energy density parameter that can synthetically reflect the influence of laser power and scanning speed on coating quality, revealing the effect law of line energy density on coating properties. To obtain a laser cladding layer with high hardness and toughness, Qi et al [14] proposed laser cladding in a magnetic field environment. The results showed that the content of Cr element can affect the magnetostriction and cause the change of the elastic modulus, and the magnetostriction effect produced by the magnetic field will reduce the elastic modulus and increase the wear resistance and crack resistance of the laser cladding. From an empirical statistical point of view, Erfanmanesh et al [15] managed to use the regression method to predict and analyze the correlation between the key process parameters and the geometrical features of the individual cladding layer, therefore determining the optimal process parameters where single-track laser cladding WC-12Co powder on AISI 321 steel substrate. However, the drawbacks of this regression analysis method are that it is difficult to model polynomial regression for nonlinear data or data features with the correlation between them, and it is difficult to represent highly complex data well.
Some scholars have combined multiple parameter optimization methods to achieve complex response optimization in the case of laser cladding multi-parameter coupling. Ren et al [16] proposed a new process combining laser cladding and laser shocking, and they verified that this new process can improve the problems that occurrences of excessive tensile stress, low basket organization refinement of Ti-6Al-4V layer during laser by analyzing the structure and performance of the laser cladding. Prajapati et al [17] adopted the L9 Orthogonal array for the design of experiments. A method combining grey with a fuzzy Taguchi approach was employed to evaluate favorable parameter settings for optimizing the performance characteristics of regulated metal deposition (RMD) welding. Voltage is the most influential parameter in the RMD process, which was indicated by the analysis result. Anitesh [18] et al comprehensively compared the multi-objective optimization effects of three multi-objective optimization algorithms, MOBO, MOPSO, and MOGWO, on laser cladding process parameters with laser energy efficiency, powder deposition rate, and dilution rate as the target optimization objectives, the results showed that the MOBO multi-objective optimization algorithm could provide the best Pareto solution set for the laser cladding process parameters. For preparing a high-quality and high-entropy alloy coating, Ma et al [19] combined RSM with PSO optimization algorithm at minimum dilution rate and residual stress to solve the acquisition of optimal process parameters.
The simple polynomial regression method is able to respond to a certain mapping relationship easily and quickly, but the mapping model between laser cladding process parameters and cladding quality characteristics is a complex and variable non-linear relationship. The simple polynomial regression method is difficult to accurately represent the relationship between the two one. Optimization of laser cladding process parameters using machine learning can establish complex mapping relationships between coating quality and process parameters. However, machine learning can suffer from overfitting and low fitting accuracy when the amount of experimental data is not large. Machine learning also does not facilitate the acquisition of the influence law between coating quality and process parameters, making it difficult to be used in industry.
Laser cladding technology was used to prepare 15-5PH coating on 45 steel substrate to improve the surface properties of 45# steel material. To obtain high-quality 15-5PH coatings, Taguchi's method combined with ANOVA was used to obtain the degree of influence of each input parameter on the output target. At the meantime, the optimization model about laser cladding process parameters is established, with laser cladding process parameters as input factors and the cladding layer width (W), coating height (H), coating depth (dm) and dilution rate of coating (η) as the objective functions of output characteristics; the process parameters are optimized by the comprehensive use of gray relational analysis and fuzzy reasoning, and the larger the cladding width and height, the smaller the cladding depth and the suitable dilution rate of the cladding layer are obtained. Finally, the optimization results are analyzed by verification experiments and performance tests.
2. A multi-parameter optimization based on Grey-fuzzy taguchi approach
Optimization process parameters is an essential tool to improve the quality of laser cladding products, while the traditional trial-and-error method of optimizing process parameters is very inefficient. A multi-parameter optimization method based on the Grey-fuzzy Taguchi approach is presented to determine the optimal portfolio of laser cladding process parameters to improve the surface topography and dilution rate of the cladding layer, as shown in figure 1. The method is based on Taguchi's scientific experimental design and uses grey correlation analysis to establish grey correlation coefficients between laser cladding process parameters and geometric quality characteristics of the cladding layer; then a fuzzy inference system is established and the grey correlation coefficients are input into the fuzzy inference system; finally, the grey fuzzy correlation degrees are obtained and ranked to obtain the best portfolio of laser cladding process parameters. The method combines the advantages of qualitative analysis without excessive sample size and the robustness of fuzzy inference system, avoids the defect that grey correlation is very sensitive to noise, uses fuzzy inference to suppress the error caused by noise, and finally realizes multi-parameter and multi-response laser cladding optimization.

Figure 1. Grey-fuzzy Taguchi approach for optimization of laser cladding parameter.
Download figure:
Standard image High-resolution imageThe flow of the optimization method is as follows:
Step 1: Construction of a decision matrix according to Taguchi approach
A decision matrix with n number of experimental samples and m number of responses is first developed.

where xij denotes the jth response of the ith experimental sample.
Step 2: Construction of the signal to noise ratio (S/N) matrix
Depending on the quality characteristics of the product, S/N can be divided into three types: larger-the-better characteristic (LBC), smaller-the-better characteristic (SBC) and nominal-the-type characteristic (NTC). Equation (2) shows the calculation of the three types of S/N.

Step 3: Calculation of the normalized S/N matrix
The scale between the geometric quality characteristics of the coating is different and needs to be quantified to make the data comparable with each other [20]. The S/N matrix is normalized.

where aj is the target value of yij .
Step 4: Calculation of the deviation sequence

where the geometric quality characteristics of the cladding layer are used as the reference sequence xi0, the portfolio of laser cladding process parameters as the comparison sequence xij .
Step 5: Calculation of the grey relational coefficient (GRC)
To compare the correlation between the process parameters and geometric quality characteristics, it is necessary to perform the calculation of sequence correlation for each sequence factor in all its dimensions [21, 22], and the calculation result is grey relational coefficient (GRC).

where ρ is the distinguishing coefficient which is defined in the range 0 ≤ ρ ≤ 1, and ρ was taken as 0.5 in this equation.
Step 6: Calculation of the grey relational grade (GRG)
The mean value of gray correlation coefficient (GRC) of different dimensions of each factor is taken as the result of quantitative expression of the correlation degree between the reference series and the comparison series, and the result of ranking them is used as the gray relationship grade (GRG) [23–27].

Step 7: Calculation of the grey-fuzzy relational grade (GFRG)
The trigonometric function is selected as a fuzzy system of the degree of dependence function. As shown in figure 2, the inputs of the fuzzy inference system are classified into three types: small (S), medium (M), large (L); the outputs of the fuzzy inference system are classified into five types: very small (VS), small (S), middle(M), large (L), very large (VL).

Figure 2. Fuzzy inference machine model.
Download figure:
Standard image High-resolution imageThe Mamdani fuzzy rules are used to define the fuzzy rule library according to the multi-parameter and multi-response characteristics of the optimization experiment, as shown in table 1. The center of gravity method has the advantage of smooth output inference control, even if the corresponding input signal changes slightly, the output will also change [28]. Therefore, the gravity center method is used for de-fuzzification to obtain the accurate value of the final grey-fuzzy relational grade (GFRG). The fuzzy toolbox of MATLAB (R2017) is used for the development of this paper.
Table 1. Mamdani fuzzy rules.
| NO. | Rules |
|---|---|
| 1 | If x1 is S and x2 is S and x3 is S then y is VS |
| 2 | If x1 is S and x2 is S and x3 is M then y is VS |
| ... | ... |
| 27 | If x1 is L and x2 is L and x3 is L then y is VL |
3. Experiment design
3.1. Experiment equipment
As shown in figure 3, three-axis servo system, water cooler, multifunctional powder feeder, laser generator, control system, and laser cladding head make up the laser cladding system. The schematic diagram of laser cladding single-track is shown in figure 4.

Figure 3. Laser cladding system.
Download figure:
Standard image High-resolution image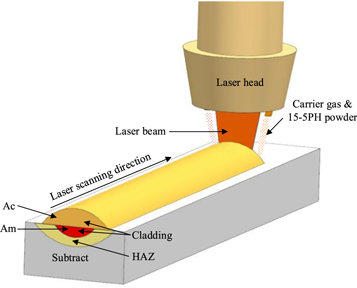
Figure 4. Single-track laser cladding.
Download figure:
Standard image High-resolution image3.2. Material and procedure
The experimental substrate material was selected from 45 steel with the dimensions of 75 × 15 × 5 mm3 and the elemental composition as shown in table 2, and the surface oxide layer was removed by sandpaper and wiped clean with anhydrous ethanol before the experiment. The powder was selected from iron-based 15-5PH powder with particle size of 53–150μm, and the elemental composition was shown in table 2. The powder was dried in a vacuum incubator at 150°C for 5h before the experiment to ensure fluidity of the powder.
Table 2. Elemental composition of the substrate material and cladding powder.
| Elements wt (%) | ||||||||
|---|---|---|---|---|---|---|---|---|
| Material | C | Mn | Si | Cr | Ni | Cu | Nb | Fe |
| 45 steel | 0.46 | 0.65 | 0.27 | 0.17 | — | — | — | Bal. |
| 15-5PH | 0.026 | 0.84 | 0.38 | 15.41 | 4.66 | 3.71 | 0.3 | Bal. |
A single-track cladding with a length of 65 mm was completed by a CNC program-controlled laser cladding system. After completion, the central part of the specimen 15 × 15 × 5 mm3 was cut using wire cutting as the analysis section, sandpaper was used for grinding after inlaying, and after etching using 4% ethanol nitrate solution, the surface topography and dilution rate of the single-track coatings were observed and measured using a Leica DVM6S digital microscope.
The laser power (P), scanning speed (V), powder feeding speed (F), which have the greatest influence on the coating quality, were selected as the studied process parameters. A suitable dilution rate can achieve good bonding strength between the coating and the substrate, a dilution rate of 30% [21, 22] is chosen as the target value here. Combined with engineering experience the range of three process parameters for laser cladding was selected and divided into five classes. The L25(53) orthogonal experiment was designed using Minitab18 software, the process parameter hierarchy is shown in table 3.
Table 3. Factors and levels.
| Level | |||||||
|---|---|---|---|---|---|---|---|
| Factors | Unit | Notations | 1 | 2 | 3 | 4 | 5 |
| Laser power | P | W | 450 | 500 | 550 | 600 | 650 |
| Scanning speed | V | mm/min | 500 | 550 | 600 | 650 | 700 |
| Powder feeding rate | F | r/min | 1 | 1.1 | 1.2 | 1.3 | 1.4 |
3.3. Microstructure and mechanical property analysis
3.3.1. Phase and microstructure characteristics
The Leica DMILM metallurgical microscope and FEI Inspect F50 (FSEM) field emission scanning electron microscope was used for the analysis of microstructure; the DX-2700B x-ray diffractometer was used for the analysis of material phase, the target material was Cu target, the maximum output voltage was 40 kV, the maximum output current was 40 mA, the step scan speed was 0.01° s−1, and the test The range (2θ) is 30° ∼ 120°.
3.3.2. Microhardness, friction and wear properties
The microhardness in the vertical direction from the laser-clad coating to the substrate was determined using an iVision-HV hardness tester, and three sets of data in the horizontal plane were obtained at each distance, and the parameters were set to 500g and 10s.
To verify that the 15-5PH cladding layer has better wear resistance than the 45# substrate, the wear resistance test was carried out by using the MMW-2 friction and wear tester. The grinding head material is a Cr60 ball head pin, the loading load is 100N, the speed is 100 r min−1,
3.3.3. Corrosion properties of laser-clad coatings
The LK98BII electrochemical workstation was used to measure the corrosion resistance of the 15-5PH cladding layer and the base material 45# steel. The electrochemical corrosion test method uses the Tafel curve method, the electrolytic cell uses a three-electrode electrochemical electrolytic cell, the counter electrode is a platinum electrode, the reference electrode is a saturated glycerol electrode, the electrolyte is a 3.5% NaCl solution, the test potential is −2 ∼ 2V, and the scan rate is 0.05 V s−1.
4. Results and discussion
4.1. Experiment results
The geometric features of single-track laser cladding can be studied experimentally. Geometry based on single-track laser cladding of cross sections, the outline of the cross-section is shown in figure 5 and six main geometric parameters are defined. The formula for η is shown in equation (7). The results of L25 are shown in figure 6. The results of the measured and calculated geometric parameters of the single-track laser cladding cross-section measured with the Leica DVM6S digital microscope are shown in table 4 [29].

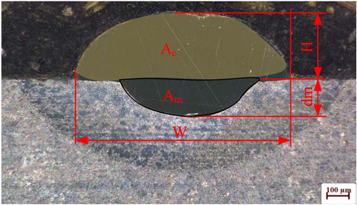
Figure 5. The cross-section of single-track cladding.
Download figure:
Standard image High-resolution image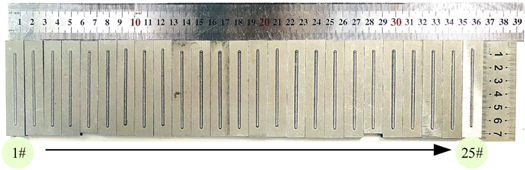
Figure 6. Macro-morphology results of the experiment.
Download figure:
Standard image High-resolution imageTable 4. Raw data of the coating cross-section.
| NO. | W/(μm) | H/(μm) | dm/(μm) | Ac/(μm2) | Am/(μm2) | η |
|---|---|---|---|---|---|---|
| 1 | 1080.503 | 225.017 | 44.720 | 169153.063 | 32449.720 | 16.096% |
| 2 | 1020.780 | 222.304 | 34.951 | 145218.557 | 25420.334 | 14.897% |
| 3 | 979.151 | 273.726 | 19.551 | 190024.924 | 12962.606 | 6.386% |
| 4 | 1063.280 | 230.109 | 45.752 | 162483.109 | 26597.398 | 14.067% |
| 5 | 952.961 | 238.194 | 29.604 | 167966.315 | 17670.322 | 9.519% |
| 6 | 1082.545 | 285.311 | 203.607 | 212170.521 | 88115.901 | 29.344% |
| 7 | 1095.563 | 288.437 | 162.646 | 220651.745 | 86883.875 | 28.252% |
| 8 | 1056.248 | 238.893 | 138.505 | 186911.030 | 69178.639 | 27.013% |
| 9 | 1042.166 | 236.342 | 153.747 | 169467.400 | 67921.477 | 28.612% |
| 10 | 1011.702 | 143.582 | 174.082 | 100213.670 | 91822.900 | 47.815% |
| 11 | 1079.013 | 346.884 | 198.223 | 285257.124 | 107870.490 | 27.439% |
| 12 | 1122.206 | 312.579 | 194.407 | 261790.904 | 105713.856 | 28.765% |
| 13 | 1141.269 | 318.930 | 196.949 | 265590.651 | 87349.760 | 24.749% |
| 14 | 1123.477 | 175.352 | 217.279 | 135217.199 | 119586.241 | 46.933% |
| 15 | 1091.707 | 158.835 | 222.365 | 123180.901 | 108402.584 | 46.809% |
| 16 | 1159.079 | 341.810 | 229.989 | 300699.953 | 123767.900 | 29.158% |
| 17 | 1184.564 | 330.367 | 284.633 | 272036.331 | 157968.040 | 36.736% |
| 18 | 1185.758 | 241.424 | 280.856 | 199195.208 | 155727.433 | 43.876% |
| 19 | 1167.960 | 217.282 | 259.209 | 164962.771 | 143775.914 | 46.569% |
| 20 | 1133.833 | 195.845 | 297.019 | 151810.693 | 150040.723 | 49.707% |
| 21 | 1236.601 | 339.261 | 321.493 | 335182.692 | 190324.019 | 36.217% |
| 22 | 1256.952 | 263.025 | 339.319 | 221703.821 | 205662.690 | 48.123% |
| 23 | 1207.356 | 287.175 | 297.332 | 248939.913 | 164577.629 | 39.799% |
| 24 | 1180.710 | 288.535 | 298.643 | 239851.527 | 165232.451 | 40.790% |
| 25 | 1098.065 | 216.008 | 296.061 | 183756.417 | 164882.836 | 47.293% |
4.2. ANOVA for S/N based on taguchi approach
The cladding layer width (W), cladding layer height (H), cladding laser depth (dm) and dilution rate (η) are selected as the response targets. The larger cladding layer width and cladding layer height enable a larger area of laser cladding to be obtained; Smaller cladding layer depths ensure that the laser energy is appropriate and that the effects of excessive energy on the substrate are avoided; Too large a dilution rate will lead to a waste of powder material, too small a dilution rate will lead to insufficient metallurgical bond strength between the powder and the substrate, and to ensure that the multi-track lap when the cladding surface is flat, we choose 30% [30, 31] as the target value of the dilution rate. Therefore, the cladding layer width and cladding layer height use the larger-the-better characteristic (LBC), the cladding layer depth uses the smaller-the-better characteristic (SBC), and the dilution rate selects the nominal-the-type characteristic (NTC). MINITAB 18 is used to calculate and analyze the S/N for W, H, dm and η. The results are shown in table 5.
Table 5. S/N of the output response.
| NO. | S/NW | S/NH | S/Ndm | S/Nη | NO. | S/NW | S/NH | S/Ndm | S/Nη |
|---|---|---|---|---|---|---|---|---|---|
| 1 | 60.67252 | 47.04431 | −33.01004 | 7.40006 | 14 | 61.01128 | 44.87821 | −46.74036 | 10.13738 |
| 2 | 60.17864 | 46.93895 | −30.86919 | 6.45290 | 15 | 60.76212 | 44.01892 | −46.94133 | 10.18699 |
| 3 | 59.81699 | 48.74632 | −25.82338 | 0.74494 | 16 | 61.28226 | 50.67570 | −47.23414 | 33.92758 |
| 4 | 60.53295 | 47.23867 | −33.20820 | 5.82580 | 17 | 61.47117 | 50.37993 | −49.08571 | 16.90842 |
| 5 | 59.58150 | 47.53862 | −29.42701 | 2.69865 | 18 | 61.47992 | 47.65561 | −48.96967 | 11.51426 |
| 6 | 60.68892 | 49.10637 | −46.17585 | 36.11851 | 19 | 61.34856 | 46.74048 | −48.27300 | 10.28491 |
| 7 | 60.79275 | 49.20102 | −44.22487 | 27.44328 | 20 | 61.09098 | 45.83825 | −49.45568 | 9.12728 |
| 8 | 60.47532 | 47.56407 | −42.82931 | 22.60583 | 21 | 61.84459 | 50.61068 | −50.14343 | 17.53717 |
| 9 | 60.35874 | 47.47082 | −43.73613 | 29.50102 | 22 | 61.98637 | 48.39994 | −50.61216 | 9.68058 |
| 10 | 60.10105 | 43.14200 | −44.81508 | 9.79513 | 23 | 61.63671 | 49.16293 | −49.46483 | 14.04272 |
| 11 | 60.66053 | 50.80369 | −45.94308 | 24.00583 | 24 | 61.44286 | 49.20397 | −49.50305 | 13.32893 |
| 12 | 61.00145 | 49.89920 | −45.77424 | 30.54091 | 25 | 60.81256 | 46.68940 | −49.42762 | 9.99500 |
| 13 | 61.14776 | 50.07391 | −45.88708 | 17.35266 |
Laser power on the depth and width of the cladding layer is the most influential, while the scanning speed and the powder feeding rates have little impact on the depth and width of the cladding layer. Besides, the laser power almost determines the cladding depth, because the laser power determines the energy amount per unit area on the substrate. Meanwhile, the S/NW values are based on the S/NW response table shown in table 6, where the ranking of the influence of each process parameter on the cladding width and cladding depth is consistent with the ANOVA results. The main influence of S/NW is shown in figures 7(a) (c), where the trend of the influence of each process parameter on the cladding width and cladding depth can be seen. The cladding width increases with the increase of laser power, while the cladding depth decreases as the laser increases. The influence of powder feeding amount on the cladding width, the influence of scanning speed and powder feeding speed on coating width both fluctuate around the average value. If the aim is to obtain the maximum cladding width unilaterally, the level of the process parameter can be selected as P5V2F1; while selecting the process parameter level of P5V1F1 can obtain a smaller cladding depth.
Table 6. Response table for S/NW , S/NH , S/Ndm, S/Nη .
| W | H | dm | η | |||||||||
|---|---|---|---|---|---|---|---|---|---|---|---|---|
| Level | P | V | F | P | V | F | P | V | F | P | V | F |
| 1 | 60.16 | 61.03 | 61.05 | 47.5 | 49.65 | 46.22 | −30.47 | −44.5 | −44.83 | 4.62 | 23.8 | 9.71 |
| 2 | 60.48 | 61.09 | 60.92 | 47.3 | 48.96 | 47.19 | −44.36 | −44.11 | −44.34 | 25.09 | 18.21 | 15.42 |
| 3 | 60.92 | 60.91 | 60.76 | 47.93 | 48.64 | 48.76 | −46.26 | −42.59 | −42.99 | 18.45 | 13.25 | 14.93 |
| 4 | 61.33 | 60.94 | 60.82 | 48.26 | 47.11 | 48.41 | −48.6 | −44.29 | −43.69 | 16.35 | 13.82 | 20.58 |
| 5 | 61.54 | 60.47 | 60.88 | 48.81 | 45.45 | 49.21 | −49.83 | −44.01 | −43.66 | 12.92 | 8.36 | 16.8 |
| Delta | 1.39 | 0.62 | 0.29 | 1.52 | 4.2 | 2.99 | 19.36 | 1.91 | 1.84 | 20.47 | 15.44 | 10.87 |
| Contribution | 82.32% | 14.70% | 2.99% | 7.78% | 60.30% | 31.92% | 98.28% | 0.92% | 0.80% | 53.54% | 31.94% | 14.52% |
| Rank | 1 | 2 | 3 | 3 | 1 | 2 | 1 | 2 | 3 | 1 | 2 | 3 |
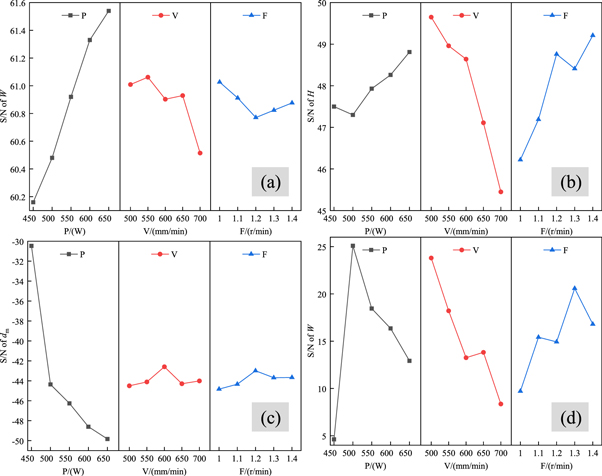
Figure 7. Main effects plots. (a) Main effects plot for S/NW . (b) Main effects plot for S/NH . (c) Main effects plot for S/Ndm. (d) Main effects plot for S/Nη .
Download figure:
Standard image High-resolution imageFor the degree of influence of the melting height, the order of the degree of influence of the three process parameters is V > F > P. The main reason is that the scanning speed and the powder feeding speed determine the powder amount per unit area on the substrate. It can be seen from figure 7(b) that the melting height decreases with the increase of the scanning speed, but with the increase of the laser power and powder feeding speed, the melting height presents a trend of oscillation rising. As shown in figure 7(b), if it is goal-directed to obtain a larger melting height, the level of the process parameter P5V1F5 can be used.
As shown in the ANOVA results of S/Nη in table 7, the influence degree of process parameters on the dilution rate is ordered as P > V > F. However, it is difficult to obtain the influence rule of the process parameters on the dilution rate because the dilution rate is jointly influenced by the three process parameters. To obtain a dilution rate of 30%, it can be deduced from figure 7(d) that the process parameter level P2V3F3 can be chosen.
Table 7. The normalized results for S/N.
| NO. | S/NW | S/NH | S/Ndm | S/Nη | NO. | S/NW | S/NH | S/Ndm | S/Nη |
|---|---|---|---|---|---|---|---|---|---|
| 1 | 0.454 | 0.509 | 0.710 | 0.188 | 14 | 0.595 | 0.227 | 0.156 | 0.266 |
| 2 | 0.248 | 0.496 | 0.796 | 0.161 | 15 | 0.491 | 0.114 | 0.148 | 0.267 |
| 3 | 0.098 | 0.731 | 1.000 | 0.000 | 16 | 0.707 | 0.983 | 0.136 | 0.938 |
| 4 | 0.396 | 0.535 | 0.702 | 0.144 | 17 | 0.786 | 0.945 | 0.062 | 0.457 |
| 5 | 0.000 | 0.574 | 0.855 | 0.055 | 18 | 0.789 | 0.589 | 0.066 | 0.304 |
| 6 | 0.460 | 0.778 | 0.179 | 1.000 | 19 | 0.735 | 0.470 | 0.094 | 0.270 |
| 7 | 0.504 | 0.791 | 0.258 | 0.755 | 20 | 0.628 | 0.352 | 0.047 | 0.237 |
| 8 | 0.372 | 0.577 | 0.314 | 0.618 | 21 | 0.941 | 0.975 | 0.019 | 0.475 |
| 9 | 0.323 | 0.565 | 0.277 | 0.813 | 22 | 1.000 | 0.686 | 0.000 | 0.253 |
| 10 | 0.216 | 0.000 | 0.234 | 0.256 | 23 | 0.855 | 0.786 | 0.046 | 0.376 |
| 11 | 0.449 | 1.000 | 0.188 | 0.658 | 24 | 0.774 | 0.791 | 0.045 | 0.356 |
| 12 | 0.590 | 0.882 | 0.195 | 0.842 | 25 | 0.512 | 0.463 | 0.048 | 0.261 |
| 13 | 0.651 | 0.905 | 0.191 | 0.469 |
4.3. Optimization based on grey-fuzzy inference system
Before analyzing and optimizing the laser cladding process parameters, S/N of each response needs to be normalized to eliminate the influence of magnitude on the analysis results, and the normalized results are shown in table 7.
After the normalization process, GRC is calculated for each value and the mean of GRC for each output response in all the respective dimensions is calculated to obtain the GRG. After calculating the GRC and GRG, the grey-fuzzy relational grade (GFRG) of each group of experiments is calculated by a fuzzy inference machine, and the rule calculation model of the fuzzy inference machine is shown in figure 8, and figure 9 shows the comparison between GRG and GFRG for each operation. Table 8 lists the final results of the GRC, GRG and GFRG as well as the ranking of GFRG. The laser cladding process parameter corresponding to the maximum value of GFRG represents the optimal output response result, and the 16th set has the largest GFRG, indicating that the process parameter is optimal. As shown in tables 9–10, the scanning speed has the most significant effect on GFRG, while laser power and powder feeding rate have little effect on GFRG. Figure 10 shows the main effect plot of GFRG, and the process parameter level is P4V1F4 (P: 600W, V: 500 mm min−1, F−1 : 1.3 r min−1) if the highest GFRG value is desired.

Figure 8. Fuzzy inference machines for rule-based computational models.
Download figure:
Standard image High-resolution image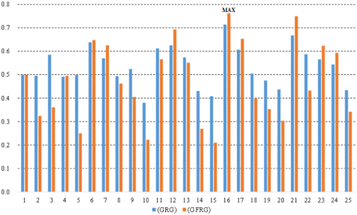
Figure 9. Comparison of GRG and GFRG.
Download figure:
Standard image High-resolution imageTable 8. Results of GRC, GFRG and ranking for laser cladding experiment.
| Grey relational coefficient(GRC) | Grey relational grade | Grey-fuzzy relational grade | Rank | ||||
|---|---|---|---|---|---|---|---|
| NO. | W | H | dm | η | (GRG) | (GFRG) | |
| 1 | 0.478 | 0.505 | 0.633 | 0.381 | 0.499 | 0.500 | 11 |
| 2 | 0.399 | 0.498 | 0.711 | 0.374 | 0.495 | 0.324 | 20 |
| 3 | 0.357 | 0.651 | 1.000 | 0.333 | 0.585 | 0.360 | 17 |
| 4 | 0.453 | 0.518 | 0.627 | 0.369 | 0.491 | 0.495 | 12 |
| 5 | 0.333 | 0.540 | 0.775 | 0.346 | 0.499 | 0.250 | 23 |
| 6 | 0.481 | 0.693 | 0.378 | 1.000 | 0.638 | 0.647 | 5 |
| 7 | 0.502 | 0.705 | 0.402 | 0.671 | 0.570 | 0.625 | 6 |
| 8 | 0.443 | 0.542 | 0.422 | 0.567 | 0.493 | 0.462 | 13 |
| 9 | 0.425 | 0.535 | 0.409 | 0.728 | 0.524 | 0.405 | 15 |
| 10 | 0.389 | 0.333 | 0.395 | 0.402 | 0.380 | 0.223 | 24 |
| 11 | 0.476 | 1.000 | 0.381 | 0.594 | 0.613 | 0.566 | 9 |
| 12 | 0.550 | 0.809 | 0.383 | 0.760 | 0.626 | 0.693 | 3 |
| 13 | 0.589 | 0.840 | 0.382 | 0.485 | 0.574 | 0.551 | 10 |
| 14 | 0.552 | 0.393 | 0.372 | 0.405 | 0.430 | 0.269 | 22 |
| 15 | 0.496 | 0.361 | 0.370 | 0.405 | 0.408 | 0.210 | 25 |
| 16 | 0.631 | 0.968 | 0.367 | 0.890 | 0.714 | 0.762 | 1 |
| 17 | 0.700 | 0.900 | 0.348 | 0.479 | 0.607 | 0.653 | 4 |
| 18 | 0.704 | 0.549 | 0.349 | 0.418 | 0.505 | 0.399 | 16 |
| 19 | 0.653 | 0.485 | 0.356 | 0.406 | 0.475 | 0.353 | 18 |
| 20 | 0.573 | 0.436 | 0.344 | 0.396 | 0.437 | 0.304 | 21 |
| 21 | 0.895 | 0.952 | 0.338 | 0.488 | 0.668 | 0.750 | 2 |
| 22 | 1.000 | 0.614 | 0.333 | 0.401 | 0.587 | 0.432 | 14 |
| 23 | 0.775 | 0.700 | 0.344 | 0.445 | 0.566 | 0.623 | 7 |
| 24 | 0.689 | 0.705 | 0.344 | 0.437 | 0.544 | 0.593 | 8 |
| 25 | 0.506 | 0.482 | 0.344 | 0.404 | 0.434 | 0.342 | 19 |
Table 9. ANOVA for GFRG.
| Source | DF | Seq SS | Adj MS | F | P | Contribution |
|---|---|---|---|---|---|---|
| P | 4 | 25.17094 | 169.3491 | 2.49279 | 0.09882 | 10.61% |
| V | 4 | 169.3491 | 42.80452 | 16.77138 | 0.00007 | 71.36% |
| F | 4 | 42.80452 | 30.29252 | 4.23912 | 0.02286 | 18.04% |
| Error | 12 | 30.29252 | 267.61707 | |||
| Total | 24 | 267.61707 |
Table 10. Response for means of GFRG.
| GFRG | |||
|---|---|---|---|
| Level | P(W) | V(mm/min) | F(r/min) |
| 1 | 0.386 | 0.645 | 0.3646 |
| 2 | 0.473 | 0.545 | 0.4316 |
| 3 | 0.458 | 0.479 | 0.4896 |
| 4 | 0.494 | 0.423 | 0.5509 |
| 5 | 0.548 | 0.266 | 0.5218 |
| Delta | 0.163 | 0.379 | 0.1864 |
| Rank | 3 | 1 | 2 |
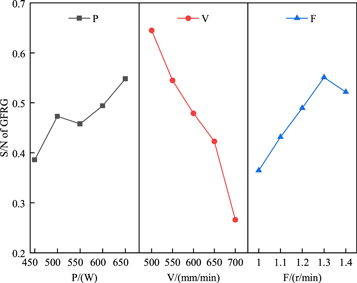
Figure 10. Main effects plot of GFRG.
Download figure:
Standard image High-resolution imageThe results obtained by Gray-fuzzy Taguchi Approach mentioned in this study are able to perform multi-objective optimization of process parameters directly based on experimental data compared to building polynomial regression predictions and then performing multi-objective optimization of process parameters [32, 33]. Although the method mentioned in this study is only able to select process parameters when they are already available, the results can assist engineers in deciding on the better process parameters. Also, the ANOVA results obtained in this study can assist engineers in understanding the relationship between the process parameters and the quality characteristics of the clad layer when the powder material used is fused to the substrate material. A large number of test experiments in engineering can consume a lot of resources such as time, cost and material, and the regression prediction model between process parameters and cladding quality characteristics using machine learning method proposed in [34, 35] requires more test data and does not facilitate to obtain the influence law between process parameters and cladding quality characteristics. It is difficult to be used in engineering.
5. Verification experiment
Based on Gray-fuzzy Taguchi approach, the optimal process parameter portfolio is P4V1F4 (P: 600W, V: 500 mm min−1, F−1 : 1.3 r min−1). To verify the feasibility of the optimization method, the 6th group with the dilution rate closest to 30% is selected as the control group, the process parameters of the control test group are P2V1F2 (P: 500W, V: 500 mm min−1, F−1 : 1.1 r min−1), and the optimized process parameters are used for repeated experiments to verify the repeatability of the experiment. As shown in table 11, although the dilution rates of the control group and the optimization group are relatively close, W and H of the optimization group are improved that the minimum increase of 7.070%, indicating that the optimized process parameters can obtain a larger melt pool area while obtaining a better dilution rate. Meanwhile, the experimental results of the verification group showed that the relative errors of the molten layer parameters were all less than 7.149%, which indicated that the experiments were reproducible.
Table 11. Experiment reproducibility verification.
| Level | W(μm) | H(μm) | dm(μm) | Ac(μm2) | Am(μm2) | η | |
|---|---|---|---|---|---|---|---|
| Control group | P2V1F2 | 1082.545 | 285.311 | 203.607 | 212170.521 | 88115.901 | 29.344% |
| Optimization group | P4V1F4 | 1159.079 | 341.81 | 229.989 | 300699.953 | 123767.9 | 29.160% |
| Verification group | P4V1F4 | 1217.548 | 360.031 | 239.491 | 315593.426 | 132615.604 | 29.590% |
| Error1 | 5.044% | 5.331% | 4.132% | 4.953% | 7.149% | 1.473% | |
| Error2 | 7.070% | 19.803% | 12.957% | 41.726% | 40.460% | −0.627% |
In summary, it is proved that the optimization method can effectively solve the optimization problem of laser cladding process parameters, and can obtain the relationship between the process parameters and the cladding layer parameters. Finally, to verify that the 15-5PH cladding layer has excellent performance and can meet actual requirements, the performance of the cladding layer under optimized process parameters will be analyzed below.
5.1. Phase and microstructure characteristics
As shown in figure 11(a), the cladding is symmetrically distributed and there is a good metallurgical bond between the cladding and the substrate, as there are distinct condensation lines at the cladding-substrate interface. The metallographic organization of 45# steel base material is mainly composed of ferrite and laminated pearlite (figures 11(g), (h)), and the heat affected zone metallographic organization is mainly composed of ferrite and carbide (figure 11(f)).
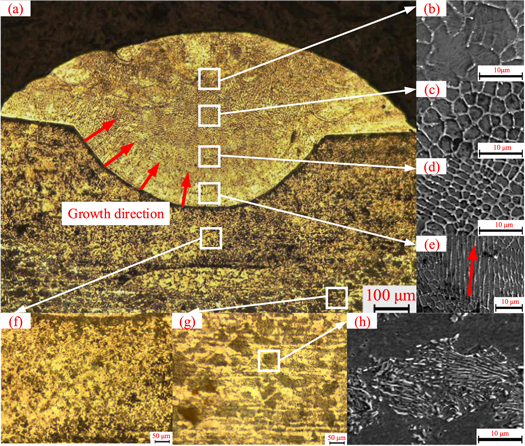
Figure 11. Micrograph of specimen section.
Download figure:
Standard image High-resolution imageAs shown in figures 11(a)–(e), the microstructure of the cladding layer is mainly composed of planar crystals, columnar crystals and equiaxed crystals, and its structure is dominated by the precipitation of network carbides from the martensite matrix. The columnar crystals are distributed at the bottom of the cladding layer that its growth direction is toward the top of the middle of the cladding layer (figure 11(e)). The reason why columnar crystals transformed into equiaxed crystals is that the temperature gradient G of the cladding layer decreases and the solidification rate R increases, resulting in a decrease in the crystallization parameter G/R when it is close to the top of the coating. Meanwhile, the equiaxed crystals in the middle of the cladding layer show a trend of getting bigger as they get closer to the top of the cladding layer (figures 11(b), (c), (d)). The closer to the top of the coating, the more obvious the heat dissipation, the temperature gradient dominates, so that G × R decreases and the equiaxed crystal becomes larger [25, 26].
Figure 12 is the x-ray diffraction pattern of the cladding layer. According to the analysis, the phases contained in the cladding layer are mainly NiCx, MC, α- Fe, (Cr-Fe), ε- Cu, Cr, Fe-Cr and Fe3C. Because the 15-5PH powder contains elements such as Nb, which combine with C to form MC carbides and the existence of ε-Cu. At the same time, due to the high content of Cr, there are Cr elemental and Fe-Cr intermetallic compounds in the cladding layer, the presence of Ni produces a large amount of NiCx.

Figure 12. XRD characteristics of laser cladding layers.
Download figure:
Standard image High-resolution image5.2. Microhardness, friction and wear properties
As shown in figure 13, the average hardness of the 15-5PH cladding layer is 563.3HV, the average hardness of the 45# substrate is 191.1HV, and the hardness of the cladding layer is about 2.9 times that of the substrate. The hardness of the cladding layer near the surface shows a gradual decrease, which also indicates that changes in the size of the equiaxed grains lead to changes in the hardness of the coating; grain refinement causes an increase in hardness, while grain coarsening causes a decrease in hardness. Meanwhile, the formation of more Cr and Ni enriched phases in the cladding layer due to a large amount of Cr and Ni in the 15-5PH powder leads to a significant increase in hardness. The presence of Nb and Cu causes the cladding layer to form a hard phase, which increases the hardness. The phenomenon of a sharp increase and then a sharp decrease in hardness in the heat affected zone occurs because of the dilution and remelting of the cladding layer [27].
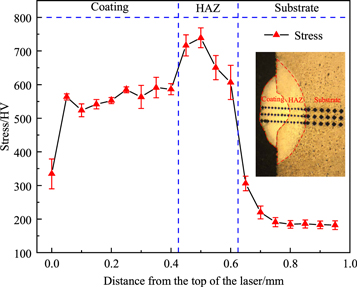
Figure 13. Microhardness distribution of cladding layers.
Download figure:
Standard image High-resolution imageBy comparing the weights of the samples before and after the test, it is concluded that the wear mass of the 45# substrate is 0.168g, and the wear mass of the sample with the cladding layer is 0.055g. At the same time, it can be seen from figure 14 that the friction coefficient of the 15-5PH coating is about 0.4713. The friction coefficient of the 45# substrate is 0.6218, and the results show that the frictional wear performance of the 15-5PH cladding layer is better than that of the 45# substrate. Figure 15 is the SEM image of the wear surface of the cladding layer. From figure 15(a), it can be seen that part of the hard phase falls off during the friction process. Under the action of wear loads, grooves are formed in the friction sub and friction surface, which is an obvious characteristic of abrasive wear [28]. As shown in figures 15(b)–(d), as the wear progresses, a large amount of wear debris is generated and adheres to the wear surface, resulting in adhesive wear. As wear continues, debris adhering to the wear surface is dislodged and pits are formed on the wear surface [36, 37]. It shows that the wear mechanism of 15-5PH cladding layer is abrasive wear and adhesive wear [38, 39].
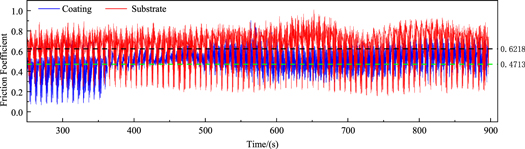
Figure 14. The friction coefficient of the substrate and coating.
Download figure:
Standard image High-resolution image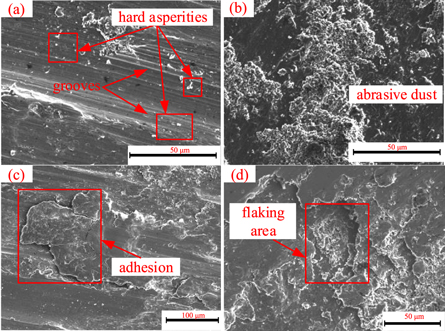
Figure 15. SEM image of worn surface in cladding layer.
Download figure:
Standard image High-resolution image5.3. Corrosion properties of laser clad coatings
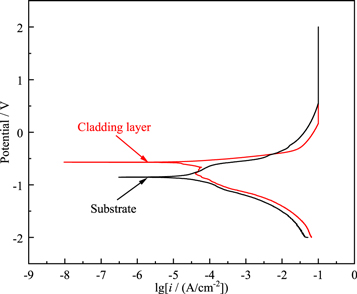
Figure 16 shows the TAFEL polarization curves of the 45# substrate and 15-5PH cladding layer. Only the 15-5PH cladding layer curve has four areas: active dissolution zone, transition zone, passivation zone and overpassivation zone, while no obvious passivation zone is seen on the 45# substrate. The self-corrosion current density and self-corrosion potential can reflect the corrosion resistance. The lower the self-corrosion current density and the higher the self-corrosion potential, the better the corrosion resistance. According to the extrapolation method of Tafel curve, the self-corrosion current of base material 45# is −4.6952 A cm−2, the self-corrosion potential is −0.8191V; the self-corrosion current of 15-5PH coating is −6.7009 A cm−2, the self-corrosion potential is −0.5701V. The self-corrosion current of the 15-5PH coating is lower than that of the 45# substrate, and the self-corrosion potential of the 15-5PH coating is higher than that of the 45# substrate, indicating that the corrosion resistance of the coating is stronger than that of the 45# substrate. 15-5PH coating rich in Cr, Ni and other elements can assist in the formation of corrosion-resistant protective film, the presence of Nb elements in the coating can improve intergranular corrosion and can change the electrode potential of Cu elements [39]. In summary, the corrosion resistance of cladding layer is better than 45# substrate.
Figure 16. Polarization curves of the 15-5PH coating and the 45# steel substrate.
Download figure:
Standard image High-resolution image
6. Conclusions
15-5PH stainless steel is widely used in the aerospace field due to its excellent performance. The traditional welding repair technology cannot meet the higher requirements of 15-5PH parts, while the laser cladding technology solves this problem wonderfully. To obtain the optimal laser cladding process portfolio and improve the morphology and performance of the coating, the grey-fuzzy Taguchi combination method is used to optimize the process parameters portfolio of laser cladding 15-5PH.
- The ANOVA of the surface topography and dilution rate of the cladding layer shows that the cladding width and the cladding depth mainly depend on the laser power, scanning speed has a great influence on melting height, the dilution rate is determined by the coupling of the laser power and scanning speed. Combined with the grey relational and fuzzy inference system, the best process parameters for 15-5PH powder laser cladding in 45 steel substrate were obtained: laser power is 600W, the scanning speed is 500mm min−1 and powder feeding rate is 1.3 r min−1.
- The ANOVA of the grey-fuzzy relational grade shows that the scanning speed plays a decisive role in getting the optimal cladding result with the four geometrical features at the same time, while the laser power and the powder feeding rate make little difference. The geometric morphology characteristics of the No. 16 cladding layer obtained by the verification and comparison experiment are all up to the standard, and the optimized cladding layer is better than the geometric morphology of the No. 6 cladding layer, and the repeatability of the experiment is verified by the repeatability experiment. This proves that the grey-fuzzy Taguchi method is an effective and reliable method for laser cladding optimization.
- Through the microstructure, XRD phase analysis, hardness, wear resistance and corrosion resistance of the cladding layer, the results show that the 15-5PH cladding layer and 45# matrix possess fine metallurgical bonding properties. Carbides precipitate on the body matrix to form columnar crystals and equiaxed crystals. The main phases are NiCx, MC, α-Fe, (Cr-Fe), ε-Cu, Cr, Fe-Cr and Fe3C, etc; 15-5PH The hardness of the cladding layer is 2.9 times that of the 45# substrate, and the hardness has been significantly improved; the wear mechanism of the cladding layer is mainly adhesive wear and abrasive wear. The friction coefficient of the 15-5PH cladding layer is lower than that of the 45# substrate. It shows that the wear resistance of the cladding layer is better improved compared with that of the substrate; the presence of Cr, Nb, Cu and other elements in the cladding layer inhibits the corrosion process, and the corrosion resistance of the cladding layer is more significantly improved than that of the base material.
Data availability statement
The data cannot be made publicly available upon publication because no suitable repository exists for hosting data in this field of study. The data that support the findings of this study are available upon reasonable request from the authors.
Authors' contributions
The study conception and design, material preparation, data collection and analysis were performed by Yanbin Du, Guohua He, Zhijie Zhou, Lei Xu and Meina Huang. The first draft of the manuscript was written by Guohua He and Zhijie Zhou, all authors commented on previous versions of the manuscript. All authors read and approved the final manuscript.
Funding
We gratefully acknowledge the financial support of Natural Science Foundation of Chongqing, China (Grant No. CSTB2022NSCQ-LZX0011), the Innovative Research Group of Universities in Chongqing (Grant No. CXQT21024), the Chongqing Talent Program (Grant No. CQYC20210302226), the 'Lump-sum System' Project of Chongqing Talent Plan (Grant No. cstc2022ycjh-bgzxm0056), and the Research Platform Foundation of Chongqing Technology and Business University (Grant No. KFJJ2022026).
Declaration of Conflicting Interests
The author(s) declared no potential conflicts of interest with respect to the research, authorship, and/or publication of this article.