
Abstract
Pulse DC Sintering System (PDCS) produces metallic and nonmetallic samples in a cheap and efficient way in a short time. Some PDCS systems possess thyristor-based rectifiers to control their output power. This results in PDCS systems creating power system harmonics. The harmonic content of an PDCS system varies during sample manufacturing process since the PDCS container resistance is temperature dependent. In this study, power system harmonics of a PDCS system is examined for the first time in literature. A power analyzer device is used to measure and record the supply side current, voltage and power of the PDCS system as a function of time. Besides, an infrared temperature meter module is a used to measure PDCS container temperature and record it with respect to time during sample production. Total harmonic distortion is found to be decreasing with container temperature increasing.
Export citation and abstract BibTeX RIS
1. Introduction
The electric activated/assisted Pulse DC Sintering System (PDCS) or sintering method is receiving worldwide attention due to its ability to effectively densify powders into useable bulk materials [1–3]. A number of names and acronyms have been utilized to designate the resistive sintering (RS) process in literature during more than 80 years of scientific investigation [4, 5]. It should be noted that the name PDCS was introduced to designate the consolidation methods based on the application of an electric field/current regardless their waveforms used [2, 4, 6]. Up until now, more than 1800 scientific articles in this area have been published with an increasing growth starting in the earlier 90 s as a consequence of the availability of commercial PDCS devices [4]. Thanks to this system, a wide range of materials can be produced from intermetallic materials to ceramics and composites [7–11].
There are different apparatuses used in resistive sintering process and different electric current waveforms have been applied to the sintering samples or PDCS system container reported in literature [4, 5]. PDCS system container or output current waveforms can be classified as square, sinusoidal, seesaw, etc considering their shapes. The scientific community has most of the time adopted the PDCS output current waveforms as; -constant(DC), -AC, - pulsed DC and -pulsed DC + DC considering their polarity and shapes [4, 5]. Arc furnaces which are also high power metallurgical devices like PDCS systems are commonly used in industrial settings to heat and melt metals and their power system harmonics and power requirements have been examined in literature [12–21]. However, to the best of our knowledge, utility side or power system side input harmonics and powers of a PDCS system have not been examined in literature previously.
The PDCS system used in this study produces samples in a matter of minutes since it has a very high output current, in the order of kilo amperes, flowing through the sample. The PDCS system consists of mainly a three phase thyristor-based AC chopper, a three phase transformer with delta-connected primary windings and interleaved secondary windings, an output rectifier, a shock coil, dc-bar system, the pressurized electrode system and a container. The AC chopper, whose thyristors are placed at the utility/primary side, are used to adjust the voltages applied to the primary windings of the transformer which has two interleaved windings with low voltage and high current output at the secondary side for each phase. All of the interleaved windings' center taps are connected together. The secondary windings are connected in the proper way to obtain a three phase center tapped full wave rectifiers using a diode for each interleaved winding. The rectifier has a low voltage output. The dc bars connected to the output of the rectifier are short-circuited throughout the system container placed between cupper electrodes pressurized mechanically. Therefore, the sample and the container of the PDCS system have also a low voltage. The high sintering current flowing the container is provided using the rectifier whose current is controlled with the AC chopper connected to the utility. The overall sintering system can be regarded as a thyristor-based rectifier. The semiconductor-controlled rectifier draws harmonic currents depending on the triggering angle. The sample and the PDCS container resistance are temperature-dependent. Therefore, the sample power or the PDCS output power is also temperature-dependent. That's why the instantaneous, active and reactive powers withdrawn from the utility varies by time. This results in a varying harmonic content drawn from the utility by the thyristor-controlled rectifier. The rectifiers are the main reasons for utility harmonics. The other is large power transformer magnetization currents. The PDCS system has both of the circuit elements. That's why it is important to examine the PDCS system harmonics and its total harmonic distortion since even non-controlled rectifiers draw considerable harmonic content.
In this paper, Power system harmonic and power quality analysis of a PDCS system during Sample Production is done. The PDCS system used in this study has 3000 A and 20 V pulsed DC output. An experiment is performed to produce an intermetallic sample and the measurements are made during the process. A power harmonic analyzer is used for examining PDCS system's current and voltage harmonics, active power, reactive power, power factor, displacement power factor etc. The PDCS system container temperature is also measured during sample production using an infrared temperature-meter.
The paper is arranged as follows. In the second section, the PDCS system is briefly told. In the third section, the necessary formulas for harmonic analysis are given. In the fourth section, the measurement results are given. The paper is concluded with the last section.
2. PDCS system and its electrical power circuit
2.1. PDCS system
PDCS is a system which has a remarkable feature compared to other conventional methods. It allows sintering of composite, ceramics, metal, intermetallic materials at very low temperatures compared to the conventional furnace operation temperatures because of the joule energy produced in the system container under mechanic pressure and very short production times measurable in minutes. In the PDCS technique, which is a way to obtain perfect combination of electric current and mechanical pressure, the starting material may be dust or compacted. The main aim of the electric current is to ensure the energy needed for resistance-based heating in the container in which the sample is placed. Mechanical structure of a typical PDCS without a vacuum chamber system is illustrated in figure 1. Pulsed DC current is used to provide the heat needed to produce the sample in this PDCS system. Electrical Schematic of the PDCS system used in this study is shown in figure 2.

Figure 1. Mechanical structure representation of PDCS system.
Download figure:
Standard image High-resolution image
Figure 2. PDCS system power electronics circuit.
Download figure:
Standard image High-resolution imageIt has an AC chopper at the input to adjust the rms voltage value of the phase voltages of the delta connected primary windings of the transformer rated at 60 kVA. The secondary has two center-tapped windings for each phase. The center taps of each phase are connected together. The other nodes of the windings are connected throughout diodes together to make a three-phase center-tapped rectifier. Each winding only provides current for just an alternance to prevent the very high currents from damaging or overheating of the windings. Although the rectifier is an uncontrolled rectifier, the AC chopper at primary side results in overall system behaving as a controlled rectifier. The system user or the operator is able to set the desired DC current flowing through the sample. The system measures the resistor current connected in series with the sample for that purpose and trigger the thyristors accordingly.
3. Harmonic analysis formulas
The current and the voltage one of the phases can be written in Fourier series and expressed as

and

Total harmonic distortion of a phase current and a phase voltage are given as

and

where Irms, Vrms, I1rms and V1rms are rms values of a phase current, a phase voltage and their fundamentals respectively.
Assuming the phase currents are shifted by 120 electrical degrees, the active and reactive power of the system can be written as

and

4. Experimental results
In this section, basic information about the experimental setup used in this study is given and experimental results obtained during an intermetallic sample production process by the PDCS system are given. The experimental setup of the PDCS system which contains all measurement devices is shown in figure 3. A CA brand 6 to 600 Vrms AC + DC power analyzer is used with a 500 mA to 200 A current probe to measure and record current, voltage, and power of one of the phases of the PDCS system as a function of time. An infrared temperature meter module placed 70 cm away from the PDCS container, whose analog output is connected to a data logger, is also used to measure PDCS container temperature and record it with the data logger with respect to time during sample production. The sample production process in the PDCS system is manually controlled by the device user which operates the power electronics circuit of the PDCS system by turning on, adjusting the desired current, and turning off the system. The operator shut downs the power electronics circuit when the sample production process is finished. The PDCS container is left to cool down and the sample is ready to take out once it is cold enough. In the experiment done to measure the PDCS harmonics, an intermetallic sample is placed within the PDCS container and the PDCS container is placed among two DC bus terminals loaded with hydraulic pressure. The system is turned on to produce the sample and the measurements are taken by the power analyzer and the temperature meter to make harmonic analysis of the PDCS system.

Figure 3. Priciple schematic of the experimental setup of the PDCS system.
Download figure:
Standard image High-resolution imageThe waveforms taken during the sample production are shown in figures 4–9. The container temperature during the sample production is shown in figure 4. During sample production, the power electronics system adjusts the thyristor triggering angles to maintain the desired current adjusted by the operator and the triggering angles varies with time since the sample temperature increases and the container resistance falls down during the sintering process. Current and voltage waveforms of only one of the PDCS system phases are measured and shown in figure 5. The phase current shows that the rectifier operates in discontinues conduction mode. The phase current has more distortion than the phase voltage. The phase voltage looks almost sinusoidal and its total harmonic distortion (THD) is a little higher than 3% but it meets the IEEE STD 519 standards. The phase voltage and current spectrums are shown in figure 6 and they are assumed to be the same for each phase. The phase current spectrum do not meet IEEE STD 519 standards. The input current, the output current and the output voltage of the PDCS system are acquired by an oscilloscope for an electrical period and shown in figure 7. The RMS Values, the total harmonic distortions and the short-term perceptibility flicker index of one of the input phase voltage and phase current of the PDCS phases are measured during operation and shown in figure 8. Active power, reactive power, apparent power, power factor and displacement power factor of the PDCS system are shown in figure 9.
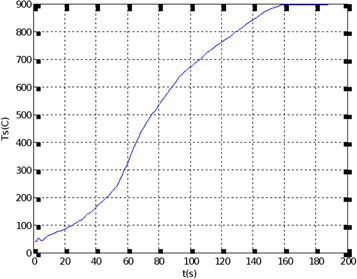
Figure 4. The container temperature versus time during the sintering process.
Download figure:
Standard image High-resolution image
Figure 5. Voltage and current waveforms of the measured phase of the PDCS system.
Download figure:
Standard image High-resolution image
Figure 6. The voltage (black bars) and current (gray bars) spectrums of the measured phase of the PDCS system.
Download figure:
Standard image High-resolution image
Figure 7. PDCS system input and output electrical dynamics acquired by an ossiciloscope for an electrical period: Ch1: Bar voltage drop, Ch2: sample voltage and Ch3:AC input current of the measured phase.
Download figure:
Standard image High-resolution image
Figure 8. (a) The RMS Values of the measured input phase voltage and current, (b) the total harmonic distortions of the measured input phase voltage and current, (c) the short-term perceptibility flicker index for the PDCS phase to which the power analyzer connected.
Download figure:
Standard image High-resolution image
Figure 9. (a) Active power and reactive power, (b) apparent power, (c) power factor and displacement power factor of the PDCS system.
Download figure:
Standard image High-resolution image
During the sintering process, the container or the sample temperature should not rise too quickly to avoid instantaneous overheating and consequently to allow the reaction to take place properly. Otherwise, the sintering process would just be simplified to giving the highest current possible in PDCS system under the high hydraulic pressure required. Therefore, the reference temperature should be risen slowly at the beginning of the sintering process by increasing the reference current or the input power by the PDCS operator for around 100 s as shown in figures 4, 8, 9. Then, the reference current or the device input current is adjusted to a constant value by the operator in the interval from 100 s to 400 s as shown in figure 8. That's why, until around 100 s, the power is not constant and keeps increasing and stays almost same during sintering as shown in figure 9. The PDCS system has a varying input harmonic content as shown in figure 9. Around 400 s, the system is shutdown, output power gradually becomes zero and these results in active, reactive and apparent power falling down considerably. After that, the power is consumed by the system fan used for cooling the power components.
Power factor before the steady-state starts from 0.4 and goes up to 0.83 when the container temperature reaches to steady-state. It stays almost 0.82 until the output current is made zero after the sintering is completed. In that case, only the cooling fan current is drawn by the transformer primary windings and the power factor is higher in this case due to the fact that the fan active power is higher than its reactive power. Displacement power factor is around 0.95 during the steady-state.
Total harmonic distortion of the input phase voltage is less than 3.5% during the process. Pst (the short-term perceptibility flicker index) is small at the beginning of the process, it increases before the container reaches to the steady-state and then falls down again and stays constant for most of the time when the container temperature is in steady-state, and it increases again before the power electronics system gets turned off and takes a high value after that. Total harmonic distortion of the input currents is very high before the steady-state, it is 84% at the beginning of the process, falls down from 84% to 56% when the steady-state is reached. It is around 56% but slowly increases to 62% in steady-state, and then it increases up to 125% after the sintering is completed when the system is turned off gradually by varying the triggering angles. When the system has complete shut-down only fan motor continues running and it has no harmonics distortion since it draws sinusoidal currents. The experiment results show that the system does not meet IEEE STD 519 harmonic standards for phase currents.
5. Conclusion
The pulse DC sintering is an important sample production method since it produces samples quickly and dissipates less energy than the other sintering methods. In this paper, input harmonics of a the PDCS system during the sample production are examined experimentally. It is shown that the PDCS system has very high input current harmonics and very high reactive power, and relatively low power factor. Such a system does not meet IEEE STD 519 standard which was first introduced in 1981 to provide direction on dealing with harmonics introduced by static power converters and other nonlinear loads so that power quality problems could be prevented. Sample or the container resistance falls down and the input and output power increases while as its container temperature increases. The output power stays almost constant when the PDCS container temperature becomes almost constant (Actually, it falls down with very slowly). During the steady-state operation, the system has a very low power factor and it is almost equal to 0.82. The power factor takes its lowest value in steady-state and takes higher values at the beginning and the end of the process. During the steady-state when the temperature is (almost) constant, total harmonic distortion of the system is the lowest although it does not meet IEEE standards. At the beginning and at the end of the process, the total harmonic distortion is even worse.
A series production system using PDCS method would result in a huge amount of utility harmonics and a low power factor which is out of IEEE standards. We conclude that the PDCS systems either with high power output or one used for mass production must have either a built-in or an exterior reactive power compensation system to meet IEEE standards.