
Abstract
This research reports the WEDM of heat treated Ti-6Al-4V by considering the pulse on/off duration, current, voltage and wire feed rate as machining parameters via Taguchi's L25 array to assess the output responses i.e. material removal rate (MRR) and surface roughness (SR). It was observed that the material removal was significantly influenced with the change of wire feed rate at longer P-on (128 μs) and higher current (230 A). Lower wire feed rate (8 m min−1) and shorter P-off (51 μs) increased material removal more than that of higher wire feed rate (10 m min−1) with longer P-off (63 μs). Craters and globules of debris were viewed during all machining conditions on the machined surfaces. However, surface with maximum MRR (Trial 21, 59.021 mm3 min−1) depicts droplets of molten materials, micro-cracks and micro-voids compared to deep and wide craters on the surface with minimum MRR (Trial 5, 2.973 mm3 min−1) in SEM examination. The surface finish (1.301 μm) at lower value of P-on (112 μs) is always better than that at higher pulse-on-time (128 μs, 3.038 μm). Furthermore, the output responses were statistically investigated using analysis of variance (ANOVA) to evaluate the significant factors and contribution of each selected parameters.
Export citation and abstract BibTeX RIS
Introduction
Among α + β titanium alloys, Ti-6Al-4V (grade-5) due to superior corrosion resistance and higher strength-to-weight ratio with low density broadly preferred in the field of manufacturing, aerospace and as metallic biomaterial for orthopaedics implants [1, 2]. However, because of their low thermal conductivity and chemical reactivity with tool materials at elevated temperature, the machining of titanium alloys with the conventional machining techniques is quite a difficult task [3]. Therefore, advanced or non-traditional processes were extensively explored by the researchers to tackle the difficulty of handling titanium alloys by conventional machining processes [4–6].
Amid all of the non-traditional methods, wire electro discharge machining (WEDM) is a predominantly employed manufacturing technique for the machining of conductive workpieces with greater accuracy [7]. In this process, the sparks produced at successive interval of few micro-seconds generates heat between the workpiece and moving wire, causing the erosion of workpiece material due to the action of melting and evaporation [8–10]. This whole machining process is submerged and carried out in dielectric medium usually deionized water. The surface texture of WEDMed surface intensely affected by the thermal energy initiated, which leads to the surface roughness and changed surface morphology during the machining [11, 12]. Numerous machining parameters such as P-on, P-off, wire tension, wire speed, wire feed, current, coolant pressure, voltage, etc directly involves in the rate of material removal from the workpiece. Additionally, the generation of micro-cracks and craters during the machining action significantly influence the machined surface, thereby increasing the roughness [13, 14].
WEDM is frequently practiced by the researchers to analyze the quality and surface topography of machined surface by optimizing the material properties and input machining parameters [15–17]. Soni et al [18] studied the cutting rate (CR) and surface roughness (SR) of Ti50Ni49Co5 using wire electro spark machining. In their study, the cutting rate and surface roughness was directly influenced with the change in pulse-on-time. In addition, more cracks on the machined surface witnessed at higher surface roughness and cutting rate. Kumar et al [19] performed experimentation on titanium grade-2 and noticed that pulse-on and discharge current were the most dominant parameters affecting the WEDM process. The rate of high discharge energy results in the formation of deep and wide craters, cracks and debris globules on the machined surface. Similar findings of pulse-on effect on surface finish of D2 and H13 tool steel was also reported by Lee and Tai [20] using WEDM process. Goswami and Kumar [21] employed WEDM practice for the investigation of surface integrity and material removal rate for Nimonic 80 A alloy. They observed that recast layer directly influenced with the intensity of pulse-on and longer P-on causes thicker recast layer. Pulse-on-time and pulse-off-time were the prominent factors with contribution of 46% and 33% respectively affecting the MRR. Goyal [22] studied the MRR and SR of Inconel 625 machined by normal and cryogenic-treated zinc coated wire. Furthermore, analysis of variance (ANOVA) confirmed the significance of pulse-on, cryogenic treated electrode and discharge current as prominent WEDM parameters.
Previous studies [23–26] witnessed that heat treatment of titanium alloys contributed in its improved microhardness, static and fatigue properties along with the better quality of microstructures and surface finish. For instance, Zhou et al [27] inspected the porosity of cold spray coated Ti-6Al-4V by varying the heat treatment temperature between 600–1100 °C. They observed that with the increase in heat treatment temperature, the coating on substrate material tends to be denser. Similar research was carried out by Syed et al [28] to investigate the mechanical properties and porosity of heat treated titanium grade-5 at 920 °C and 1030 °C processed by EBM. Kiel-Jamrozik et al [29] discussed about the processing of Ti-6Al-4V alloy using SLM technique. They noticed that SLM produced thermal stresses, which are necessitate to alter using heat treatment to obtain alloys with better microstructure and mechanical properties. It had been also reported by wang et al [30] that heat treatment of titanium alloys proliferate bone-implant adhesion by the growth of stem cells more rapidly. The in-vitro cytocompatibility analysis revealed the significance of heat treatment to tailor the physiochemical properties. Microstructure and corrosion behavior of heat treated Ti-6Al-4V was explored by Xu et al [31] via direct metal laser sintering (DMLS) technique. Five different range temperatures i.e. 450 °C, 550 °C, 650 °C, 950 °C and 1050 °C were selected with air cooling and water quench as cooling mediums. It was noticed that specimen quenched in water with 1050 °C heat treatment temperature comes out with superior corrosion resistance. Different heat treatment processes was studied by Altug et al [32] to inspect the microstructure, conductivity of zinc-coated brass wire and microhardness of Ti-6Al-4V processed by WEDM. Amongst all heat treatments, they found that heat treated titanium alloy at 1050 °C for 1 h followed by water quenching results in the superior surface roughness.
By scrutiny of the previously published research, most of the work targeted around the WEDM of titanium alloys and investigating the optimum machining conditions from the selected machining parameters. While, the machinability of heat treated Ti-6Al-4V in wire electrical discharge machining was rarely reported. Heat treatment of titanium is a foremost process to improve the surface properties and hardness, favourable for numerous applications. Therefore, this paper address, the investigations performed on heat treated Ti-6Al-4V to inspect the influence of selected input parameters on output variables i.e. material removal rate and surface roughness processed by WEDM via taguchi array approach and statistically analyzed by ANOVA. Additionally, the surface morphology of machined specimens has been viewed via scanning electron microscope (SEM) technique.
Experimental work
Ti-6Al-4V procured from Baoji Fuyuantong Industry and Trade Co. Ltd, China was used as workpiece material with chemical composition of Al 5.75%; Fe 0.28%; C 0.08%; V 3.9%; O 0.03%; Ti 89.96% and in the semi-circular shape of diameter 40 mm and thickness 6 mm for the current experimental study. The specimens were initially heat treated (figure 1) at 1100 °C for 1 h followed by water quenching to increase its hardness prior to wire EDM. The temperature of the muffle furnace kept on 1100 °C for 30 min rising from room temperature (25 °C approx) before the placing of specimens.
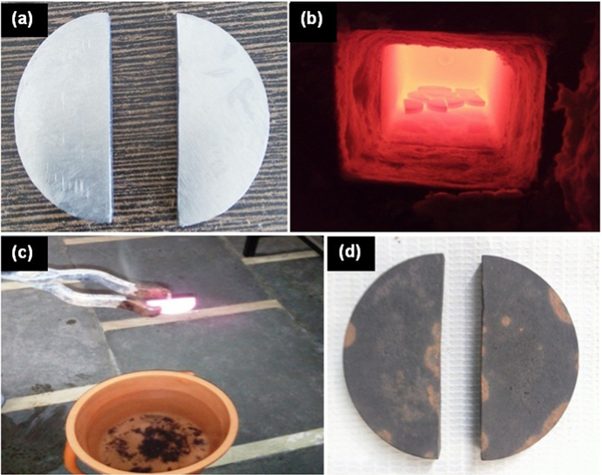
Figure 1. Schematic images of sample preparation (a) cutting of samples in semi-circular shape by hand hack-saw cutting, (b) heating of Ti-6Al-4V samples in muffle furnace, (c) quenching in water, (d) specimen prepared for WEDM.
Download figure:
Standard image High-resolution imageThe hardness of random heat treated specimens was checked using diamond indenter with an applied load of 150 kgf via ENKAY enterprises made Rockwell hardness tester in HRC scale and tabulated in table 1. Three readings were taken on each and an average value was considered, which comes out as 39 HRC whereas untreated specimen depicts 31 HRC. An overview representing the phasing of research work is shown in figure 2. The specimens were then considered for WEDM (Electronica, model ELPLUS 40A DLX) using brass wire of diameter 0.25 mm and having chemical composition as Cu 63.02%; Zn 36.85%; Pb 0.08%; Fe 0.05%. Brass wire is frequently used for industrial applications owing to their economical cost and tendency to withstand tensile stresses produced during the machining process. The diagrammatic view of wire electrical discharge machining process is shown in figure 3.
Table 1. Hardness of random samples.
| Random samples | Repetition 1 | Repetition 2 | Repetition 3 | Mean |
|---|---|---|---|---|
| 1 | 38.7 | 39.3 | 38.6 | 39.20 |
| 2 | 37.4 | 39.8 | 39.3 | 38.83 |
| 3 | 39.8 | 38.2 | 39.7 | 39.23 |
| 4 | 38.4 | 39.5 | 39.7 | 39.20 |
| 5 | 39.6 | 39.3 | 38.6 | 39.16 |

Figure 2. Flowchart of the work performed.
Download figure:
Standard image High-resolution image
Figure 3. Diagrammatic arrangement of WEDM.
Download figure:
Standard image High-resolution imageTaguchi's methodology of L25 orthogonal array was employed to design the experimental trials (DoE) for the current study. The most influencing WEDM parameters such as pulse-on-time (P-on), pulse-off-time (P-off), current, voltage and wire feed rate each with five levels were selected which are tabularized in table 2. Based on the selected input parameters, table 3 represents level combinations along with the actual values of machining parameters. Whereas wire electrode (brass); dielectric medium (De-ionized water); flushing pressure (10 bar); polarity (straight) and wire tension (10 kg-f) were kept constant during experimentation. The physical properties of workpiece and electrode are listed in table 4 and the characteristics of dielectric medium i.e. de-ionized water is demonstrate in table 5. To minimize the noise factor and for better output results, each experimental run was performed twice and an average of both the repetitions was recorded for the further analysis of signal-to-noise ratios and statistically validation through ANOVA.
Table 2. Machining parameters and their levels.
| Levels | ||||||
|---|---|---|---|---|---|---|
| Machining parameter | Units | 1 | 2 | 3 | 4 | 5 |
| P-on | μ-seconds | 112 | 116 | 120 | 124 | 128 |
| P-off | μ-seconds | 51 | 54 | 57 | 60 | 63 |
| Current | Ampere | 70 | 110 | 150 | 190 | 230 |
| Voltage | Volt | 10 | 30 | 50 | 70 | 90 |
| Wire feed rate | m min−1 | 6 | 7 | 8 | 9 | 10 |
Table 3. Taguchi L25 array based on the combinations input machining parameters.
| Levels of machining parameters | Actual values of machining parameters | |||||||||
|---|---|---|---|---|---|---|---|---|---|---|
| Exp. Run | P-on (μs) | P-off (μs) | Current (Amp.) | Voltage (V) | WFR (m min−1) | P-on (μs) | P-off (μs) | Current (Amp.) | Voltage (V) | WFR (m min−1) |
| 1. | 1 | 1 | 1 | 1 | 1 | 112 | 51 | 70 | 10 | 6 |
| 2. | 1 | 2 | 2 | 2 | 2 | 112 | 54 | 110 | 30 | 7 |
| 3. | 1 | 3 | 3 | 3 | 3 | 112 | 57 | 150 | 50 | 8 |
| 4. | 1 | 4 | 4 | 4 | 4 | 112 | 60 | 190 | 70 | 9 |
| 5. | 1 | 5 | 5 | 5 | 5 | 112 | 63 | 230 | 90 | 10 |
| 6. | 2 | 1 | 2 | 3 | 4 | 116 | 51 | 110 | 50 | 9 |
| 7. | 2 | 2 | 3 | 4 | 5 | 116 | 54 | 150 | 70 | 10 |
| 8. | 2 | 3 | 4 | 5 | 1 | 116 | 57 | 190 | 90 | 6 |
| 9. | 2 | 4 | 5 | 1 | 2 | 116 | 60 | 230 | 10 | 7 |
| 10. | 2 | 5 | 1 | 2 | 3 | 116 | 63 | 70 | 30 | 8 |
| 11. | 3 | 1 | 3 | 5 | 2 | 120 | 51 | 150 | 90 | 7 |
| 12. | 3 | 2 | 4 | 1 | 3 | 120 | 54 | 190 | 10 | 8 |
| 13. | 3 | 3 | 5 | 2 | 4 | 120 | 57 | 230 | 30 | 9 |
| 14. | 3 | 4 | 1 | 3 | 5 | 120 | 60 | 70 | 50 | 10 |
| 15. | 3 | 5 | 2 | 4 | 1 | 120 | 63 | 110 | 70 | 6 |
| 16. | 4 | 1 | 4 | 2 | 5 | 124 | 51 | 190 | 30 | 10 |
| 17. | 4 | 2 | 5 | 3 | 1 | 124 | 54 | 230 | 50 | 6 |
| 18. | 4 | 3 | 1 | 4 | 2 | 124 | 57 | 70 | 70 | 7 |
| 19. | 4 | 4 | 2 | 5 | 3 | 124 | 60 | 110 | 90 | 8 |
| 20. | 4 | 5 | 3 | 1 | 4 | 124 | 63 | 150 | 10 | 9 |
| 21. | 5 | 1 | 5 | 4 | 3 | 128 | 51 | 230 | 70 | 8 |
| 22. | 5 | 2 | 1 | 5 | 4 | 128 | 54 | 70 | 90 | 9 |
| 23. | 5 | 3 | 2 | 1 | 5 | 128 | 57 | 110 | 10 | 10 |
| 24. | 5 | 4 | 3 | 2 | 1 | 128 | 60 | 150 | 30 | 6 |
| 25. | 5 | 5 | 4 | 3 | 2 | 128 | 63 | 190 | 50 | 7 |
Table 4. Physical properties of workpiece and electrode material.
| Property | Ti-6Al-4V | Brass C27000 |
|---|---|---|
| Density (g cm−3) | 4.43 | 8.47 |
| Melting range (°C) | 1604–1660 | 905–930 |
| Thermal conductivity (W mK−1) | 6.70 | 116 |
| Specific heat (J/Kg °C) | 526.3 | 380 |
| Electrical resistivity (Ω cm) | 1.78 × 10⁻⁴ | 6.40 × 10⁻⁶ |
| Tensile strength (MPa) | 880 | 885 |
| Elastic modulus (GPa) | 114 | 105 |
Source: www.matweb.com.
Table 5. Dielectric characteristics of de-ionized water.
| Dielectric strength (MV m−1) | 65–70 |
| Thermal conductivity (W mK−1) | 0.579 |
| Heat capacity (J gK−1) | 4.18 |
| Dielectric constant | ∼80 |
| Dynamic viscosity (g ms−1) | 0.91 |
Material removal rate (MRR) and surface roughness (SR) were the output response parameters opted for the present study. The MRR of each experimental run was calculated by volume removed per unit machining time (VMMR) method using equation (1):-

A fixed volume of 150 mm3 was removed for all experimental trials in the form of a square block of thickness 6 mm (5 × 5 × 6 mm) and machining time for each was noted down. An average roughness value (Ra) of three measurements via Mitutoyo SJ-201 roughness tester was considered for the evaluation of surface quality of the machined surface. According to Taguchi-based methodology, the S/N ratios were calculated considering equations (2) and (3) with the approach of 'larger-is-better' for material removal rate and 'smaller-is-better' for surface roughness respectively. The feature with larger value represents superior machining performance, for instance material removal rate (MRR) whereas for better surface finish, roughness should be minimize and hence refereed under smaller-is-better criterion [33].


where n is the number of repetitions and yi is the response value at ith experimental trial.
Besides, the dominance of input factors affecting the output responses were determined using S/N ratios and analysis of variance (ANOVA). The contribution of each selected parameter was calculated based upon their p-value and F-value. Furthermore, SEM micrographs were captured using Joel made, JSM-6610LV scanning electron microscope at magnification level of 500× to analyze the changed surface of machined specimens.
Results and discussion
The detail description of output response observations and their measurements of both the repetitions in conjunction with the calculated values of S/N ratios for each experimental trial are summarized in table 6. A relative assessment of material removal rate and surface roughness of the specimens with respect to input parameters are unfolded in figures 4 and 5 respectively.
Table 6. Response observations values and signal-to-noise (S/N) ratios of MRR and SR.
| Output responses | S/N values, dB | |||||||
|---|---|---|---|---|---|---|---|---|
| MRR (mm3 min−1) | SR (μm) | |||||||
| Exp. Run | Rep 1 | Rep 2 | Mean MRR | Rep 1 | Rep 2 | Mean SR | MRR | SR |
| 1. | 17.246 | 15.438 | 16.342 | 1.811 | 1.521 | 1.666 | 24.2661 | −4.4335 |
| 2. | 13.783 | 10.979 | 12.381 | 1.062 | 1.902 | 1.482 | 21.8551 | −3.4170 |
| 3. | 6.407 | 9.257 | 7.832 | 1.413 | 1.360 | 1.387 | 17.8775 | −2.8415 |
| 4. | 4.283 | 4.776 | 4.530 | 1.036 | 1.565 | 1.301 | 13.1220 | −2.2855 |
| 5. | 3.851 | 2.094 | 2.973 | 1.831 | 1.267 | 1.549 | 9.4639 | −3.8010 |
| 6. | 9.108 | 10.433 | 9.771 | 1.824 | 2.789 | 2.307 | 19.7988 | −7.2610 |
| 7. | 5.086 | 3.989 | 4.538 | 1.888 | 1.523 | 1.706 | 13.1373 | −4.6396 |
| 8. | 30.867 | 23.696 | 27.282 | 2.102 | 1.692 | 1.897 | 28.7175 | −5.5613 |
| 9. | 21.054 | 19.723 | 20.389 | 1.886 | 1.704 | 1.795 | 26.1879 | −5.0813 |
| 10. | 7.969 | 4.472 | 6.221 | 2.041 | 1.113 | 1.577 | 15.8772 | −3.9566 |
| 11. | 31.567 | 42.134 | 36.851 | 2.875 | 2.030 | 2.453 | 31.3290 | −7.7940 |
| 12. | 29.127 | 28.434 | 28.781 | 2.009 | 2.081 | 2.045 | 29.1821 | −6.2139 |
| 13. | 18.812 | 21.391 | 20.102 | 2.239 | 2.684 | 2.462 | 26.0648 | −7.8258 |
| 14. | 1.721 | 5.924 | 3.823 | 1.467 | 2.497 | 1.982 | 11.6481 | −5.9420 |
| 15. | 28.168 | 28.869 | 28.519 | 2.285 | 2.084 | 2.185 | 29.1027 | −6.7890 |
| 16. | 20.857 | 14.121 | 17.489 | 2.567 | 3.066 | 2.817 | 24.8553 | −8.9957 |
| 17. | 31.012 | 41.011 | 36.012 | 1.956 | 2.639 | 2.298 | 31.1289 | −7.2270 |
| 18. | 18.308 | 17.128 | 17.718 | 2.178 | 2.317 | 2.248 | 24.9683 | −7.0359 |
| 19. | 19.864 | 21.959 | 20.912 | 2.659 | 2.424 | 2.542 | 26.4079 | −8.1035 |
| 20. | 16.353 | 15.071 | 15.712 | 2.850 | 3.172 | 3.011 | 23.9246 | −9.5742 |
| 21. | 58.952 | 59.090 | 59.021 | 2.696 | 2.565 | 2.631 | 35.4201 | −8.4024 |
| 22. | 10.038 | 8.300 | 9.169 | 1.626 | 1.939 | 1.783 | 19.2464 | −5.0230 |
| 23. | 8.035 | 8.549 | 8.292 | 3.326 | 2.750 | 3.038 | 18.3732 | −9.6517 |
| 24. | 28.785 | 29.519 | 29.152 | 2.139 | 2.095 | 2.117 | 29.2934 | −6.5144 |
| 25. | 49.794 | 41.069 | 45.432 | 2.333 | 1.872 | 2.103 | 33.1472 | −6.4568 |
Rep: repetition.

Figure 4. Main effects S/N ratios plot for material removal rate.
Download figure:
Standard image High-resolution image
Figure 5. Main effects S/N ratios plot for surface roughness.
Download figure:
Standard image High-resolution imageWEDM parametric influence on the MRR
During the WEDM of workpiece, material removal rate is a prominent output response to figure out the machining time. Note that, in main effect signal-to-noise (S/N) plot for MRR (figure 4), wire feed rate is most dominant factor affecting the MRR value. It was observed that the rate of material removal inversely proportional to the wire feed rate; i.e. with increase in the wire feed rate, material removal rate decreases. In addition, material removal steeply increases with increase in P-on time from 112 μs to 128 μs.
Amplified generation of spark conveyed more thermal energy to the workpiece generating high temperature which supports the material removal and hence MRR is increased [34, 35]. The S/N ratios plot in figure 4 also reveals the influence of current on MRR in a range of 70 A to 230 A. The erosion efficiency from the specimen's melt pool improves significantly at higher rate of spark energy produced. The ANOVA results demonstrated in table 7 illustrates the statically analyzed results of S/N ratios. Wire feed rate (contribution: 48.19%) leads the P-on (contribution: 29.01%) and current (contribution: 11.86%) in machining Ti-6Al-4V with brass wire under selected experimental conditions.
Table 7. ANOVA for S/N ratios of Material Removal Rate.
| Source | DF | Seq SS | Adj MS | F-value | p-value | % contribution |
|---|---|---|---|---|---|---|
| P-on | 4 | 350.73 | 87.682 | 13.81 | 0.013b | 29.01 |
| P-off | 4 | 98.50 | 24.624 | 3.88 | 0.109 | 8.15 |
| Current | 4 | 143.27 | 35.819 | 5.64 | 0.061b | 11.86 |
| Voltage | 4 | 8.33 | 2.083 | 0.33 | 0.847 | 0.69 |
| Wire feed rate | 4 | 582.60 | 145.649 | 22.94 | 0.005a | 48.19 |
| Residual Error | 4 | 25.39 | 6.348 | 2.10 | ||
| Total | 24 | 1208.82 | 100 |
WEDM parametric influence on the surface roughness
In WEDM process, the rate of spark energy and machining time (P-on) directly involves in the material removal due to the thermal energy produced. Consequently, the increase of P-on at higher intensity of applied current leads more thermal energy transmitted to the workpiece causing rapid cutting rate and thus, the formation of craters and cracks on the finished surface, thereby resulting in increased roughness [36, 37]. On the same grounds, the machined sample depicts higher surface finish (1.301 μm, Trial 4) at low P-on 112 μs. Likewise, at highest P-on value (128 μs, Trial 23), a higher surface roughness of 3.038 μm was witnessed. Wire feed rate had an insignificant effect on surface roughness. It can be observed from figure 5 that the surface roughness also revealed alike fashion with P-on i.e. increased with the rise in pulse-on. Similar findings were exhibited by statistical analysis (ANOVA) table 8, carried out to spot the noteworthy parameters influencing the roughness of machined specimens. P-on was most dominant factor (contribution: 70.49%) for the surface finish of WEDMed Ti-6Al-4V surface followed by P-off (contribution: 13.33%) and current (contribution: 8.47%).
Table 8. ANOVA for S/N ratios of Surface Roughness.
| Source | DF | Seq SS | Adj MS | F-value | p-value | % contribution |
|---|---|---|---|---|---|---|
| P-on | 4 | 71.884 | 17.9710 | 39.97 | 0.002a | 70.49 |
| P-off | 4 | 13.601 | 3.4004 | 7.56 | 0.038b | 13.33 |
| Current | 4 | 8.639 | 2.1597 | 4.80 | 0.079b | 8.47 |
| Voltage | 4 | 4.252 | 1.0631 | 2.36 | 0.212 | 4.17 |
| Wire feed rate | 4 | 1.791 | 0.4477 | 1.00 | 0.502 | 1.76 |
| Residual Error | 4 | 1.798 | 0.4496 | 1.78 | ||
| Total | 24 | 101.966 | 100 |
Figures 6(a)–(d) illustrates the morphology of the untreated Ti-6Al-4V surface, machined surface with minimum (Trial 5) and maximum (Trial 21) material removal rate. The untreated surface (figure 6(a)) emphasizes the presence of flakes and multiple scratches. SEM analysis of WEDMed surface portrays that higher amount of spark energy with longer P-on (figures 6(c), (d), Trial 21) illustrates more distorted surface texture compared to high spark energy with low P-on (figure 6(b), Trial 5). It is due to the reason that thermal energy generated for longer period (high P-on) produces intense heat, melts or vaporize the material more rapidly resulting in the formation of surface irregularities [38].

Figure 6. SEM images illustrating (a) untreated surface, (b) machined surface with minimum MRR (trial 5) and (c) surface for maximum MRR (trial 21) magnified in (d) showing micro-cracks.
Download figure:
Standard image High-resolution image
It should be noted that the cracks and size of the craters is affected by the amount of energy that is allowed to pass through each of the sparks. For the same reason, the surface with maximum value of MRR depicts the presence of evenly distributed craters (figure 6(c)) and micro-cracks (figure 6(d)). The SEM micrograph also discloses the presences of debris globules and droplets of molten metal on the finished or machined surface. In general, with the amplification of pulse duration and applied current, the density of cracks also increases more pronouncedly.
Conclusions
The WEDM practice has been investigated for heat treated Ti-6Al-4V with brass wire in the current experimentation. Longer P-on and lower wire feed rate exhibits superior MRR (59.021 mm3 min−1, Trial 21) than that at higher wire feed rate and shorter P-on (2.973 mm3 min−1, Trial 5) at the identical discharge current i.e. 230 A. It was observed that voltage is insignificant factor for the MRR. Notably, wire feed rate revealed as most dominant parameter for MRR with contribution of 48.19% followed by P-on 29.01% at 95% confidence level analyzed by ANOVA. While, P-on comes out most significant with 70.49% contribution in case of surface roughness and superior surface finish was witnessed in Trial 4 (1.301 μm). It was noticed that P-on has direct influence on surface roughness. Furthermore, the machined WEDMed surface at greater MRR (Trial 21) illustrate micro-cracks, micro-voids and droplets of molten material compared to the cracks, wide and deeper craters on the surface depicting lowest MRR (Trial 5) during the SEM investigation.
Finally, it can be concluded that WEDM is prominent technique to machine heat treated titanium alloys by further considering in different quenching mediums. Tungsten, molybdenum and coated wires can be explored as electrode for specified industrial or medical applications.