

Abstract
Over the last decade, acoustic methods, including acoustic emission (AE) and ultrasonic testing (UT), have been increasingly deployed for process diagnostics and health monitoring of electrochemical power devices, including batteries, fuel cells, and water electrolysers. These techniques are non-invasive, highly sensitive, and low-cost, providing a high level of spatial and temporal resolution and practicality. Their application in electrochemical devices is based on identifying changes in acoustic signals emitted from or propagated through materials as a result of physical, structural, and electrochemical changes within the material. These changes in acoustic signals are then correlated to critical processes and the health status of these devices. This review summarises progress in the use of acoustic methods for the process and health monitoring of major electrochemical energy conversion and storage devices. First, the fundamental principles of AE and UT are introduced, and then the application of these acoustic techniques to electrochemical power devices are discussed. Conclusions and perspectives on some of the key challenges and potential commercial and academic applications of the devices are highlighted. It is expected that, with further developments, acoustic techniques will form a key part of the suite of diagnostic techniques routinely used to monitor electrochemical devices across various processes, including fabrication, post-mortem examination and recycle decision support to aid the deployment of these devices in increasingly demanding applications.
Export citation and abstract BibTeX RIS

Original content from this work may be used under the terms of the Creative Commons Attribution 4.0 license. Any further distribution of this work must maintain attribution to the author(s) and the title of the work, journal citation and DOI.
1. Introduction
In the last few decades, extensive attention has been paid to weaning global energy production away from fossil fuels to address environmental sustainability and energy security concerns. This is evidenced by the increasing adoption of renewable energy sources (solar, wind, and tidal), with penetration projected to exceed 25% by 2030 [1]. Alongside this, global energy demands have substantially increased due to population growth, rapid industrialisation and urbanisation, particularly in developing and emerging economies [2, 3]. This combination of factors is driving the demand for highly efficient, scalable and economical technologies for energy production and storage with electrochemical devices including batteries, fuel cells, supercapacitors and electrolyser technologies delivering solutions and showing great promise [4]. These devices are well placed to form a significant component of a future low-carbon energy market, facilitating the use of intermittent renewable energy sources in sectors as diverse as grid-scale electricity distribution, transportation and portable consumer electronics [5–7].
Some of the most promising electrochemical energy conversion devices include lithium-ion batteries (LIBs) [8, 9], redox flow batteries (RFBs) [10, 11], polymer electrolyte membrane fuel cells (PEMFCs) [12, 13], solid oxide fuel cells (SOFCs) [14] and polymer electrolyte membrane water electrolysers (PEMWEs) [2, 15]. Each of these devices possesses unique benefits which favour different energy conversion and storage applications. LIBs, for instance, are among the most widely used rechargeable batteries with advantages including high voltage, long cycling life, and low self-discharge [16]. RFBs offer a relatively cheap energy storage solution with high energy efficiency, long cycle life, minimal safety issues and high scale-up flexibility [17]. Fuel cells offer a bridge between electric power generation and chemical energy storage and provide unique advantages in heavy-duty and long-range automotive applications [18–22]. PEMFCs, in particular, offer benefits including high energy density, modular design, low noise and vibrations, easy installation, and compatibility with dynamic load profiles [13, 18]. SOFCs have advantages such as high energy conversion efficiency, all-solid-state structure, increased fuel flexibility, and robustness to catalytic poisoning alongside the prospect of deployment in combined heat and power scenarios due to their high-quality exhaust heat and high power density [23, 24]. Similarly, in water electrolysis, PEMWEs offer a high current density of operation, compactness and ease of integration with renewable energy sources, crucial to the prospect of a renewable hydrogen economy [15, 25]. Taken together, this portfolio of devices is well suited for integration into energy production for domestic, industrial, automotive and consumer electronics applications.
To maximise the potential of these devices, further improvements are required to address performance, durability, and cost issues. For instance, current demands on LIBs include higher power and energy density and extending the operating cycling life of cells for first-life applications [16]. Additionally, due to the increased uptake of battery electric vehicles and hybrid-electric vehicles in which batteries are deployed as a high-value component, significant improvement is sought for the operando prediction of the state of health (SoH) and degradation [26, 27]. In RFBs, more accurate state of charge (SoC) estimation is of vital importance for better operational safety and performance as the extremes of SoC both degrade the system and cause dangerous gas formation [28]. In PEMFCs, a better understanding of degradation and water management is crucial to improve efficiency, reliability and durability for a broad range of applications [29–32]. In SOFCs, improving reliability and durability is contingent on improved mechanical properties related to thermal stresses induced by temperature gradients or differences in thermal expansion of components [33]. Moreover, wider deployment of PEMWEs depends on higher current density operation, which requires an improved understanding of mass transport alongside optimised component designs necessary for improved efficiency and cell performance [34, 35].
To aid development in these areas, several ex situ and in situ diagnostic techniques have been widely deployed for the fabrication, design, performance assessment and monitoring of electrochemical devices [15, 27, 36–41]. This range of techniques includes electrochemical, physical and optical spectroscopic tools and x-ray scattering, spectroscopy, and tomography techniques [42–45], AC impedance and voltammetry [46], transmission electron microscopy [47, 48], nuclear magnetic resonance [49], atomic force microscopy [50], and neutron [51] and optical imaging [35, 52]. Although these tools have collectively provided rich data for design and performance analysis of the various electrochemical power devices, they also have important limitations.
Recently, acoustic methods have emerged as a simple, low-cost, and non-invasive tool with huge promise for in situ and operando monitoring of the chemical, mechanical and structural processes in electrochemical power devices. The acoustic methods are divided into two primary forms, both of which are explored in this review. First is the acoustic emission (AE) technique, a passive monitoring tool which detects acoustic events generated within a material or device. The acoustic events occur spontaneously when the material or device is subjected to stress and typically arise from a physical change within the system such as crack generation, corrosion, oxide formation, gas evolution, electrode deformation or fluid motion (two-phase flow) [53]. The AE technique is not impacted by the nature of the stress and is therefore powerful for failure or degradation detection within a system. The ultrasonic testing (UT) technique, on the other hand, is an active technique in which an externally generated acoustic signal is introduced and propagated through the material to study the internal structure and processes. This technique enables interrogation of the condition of the system as acoustic wave propagation depends on an array of factors discussed later in this work. The fundamental distinction between these two acoustic forms is that the AE technique monitors the emission originating from the test material itself, whereas UT uses an externally generated signal to monitor the material response. That is, AE 'listens' for the energy released by the material or device, whereas UT actively probes the test material by supplying energy to it and monitoring the response [53].
This review first provides a brief description of the principle underlying each of the two basic forms; thereafter recent progress in the application of acoustic techniques to electrochemical power systems is highlighted. Finally, some of the key challenges of applying acoustic diagnostics to the various technologies are discussed, and promising future research directions and application areas are identified.
2. Principle and practice of acoustic methods
2.1. Acoustic emission
AE is a passive non-destructive technique whereby transient elastic waves are generated by the rapid release of energy from a localised source or sources within a solid material [54]. Under an external stimulus (for instance, change in pressure, strain, temperature or load), localised sources within the material trigger the release of energy in the form of stress waves ranging from audible (a few hertz) to ultrasonic frequencies in the megahertz range. These stress waves propagate to the surface and can be detected and converted to electrical signals using piezoelectric sensors [53, 55]. AEs can be detected at frequency ranges below 1 kHz and up to 100 MHz, although typically within the 1 kHz to 1 MHz range. With suitable equipment, vibrational displacement on the scale of picometers (10−12 m) can be detected in components [56].
There are four main modes of acoustic wave propagation: longitudinal (or compressional waves), transverse (or shear waves), Rayleigh waves (or surface waves), and Lamb waves (or plate waves) [57]. Acoustic waves are generally classified as body (or bulk) waves and surface (or guided) waves. Longitudinal and transverse waves are body waves because they propagate through the bulk material. Rayleigh waves and Lamb waves are surface or guided waves because they are propagated along the material surface and 'guided' by the geometric boundary of the material. When considering longitudinal waves, the vibration occurs in the direction of wave propagation, whereas transverse waves involve the vibration of particles at right angles to the direction of wave propagation. Rayleigh waves travel on the free boundary (surface) of elastic solids. They combine both longitudinal and transverse motion into elliptic vibrations the energy of which decays exponentially as the distance from the surface increases. Lamb waves are guided waves in thin plates (thickness of the order of magnitude of the acoustic wavelength) created by coupling between longitudinal and transverse waves reflected at the top and the bottom of the plate. Lamb waves can move the entire thickness of the plate and are dispersive due to being guided by the faces of the plates, and their propagation occurs in both symmetric and asymmetric modes [58].
AE has been widely used since the 1960s to detect anomalies such as leakages and cracks on large structures, including bridges, pressure containers, and pipelines transporting liquids under high pressure [59]. The technique is now being employed in many research and industrial applications as a powerful non-destructive evaluation tool for dynamic safety monitoring, early damage warning, and failure prevention of mechanical equipment and structures [60, 61]. AE signals have been used to characterise degradation mechanisms of various materials under chemical, mechanical or thermal stresses and have been used for diagnostics of a wide range of electrochemical phenomena, including anodisation [62, 63], corrosion [3, 64] and oxygen reduction [65].
2.1.1. Instrumentation
A typical AE monitoring setup is shown in figure 1, consisting of a sensor, preamplifier, filter and amplifier, alongside data acquisition and signal processing units. The microscopic mechanical perturbation caused by an AE event is captured by sensors mounted on the surface of the material, which converts the mechanical vibrations into an electrical signal. Piezoelectric sensors, specifically lead–zirconate–titanate transducers, are often used as electromechanical conversion devices as they provide a good combination of sensitivity, signal-to-noise ratio and dynamic range [66]. Alternative transduction methods, such as fibre-optic sensors, have also been demonstrated in recent times and may find use in speciality applications [67–69]. A couplant, typically a moderately viscous, nontoxic liquid, gel or pastes such as silicone grease, is usually necessary to provide sufficient acoustic contact between the sensor and the surface of the test object. The signal obtained at the sensor output often has low amplitude, requiring significant amplifications for ease of processing. Typical amplification gains in the order of 40–100 dB provide an optimal balance between events monitoring and noise exclusion [58]. Amplification is generally performed in two stages. Preamplifiers perform a first amplification and a low impedance matching of the acoustic signal. The preamplifier is often placed close to the transducer to minimise interference, with many current transducers having an integrated preamplification. Following preamplification, the signal is relayed to a bandpass or high-pass filter to eliminate low frequencies (background noise) and very high frequencies outside the practical frequency range of about 20 kHz to 1 MHz. The lower frequency limit is governed by background noise, and consequently is rarely reduced below 10–20 kHz, whereas the upper frequency limit is governed by wave attenuation, which is particularly significant in composite materials, and rarely exceeds 1 MHz [66]. The second amplification brings the signal to a sufficient amplitude for subsequent processing. The signal conditioning circuits then convert the analogue signal to a digital form, and then the acquired signal can be analysed and stored using computer software. Each mechanical phenomenon, i.e. source of an acoustic event, within the material leads to a transient acoustic wave which is then classified and analysed using several acoustic parameters.

Figure 1. Schematic of the hardware used in the acquisition of a typical acoustic emission (AE) signal.
Download figure:
Standard image High-resolution image2.1.2. Acoustic emission parameters
Figure 2 shows a typical AE waveform and the most common acoustic signal descriptors. Various factors contribute to the shape of the AE waveform, including the characteristics of the AE source, the wave propagation behaviour (i.e. wave modes, velocity, reflection, attenuation, and interference) and the AE sensor response. As acoustic waves propagate through the material of interest, the amplitude is reduced due to signal attenuation, which occurs through several basic mechanisms, including signal absorption, scattering, dispersion and beam spreading (divergence or geometric attenuation) [66].
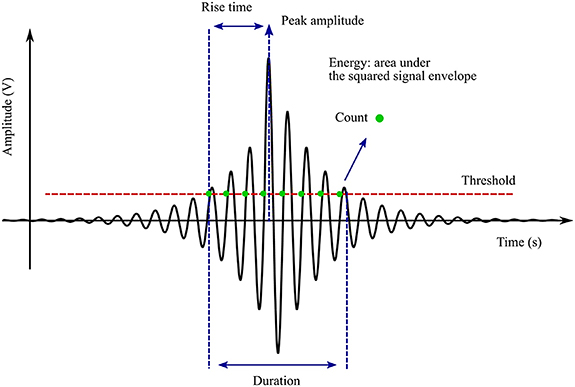
Figure 2. Typical AE signal obtained from a sample with the primary characteristics of the peaks including the rise time, peak amplitude and count described [70]. Reproduced from [70]. © IOP Publishing Ltd. All rights reserved.
Download figure:
Standard image High-resolution imageIn AE testing, a threshold level of waveform amplitude is often set to reduce noise interference and improve the signal-to-noise ratio. Once this has been performed, only acoustic events that exceed this predefined threshold are taken into account. The subsequent waveform obtained can be described through an understanding of several key parameters. The amplitude of the signal, one of the most informative signal descriptors, is described by the maximum (positive or negative waveform) AE signal excursion during an AE hit, expressed in decibels (dB). A typical AE signal (waveform) is represented as a voltage versus time curve, for which the voltage is converted to dB using equation (1), where A is the amplitude (dB),  is the voltage of the measured signal and Vref is the reference voltage, typically 1 μV. Generally, the decibel scale runs from 0 dB (100 μV) to 100 dB (10 V) [71]:

Further important descriptors include the rise time, i.e. the time between the first threshold crossing and the peak amplitude, the 'duration' or the time interval between first and last threshold crossing in the burst signal, 'counts' or the number of occasions that the waveform crosses the threshold in the increasing direction within the duration, and the energy of an event, typically in the order of attojoules (1 aJ = 10−18 J), defined as the integral of the square of the signal voltage over its duration. The peak frequency (Hz), corresponding to the highest magnitude in the frequency distribution obtained by methods such as from fast Fourier transform of the signal, can also be used to describe acoustic events [53]. Acoustic events are often released discontinuously in time; thus, another common representation is a plot of the cumulative number of 'hits' or the cumulative absolute energy (CAEE) against the time over which measurements were made. A high-gradient curve indicates periods of high acoustic activity, while a plateau indicates periods of low acoustic activity.
2.2. Ultrasonic testing
The UT technique is based on the principle that a high-frequency sound wave will travel through a given medium at a specific velocity, in a predictable direction, until they encounter a boundary with a different medium, where they will be reflected or transmitted. Thus, when ultrasonic waves encounter cracks, phase interface, voids or other discontinuities in a test object, a portion of the sound waves is reflected, and the remainder is transmitted, allowing real-time monitoring of material properties, internal damage, and structural integrity. UT is often performed at frequencies well above the audible range, typically in the megacycle range between 0.5 and 25 MHz [72].
As in AE, the transducer probe contains a piezoelectric crystal that generates ultrasonic pulses propagated into the test object. The main modes of the ultrasonic inspection may be classed into three: pulse-echo, pitch-catch, and through-transmission modes [73], and these basic configurations have been applied in various forms. Pulse-echo mode involves the use of single-element or multi-element sensors, which act first as emitters of ultrasonic pulses and then as receivers to detect echoes from defects or other discontinuities. Dual-element probes with separate transducers mounted in the same holder for transmission and reception have also been used. This configuration eliminates noise in the reflected pulse by avoiding overlap in oscillation from the generated ultrasonic pulse. Moreover, because pulse-echo detects the reflected waves, more structural information about the test material interfaces can be attained. The pulse-echo arrangement is illustrated in figure 3(a) for the case of no defect, a small defect and a larger defect. The pitch-catch configuration illustrated in figure 3(b) involves the use of two identical piezoelectric elements, often but not necessarily mounted in the same holder, with one element serving to emit ultrasonic pulses and the other to receive the reflected pulses. In this arrangement, the ultrasonic energy is transmitted at an angle to the surface of the test material and received as reflected energy at the reflected angle, and is used mainly for cylindrical tubes and other nonlinear parallel-sided surfaces. The through-transmission configuration, illustrated in figure 3(c), considered a variation of the pitch-catch mode, involves using two transducers located relative to each other on opposite sides of the test material such that one transducer receives the energy transmitted from the other after the energy has passed through a region of interest. Transmission gives average information about the entire material in the position of the transducer. Most commercial transducers are available from below 50 kHz to greater than 200 MHz. Lower frequency provides better wave penetration, whereas higher frequency gives better resolution and focal sharpness [73].
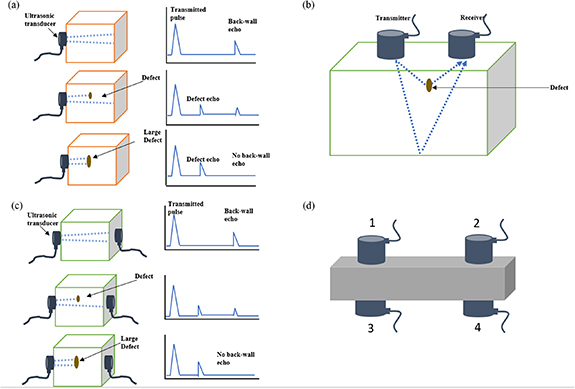
Figure 3. (a) Pulse-echo configuration and simplified screen display for test material without defect, small defect and larger defect. (b) Pitch-catch configuration with sound reflected to the receiver from a defect and back wall. (c) Transmission configuration and simplified screen display for test material without defect, small defect and larger defect. [73] [2011], reprinted by permission of the publisher (Taylor & Francis Ltd, http://www.tandfonline.com). (d) Placement of transducers in longitudinal, shear, surface or Lamb wave modes.
Download figure:
Standard image High-resolution imageThe ultrasonic display can provide information such as the relative thickness of the material, the depth into the material where flaws or discontinuities are located, and with proper scanning hardware and software, the location of flaws. A typical waveform display in a simple geometry is shown in figure 3(a). For the case of no defects, two pulses are typically displayed, the transmitted pulse and the back-wall echo. The introduction of a small defect reduces the amplitude of the transmitted pulse and is seen as an intermediate pulse. A large defect or void can block the transmitted signal, as shown in figure 3(a). For practical measurement using a UT signal (figure 3(d)), the arrangement of the probes on the test material is determined by the mode of wave propagation. For instance, the transmitter and receiver are located on opposite sides of the test material when the longitudinal mode is used (Sensors 1 and 3). When shear waves are used, the transmitter and receiver may be located on the same face of the test material (1 and 2) or on the opposite sides but at opposite ends of the test area (1 and 4 or 2 and 3). When surface waves or Lamb waves are used, the transducers are located on the same surface but at opposite ends of the test area (Sensors 1 and 2) [73].
2.2.1. Theory and implementation
A typical UT setup includes an ultrasonic pulser/receiver (transducers), hardware and software for signal capture and analysis, a waveform display, and a data logging module. To conduct the test, the piezoelectric transducer sends an ultrasonic pulse through the test object in one of the UT modes: pulse-echo, pitch-catch or through-transmission. As in AE testing, a couplant is necessary to maximise sound energy transfer across the transducer–test material interface. They help minimise the otherwise large acoustic impedance that would arise if the ultrasonic transducer is operated into the air, causing nearly 100% of the ultrasonic energy impinging on air/solid boundaries to be reflected. The three main coupling methods through which the ultrasonic energy is transmitted into the test object include: (a) direct contact between the transducer and the test piece with a liquid or grease couplant in between, (b) immersion of the transducer and the test object in a liquid bath and coupling through the intermediate liquid path, and (c) flooding a space separating the transducer and the test piece with a liquid (column or jet) [73].
The propagation velocity of the wave in a test material depends principally on the density and elastic properties of the material. The general equation for the ultrasonic wave velocity for a uniform elastic material is given by equation (2):
where ρ is the material density, and  is the material elastic constant and its directionality with respect to the wave type and direction of travel. Equation (2) may take various forms depending on the mode of wave propagation and the type of elastic constant used. Young's modulus
  and Poisson's ratio
  are the most commonly used elastic constants for determination of propagation velocity of longitudinal waves. For shear waves, the shear modulus G is commonly used. Thus, the velocities of longitudinal waves Vl and shear waves
 are described by equations (3) and (4), respectively [74–76]. In practical applications, shear waves travel at about half the speed of longitudinal waves:
At the interface between two dissimilar materials, a portion of the ultrasonic signal is transmitted through the interface, while the rest is reflected. The ratio of reflection to transmission is related to the relative acoustic impedance between the two materials. The bigger the acoustic impedance (Z) mismatch between two layers, the greater the reflection coefficient. The acoustic impedance (Z) of a material, defined as its resistance to the passage of sound energy, is calculated as a product of material density (ρ) and ultrasonic velocity 

The reflection coefficient  at a planar boundary is calculated as follows:
where  is the acoustic impedance of the first medium, and
  is the acoustic impedance of the second medium. From equation (6), the reflection coefficient decreases as the acoustic impedances of two materials become more similar, whereas dissimilar acoustic impedances lead to a higher reflection coefficient. In theory, the reflection from the boundary between two materials with the same acoustic impedance is zero, whereas, in the case of materials with disparate acoustic impedances, such as the boundary between steel and air, the reflection coefficient approaches 100%.
2.2.2. Ultrasonic testing parameters
The two fundamental parameters commonly used for UT analysis are the signal amplitude and the acoustic time-of-flight (ToF). The amplitude depicts the size of the reflected signal represented as the height, measured from the lowest to the highest point on a waveform display. Signal amplitude is only a relative measure as it depends on several factors, including the experimental setup, acoustic energy, gain, transducer placement and contact pressure between the transducer and sample. Changes in signal amplitude could occur for a number of reasons, illustrated in figure 4 [77]. Amplitude peak variation over a given ToF range (figure 4(a)) could occur due to a physical shift in the location of a flaw, discontinuity or interface towards or away from the transducer due to material expansion or contraction. This would result in a delayed signal or prolonged ToF. Second, a change in the peak amplitude at a given ToF (figure 4(b)) could be caused by a change in the physical properties of the materials at the interface leading to an increase or decrease in acoustic impedance mismatch at the interface. Finally, the complete loss of a peak (figure 4(c)) is indicative of the presence of a non-acoustically conductive layer, probably due to a severe defect, void, or loss of material component [77].
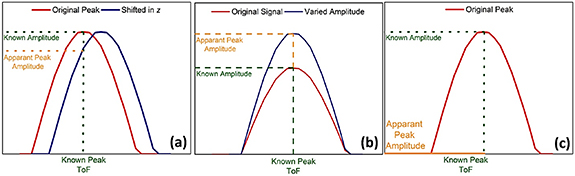
Figure 4. Typical amplitude variations in ultrasonic analysis including (a) amplitude shift due to shift in interface along the material thickness, (b) a measured increase in signal amplitude due to a higher acoustic impedance mismatch at a given interface and (c) the complete absence of the interface being measured due to the presence of a non-acoustically conductive layer [77]. Reproduced from [77]. © IOP Publishing Ltd. CC BY 3.0.
Download figure:
Standard image High-resolution imageThe ToF represents the time taken by the ultrasonic signal to reach the receiver or return to the transducer in the pulse-echo mode. The ToF thus represents the change of ultrasonic velocity and/or thickness [78]. The greater the ToF, the greater the distance between the emitter and receptor for a given material with a fixed  . The ToF is described by equation (7), where L is the path length travelled, E is Young's elastic modulus, and ρ is the material density. The square root of E/ρ is the speed of sound
  through a given medium:
In the case of pulse-echo measurements, the distance L will be twice the distance of the depth of the material di at which the reflection signal was generated:

From the ToF, the ToF shift can be derived. This shift occurs due to changes in the physical parameters of the sample and can be observed when the acoustic signal is compared to a reference signal (figure 4(a)). The relative intensities of the waveform can then be collated onto a heatmap or other three-dimensional plot to show the waveform shift over time. The ToF shift is usually obtained using a cross-correlation algorithm that matches the relative position of the initial waveform with each subsequent ToF to show how much the waveform has shifted. Therefore, a more drastic shift due to a significant physical change in a material will result in a greater ToF shift [79].
3. Application of acoustic methods for diagnostics of electrochemical devices
3.1. Acoustic diagnostics of batteries
A growing number of studies have applied the AE technique for diagnostics in battery applications. In batteries, the ion flow, electrode reactions and complex microstructures of the electrodes present many sources of AE. In LIBs, for instance, the cathode consists of polycrystalline particles of active materials, typically LiCoO2, LiFePO4 or LiNix Mny Coz O2, mixed with a binder and conductive carbon, which are made into a porous composite [80]. LIB anodes are typically formed from graphite, although more exotic materials have been reported to show benefits in a range of areas [5, 81, 82]. During LIB operation, Li+ ions migrate to and intercalate into and out of the crystallites making up the active particles, causing the materials to expand or contract. This volume change leads to stresses, cracks, and various stress-induced degradations that can be exhibited at different length scales [83–86]. Figure 5 shows the various degradation mechanisms that are often observed in operational LIBs.

Figure 5. Outline of the most common degradation mechanisms in LIBs highlighting the highly complex and interconnected nature of the degradation phenomena in a cell.
Download figure:
Standard image High-resolution imageThe failure and degradation pathways of LIBs are generally assigned to three causes: inherent factors, operational degradation and external causes. The inherent factors, which include solid electrolyte interface (SEI) formation, decomposition of the binder and degradation of the metal oxide components of the cell occur in all cells, with the extent of the degradation related (among other factors) to the age of the cells. External factors, including the physical penetration of batteries or the exposure of cells to excessively high or low temperatures, can result in severe degradation or even cell failure [77–82]. Finally, the operational causes of degradation may arise due to the design of the battery systems. High-power or compact high-energy cells can be subjected to conditions that result in swelling and cracking of the electrodes. Over time this can further manifest as a loss of Li inventory and electrode delamination [75, 76, 83]. Furthermore, the flux of lithium ions is a non-equilibrium process that can cause concentration gradients in the material leading to the development of stress and strain both inside the active material particles and in the surrounding composite matrix [87]. The AE technique thus provides a non-destructive tool for the detection of degradation originating from these mechanical and chemical processes. Gas evolution and the formation of cracks across multiple length scales can be investigated with the extent and form of mechanical damage quantified, allowing for process and health monitoring in batteries.
Based on the favourable mechanisms, the AE technique has been used in battery applications to identify mechanical damage in operando and evaluate the degradation of electrodes. Such work has been carried out on a range of battery chemistries, including metal hydride (MH) electrodes in Ni–MH batteries [88–90], MnO2-based electrodes [91, 92], Si-based electrodes [87, 93], NiSb2 electrodes [94] and the ubiquitous graphite-based electrode [95] in LIBs. In these studies, the cracking of the active material in the electrode and gas evolution have been identified as primary sources of AE signals. Each AE event is characterised using various parameters such as frequency, duration and cumulative energy (CE). Therefore, various events (phenomena) can be isolated and classified according to their characteristic peak frequency obtained from acoustic signal analysis. Gas evolution, which primarily occurs as a result of electrolyte degradation, has been observed typically between 80 kHz and 250 kHz, with mechanical cracking reported at higher frequencies typically ranging from 250 kHz to 400 kHz [88, 96].
The earliest study, conducted by Ohzuku et al [91], used the AE technique to investigate fractures in manganese dioxide cathodes used in Li/MnO2 batteries during charge and discharge cycles. The results showed an increased number of acoustic events at higher discharge currents. In contrast, no events were observed during charge, indicating that particle fracture occurs during lithium-ion insertion into the solid electrode matrix, with the rate of fracture proportional to the discharge current. In a subsequent study, Ohzuku et al [97] combined AE with a dilatometry technique (which measures thickness variation) to study the correlation between acoustic events and the expansion of graphite electrodes in the first lithium charge cycle, using two electrolyte formulations. They identified a correlation between the expansion observed in the solid graphite pellet and the acoustic events detected during the formation step, before the onset of irreversible capacity loss. Analysis of the power spectrum of the acoustic events indicated that the signal resulted from gas bubble formation. No significant acoustic events were identified during lithium intercalation, suggesting the initial events may be correlated to an initial SEI formation. Kircheva et al [95] used the AE technique to study SEI formation and the first lithium-ion intercalation on the surface and inside the graphite electrode. The authors reported a significant increase in the CE of the acoustic signal during SEI formation, alongside a positive correlation of the CE change with SEI film resistance.
The AE technique has also been employed to investigate degradation in high-capacity LIB electrodes. Matsuo et al [96] studied LIB degradation using a clustering method based on applying waveform polarity, power spectrum and enveloped waveform to identify various degradation mechanisms. The AE signals due to gas evolution in the battery were detected continuously over the charging and discharging caused by electrolyte decomposition on the graphite electrode surface during charge and discharge. In contrast, AE signals due to damage to the graphite were observed near the potential plateau, caused by surface film formation and phase transformation of graphite. Further, Villevieille et al [94] used the AE technique to monitor particle fracture in a conversion-type NiSb2 electrode material. The NiSb2 electrode was cycled in a Swagelok cell with a lithium foil used as a counter electrode, and the AE events were monitored over three cycles. The CAEE obtained was then correlated with the electrochemical activity. The result showed sudden jumps in CAEE at voltage plateaus corresponding to SEI formation and active material conversion (figure 6). Cracking of the NiSb2 particles was confirmed using scanning electron microscopy (SEM) which compared electrodes before cycling and after the first discharge.

Figure 6. CAEE and voltage profile of the first discharge of the NiSb2/Li cell vs time (h), cycled at a C/10 rate between 1.5 and 0.0 V. Left inset: SEM image of the starting NiSb2 powder. Right inset: NiSb2-based electrode after a full discharge [94]. Reprinted from [94], Copyright (2010), with permission from Elsevier.
Download figure:
Standard image High-resolution imageSilicon-based anodes, which offer the promise of increased capacity in LIBs, have also been investigated using AE techniques. When silicon is lithiated at room temperature, it can undergo a volume expansion in excess of 280%, which leads to extensive fracturing [98]. This is thought to be a primary cause of the accelerated capacity fade routinely observed [82]. A comprehensive understanding of material degradation in the anodes is necessary to identify processing and cycling techniques capable of reducing capacity fading and improving overall performance. Kalnaus et al [99] examined the fracture of silicon particles during cycling of Li-ion half-cells with silicon electrodes. The authors built a thermal analogy model, using a brittle fracture damage parameter to predict stress and damage accumulation numerically. By combining the computational and experimental results at various particle sizes, the results suggested a micrometre-scale 'critical fracture size' below which lithiation-induced fracture is not expected to occur. The work showed that the highest number of acoustic events was observed during the first discharge (figure 7(a)) followed by distinct hits on subsequent charge and discharge cycles, suggesting that most of the particle fracture occurs during the initial insertion of lithium ions. Rhodes et al [87] monitored the acoustic response of composite silicon electrodes cycled in lithium-ion half-cells. They showed that the major source of AE events is the surface fracture of the silicon particles, resulting from the alloying reaction with lithium that gives rise to Lix Si phases which mainly occur during the first lithiation. Distinct emission bursts were also observed on the subsequent charge and discharge step. Tranchot et al [93] also investigated the mechanical degradation of silicon-based electrodes for lithium-ion cells using the AE technique. Three distinct populations of acoustic signals (labelled type 1, 2 and 3 in figure 7(b)) were identified and found to result from electrode cracking accentuated by the formation of the c-Li15Si14 phase. Once again, the AE signal was primarily detected during the first lithiation as the electrode cracking mainly occurred during the first discharge. However, the AE activity increased at the end of the discharge when the c-Li15Si4 phase was formed and during the charge when the potential reached ∼0.45 V, corresponding to the delithiation of c-Li15Si4. Recently, Schiele et al [100] studied the gassing behaviour, volume expansion, and mechanical degradation of Si/C composite electrodes using the AE technique combined with mass spectrometry. They reported a strong variation of the rate of acoustic events with cell potential with most of the acoustic hits detected in the first cycle (figure 7(c)). Interestingly, they also reported a higher acoustic activity during delithiation than during lithiation in contrast to studies by Rhodes et al [87] and Tranchot et al [93] where the majority of the acoustic events were observed upon lithiation. Overall, the AE activity decreased with cycling, indicating that most of the mechanical degradation occurs in the first couple of cycles.

Figure 7. (a) AE data for electrochemical cycling of the silicon anode showing evolution of the acoustic signal (blue) over charge cycles. Reprinted with permission from [99], Copyright (2011), with permission from Elsevier. (b) Evolution of the electrode potential and acoustic activity of type 1, 2 and 3 signals during the first discharge in silicon anodes. Reprinted from [93], Copyright (2015), with permission from Elsevier. (c) Cell potential (blue) and AE hit rate (grey) during AE measurement on the silicon/carbon composite-containing electrode. The cell was assembled with the lithium metal and LP57 as the counter electrode and electrolyte, respectively. The region close to the lower cutoff potential is highlighted for clarity. Reprinted with permission from [100]. Copyright (2018) American Chemical Society. <https://pubs.acs.org/doi/full/10.1021/acsomega.8b02541>, further permission related to the material excerpted should be directed to the ACS. (d) Cell voltage (blue) and AE rate (red) measured during the first three cycles of a LiCoO2 sintered electrode. AE events are highly concentrated in the first charge cycle. Reproduced from [101] with permission of The Royal Society of Chemistry.
Download figure:
Standard image High-resolution imageSimilar results have been reported in other electrodes. Woodford et al [101] studied damage evolution in a LiCoO2 cathode using micromechanical models corroborated by in situ AE experiments. They attributed the fracture and mechanical degradation of polycrystalline lithium-storage materials to shape changes upon lithium (de)intercalation of the polycrystalline microstructure. Furthermore, the most pronounced AE bursts were observed in the middle of the first charge cycle with a smaller burst observed at the end of each discharge cycle (figure 7(d)). Inoue et al [90] used the AE technique to monitor the processes occurring at MmNi3.6Mn0.4Al0.3Co0.7 (Mm = mischmetal) alloy negative electrodes in situ. They reported two distinct classes of AE waveform: the first, which has a long duration, relatively narrow frequency distribution and lower maximum amplitude was attributed to hydrogen evolution; and a second burst-type waveform with shorter duration, wide frequency distribution and large amplitude was attributed to cracking of the alloy particles.
Similarly, Didier-Laurent et al [102] studied particle cracking during charge/discharge cycling of two MH alloy electrodes using the AE technique. Correlation of the acoustic activity with the electrode potential during charge/discharge showed four stages of acoustic activity (figure 8(a)): Stages I and IV of low acoustic activity at the start of charging and during discharge, respectively; and Stages II and III, where the acoustic activity increases progressively attributed to particle cracking and gas evolution, respectively. In both alloys studied, two distinct populations of acoustic signals were detected during charging steps (figure 8(b)). The first group (labelled P1) was characterised by high energy and short rise time, and higher peak frequencies between 230 and 260 kHz. The second group (labelled P2) showed lower energy, longer rise time and lower peak frequencies between 150 and 180 kHz. The first group of acoustic events were attributed to the cracking of the MH particles. In contrast, the second group with low characteristic energy was ascribed to the hydrogen evolution reaction. No acoustic activity was detected during discharge. In a follow-up study using both alloys, Etiemble et al [88] further investigated the evolution of the AE signals related to both the metal-hydride particle cracking and those due to hydrogen gas evolution as a function of the charge input in the two metal alloy electrodes. They reported more significant cracking phenomena in the LaNi5-based electrode (∼5–25 mA h g−1) than for the MgNi electrode (∼365 mA h g−1) at lower charge input, indicating different cracking mechanisms in the alloys. In a further study, Etiemble et al [89] studied the pulverisation of LaNi5-based electrodes with different Co contents by operando AE measurements and demonstrated that cracking of the electrode occurs mostly during the first charge.

Figure 8. (a) Typical evolution of the AE activity vs time recorded during a charge/discharge cycle on a LaNi5-based electrode. (b) Rise time vs signal energy recorded during charging at 100 mA g−1 on a LaNi5-based electrode. Reprinted from [102], Copyright (2008), with permission from Elsevier. (c) Voltage profile on cycling and AE activity in terms of counts (C) versus time recorded for (i) the first three cycles and for (ii) the last three cycles, from a total of 30 cycles. Reprinted from [92], Copyright (2013), with permission from Elsevier [93].
Download figure:
Standard image High-resolution imageTo gain a better understanding of mechanisms in the Li/S battery systems, Lemarié et al [59] investigated the mechanical degradation of sulphur-based electrodes during cycling using the AE technique. Comparing the AE response under various combinations of binders and current collectors showed prominence of the AE signals under three specific cases: firstly, during the first discharge, attributed to the initial dissolution of elemental sulphur into the electrolyte; secondly, at the end of charge where sulphur formed on the electrode surface; and a third cluster at the end of discharge when the cell was seen to polarise excessively attributed to an inefficient reformation of the sulphur electrode. Barai and Mukherjee [103] developed a computational methodology to study the acoustic response of microcrack formation in LiB electrodes. They reported the energy released due to electrode fracture as the primary source of AE response. Kircheva et al [92] used the AE technique for the ageing characterisation of a LiAl/LiMnO2 cell. They reported a decrease of acoustic activity with cell ageing (figures 8(c) and (d)), attributed to the degradation of active materials which do not entirely participate in the electrochemical reactions. The AE events were also found to be more pronounced during discharge attributed to phase transformation as well as intercalation of lithium ions.
Degradation in commercial cell formats has also been monitored using the AE technique [104]. A commercial 18650 battery and a model half-cell (Li/organic electrolyte/LiCoO2) were compared during charge and discharge cycling. In the commercial battery, AE events were detected during every discharging process at SoC of around 35% and 15%, attributed to the fracture of LiCoO2 particles by phase transition. In the model half-cell, AE events were found during initial cycles in the charging process due to the SEI formation; however, in the discharge process, this was only detected under high C-rates. Recently, Tang et al [105] studied the three-point bending failure process in a commercial 18650 lithium-ion cell using the AE technique. The resulting acoustic analysis showed three main types of damage produced by the three-point bending process, namely electrode delamination, interlayer slip, and electrode and separator cracking.
Whereas AE techniques can passively identify defects, particle cracking and gas evolution in cells, dynamic UT offers significant promise for process and health status monitoring in battery systems. The UT technique allows practical determination of processes and the internal state of batteries based on the fact that batteries are primarily composite material systems which undergo chemical and mechanical evolution, including variations in lithiation state, delamination, cracking, etc, during cycling and ageing. These chemical and structural changes lead to changes in material properties (mass densities and moduli) which in turn influences the ultrasonic impedances and ultrasonic velocity, allowing prediction of important cell parameters such as the SoC and SoH [79, 106]. The concept of the UT approach in battery diagnostics is illustrated for an example cell in figure 9.

Figure 9. Ultrasonic interrogation of a representative battery. (a) Schematic representation of a battery with the various packaging, current collector, electrode, and separator layers as well as the two acoustic transducers (pulse/listen and listen) for ultrasonic interrogation. (b) Example illustration of the increase in ToF of the transmitted signal as a function of SoC that occurs during discharge; this shift results from the changes in electrode densities as the SoC (i.e. lithium content, x) changes. Reproduced from [107] with permission of The Royal Society of Chemistry.
Download figure:
Standard image High-resolution imageStudies have shown that changes in the acoustic ToF of the ultrasound signal are linked to physical changes in the electrodes (density and modulus), which could be used to measure the SoC of batteries [107]. In Zn/MnO2 cells, changes in the acoustic waveforms from ultrasonic measurement have been shown to correlate with dehydration of the Zn gel anode, the formation of ZnO and physical transitions that occurs during discharge [108]. In a vanadium redox flow battery (VRFB), the ultrasonic velocity has been shown to correlate with changes of vanadium ion compositions in the positive electrolyte solution as the SoC of the VRFB varied, allowing for SoC prediction [109]. In LIBs, changes in acoustic ToF have been used to study SEI formation and capacity degradation [79], internal structure changes during charging [110, 111], anode and cathode structure during charge and discharge at high rates [75], and identification of macroscale defects in electrode layers [77, 112]. These studies highlight the potential deployment of acoustic imaging into in-line quality control monitoring systems for batteries, with the tool also having the promise of screening batteries before second-life deployment to ensure the safety of cells.
During battery cycling, electrochemical changes within the host intercalation materials result in mechanical property changes, which leads to shifts in the ToF of the ultrasonic signal. Several studies have shown that the SoC increase as lithiation proceeds during cell charging is detected as a decrease in the acoustic ToF [74, 75, 78, 107, 110, 113–116]. Hsieh et al [107] performed ultrasonic ToF analysis of a commercial LiCoO2/graphite pouch cell and suggested that during cell charging, the acoustic intensities (signal amplitudes) decrease slightly initially as the hexagonal-to-monoclinic phase transformation of the LiCoO2 is reversed, then increase steadily with an increase in the SoC. In the study, the ToF peaks were observed to shift towards lower values and higher intensities during charge. A consistent feature at >4 V cell potential at the end of charge was a slight increase in acoustic absorption, attributed to two-phase staging reaction of the LiCoO2 cathode which alters its density significantly. This finding was echoed by Davies et al [74], who showed that as the cell charges, the acoustic waveform shifts to a lower ToF seen as the wave moving upward during charge in the top image of figure 10(a). Ladpli et al [113] attributed the decrease in ToF during cell charging to faster wave speed with increasing SoC which leads to increased modulus and/or declining stiffness, in agreement with results from the literature which show that the density of the graphite anode [117] and cathode [118] decreases and the modulus increases [84] during charging. The authors further demonstrated that the signal amplitude intensifies with increasing SoC except at the beginning and end of charging. Other studies by Glanz et al [116], Robinson et al [75, 110], and Wu et al [78] have demonstrated a general decrease in the acoustic ToF during cell charge.

Figure 10. (a) Representative ultrasonic signal during cycling for several cycles of a lithium–cobalt oxide pouch cell at a C/20 charge/discharge rate. The ToF heat map shows maximum and minimum waveform amplitudes in red and blue, respectively. (b) Same ultrasonic data reduced to a ToF and amplitude metric. The blue and red lines represent the single ToF shift and amplitude measures, respectively. Reproduced from [74]. © IOP Publishing Ltd. CC BY 3.0.
Download figure:
Standard image High-resolution imageDuring cell discharging, Hsieh et al [107] showed that acoustic absorption increases (i.e. the transmitted and reflected intensities decrease) except at the end of discharge at a cell potential <3.5 V, where the signal intensities increased dramatically, attributed to the hexagonal-to-monoclinic phase transformation of the LiCoO2 which alters the modulus and density of the cathode. The ToF peaks also shift towards higher values and lower intensities during discharge. Davies et al [74] also showed a shift to higher ToF as the cell discharges (figure 10(a)). The result showed a notable drop off in amplitude below ∼25% of SoC, followed by a spike in amplitude at the bottom of charge. The significant and rapid change in the ToF shift and signal amplitude at the bottom of charge was suggested to indicate structural changes at this level of discharge and sign of over-discharge of the cell. Similarly, Ladpli et al [113] showed that the ToF increases and the signal amplitude decreases during discharging. Studies by Robinson et al [75] and Wu et al [78] have further confirmed that the acoustic ToF increased and the signal amplitude decreased uniformly during cell discharge until the end of discharge. Generally, as the battery discharges, lithium de-intercalates from the anode and intercalates into the cathode, which decreases the elastic moduli for the electrodes, which, according to equation (7), will reduce the ultrasonic velocity and cause an increase in ToF during the discharging process.
In general, cycling behaviour as studied by Hsieh et al [107], Davies et al [74], Ladpli et al [114], Robinson et al [75] and Knehr et al [119] shows clear and repeatable trends in the ultrasonic waveforms, which vary periodically, synchronised with the electrochemical cycling (figure 10). Abrupt changes in signal amplitude or ToF often near the end of charge or discharge has been attributed to the scarcity and excess of lithium ions respectively, causing abrupt stiffness changes [107]. Moreover, the general trend was a decrease in ToF of the ultrasonic signal with increasing cycles as well as fading of the signal amplitude across cycles. This is important as it allows SoC prediction based solely on ultrasonic analysis and highlights the potential of the technique to provide information about the SoH of the cell over an extended period. Model predictions of SoC and SoH in these studies have reported SoC prediction to within ∼3.5% [111], and ∼1% accuracy [74] for both lithium cobalt oxide and lithium iron phosphate cells, and SoH to within an error of ∼1% [74].
Cycle rates, commonly expressed as a C-rate, indicates the theoretical number of hours needed to charge or discharge a cell completely. For example, a rate of 1C corresponds to a complete charge or discharge in 1 h, and a rate of C/20 would indicate a theoretically complete charge or discharge in 20 h. Studies have shown that ToF responses differ at different C-rates, as changes in C-rates could lead to changes in the mechanical behaviour of the cell as the electrochemically induced stresses and strains in the battery electrodes are expected to become more significant during high-rate charging and discharging [75]. Popp et al [116] reported longer ToFs at higher C-rates and a pronounced local minimum in the ToF at low C-rates (figure 11(a)) attributed to inhomogeneous lithium distribution within the electrodes. A similar result by Robinson et al [75] showed an increase in the slope of the ToF shift at higher C-rates (figure 11(b)), attributed to the higher electrochemical stiffness (a measure of the electrochemically induced change in Young's modulus) observed under these conditions, also reported by Tavassol et al [120]. The authors also observed an initial decrease in the ToF peak locations at all C-rates, followed by an increase in the ToF during the discharging phase.

Figure 11. (a) ToF for charge (ch) and discharge (dch) at different C-rates. © [2019] IEEE. Reprinted, with permission, from [116]. (b) Top: electrochemical response for 1C charge, 2C discharge and 1C charge, 4C discharge cycles. Middle: acoustic signal response for (b) 1C charge, 2C discharge and bottom: 1C charge, 4C discharge cycles. The acoustic ToF spectra show the acoustic amplitude (measured in AU) and acoustic ToF response of the acoustic measurements during the full discharge cycles and periods during which the cell is allowed to maintain an open circuit potential. Reprinted from [75], Copyright (2019), with permission from Elsevier.
Download figure:
Standard image High-resolution imageUltrasonic characteristics during prolonged cell cycling have been investigated using the two main ultrasonic parameters, namely signal amplitude and ToF [78, 107, 114, 121]. Ladpli et al [113] demonstrated that ToF shifts towards a lower value, i.e. slower wave speed, with increasing cycle number, with the shift more notable towards the end of discharge and at the beginning of charge (figure 12(b)). The decline in ToF was seen to be more dramatic during the first 100 cycles than during the later 100 cycles. On the other hand, the signal amplitude gradually intensifies at all SoC as the cycle count increases (figure 12(c)). The amplification in the signal amplitude was shown to be less dramatic at the end of discharge and beginning of charge than elsewhere. The change in ToF and signal amplitude was ascribed to moduli and density changes due to battery degradation. Lower ToF and higher signal amplitude suggests that ageing might increase the battery's overall stiffness and/or lower density. On the other hand, Sood et al [121] reported that the amplitude of the input ultrasonic pulse is weakened as the cell is cycled, attributed to the degradation of interfaces inside the cell caused by electrode expansion, gas evolution, or stress developing along the interfaces. Similarly, Wu et al [78] showed that the ToF increases as the battery degrades and that the signal amplitude generally increases and then decreases after long cycling, attributed to possible gas generation inside the battery [21]. Gas exhibits significantly higher attenuation than liquids or solids as it is inferior at transmitting ultrasonic signals. Thus, gas generation is seen as a reduction in acoustic intensity or loss of reflected signal during ToF analysis.

Figure 12. Cycle-to-cycle evolution of (a) cell voltage (b) ToF, and (c) signal amplitude, due to electrochemical ageing shown in progressive shades of grey as a function of cycle elapsed time. Data from the first cycle is indicated in green, the 100th cycle in yellow, and the 200th cycle in red. Reproduced with permission from [113].
Download figure:
Standard image High-resolution imageFor greater reliability and, hence, increased battery technology adoption, the development of diagnostics for better monitoring of battery health and early prediction of failure is a key requirement. Various studies have used the UT technique for the investigation of acoustic behaviour during cell failure. Davies et al [74] demonstrated significant shifts in the ultrasonic signals during cell failure, as well as a decrease in the signal amplitude. The ultrasonic signal amplitude faded significantly following failure once the cell passed the bottom of charge, attributed to electrolyte breakdown and cell gassing. Wu et al [78] performed an overcharge-induced battery failure where voltage (up to 5 V) was forced onto a 1.8 Ah battery after prolonged cycling to investigate the ultrasonic signal behaviour under a severe abusive condition. Figure 13(a) shows the top view of the battery before and after overcharge. Figure 13(b) shows the x-ray images (the side view) of the battery. The ultrasonic features during the overcharge test are shown in figures 13(c) and (d). As seen in figure 13(c), the ToF shifts towards a lower value before 2.5 h, in agreement with behaviour often observed during charging. The ToF then begins to increase sharply after 2.8 h and about 4.7 V, attributed to gas generation inside the battery as well as the increase in thickness of the battery layers. A sharp rise in peak amplitude was also observed as the cell overcharged (figure 13(d)). Pham et al [122] also investigated electrode delamination and gas formation in LIBs during thermal abuse on 210 mAh commercial lithium-ion pouch cells using a range of techniques including ultrasonic ToF analysis, fractional thermal runaway calorimetry and synchrotron x-ray imaging. During the gradual thermal abuse, a trend of delayed ToF of the ultrasonic wave was observed during the onset of heating at ca. 6 min 20 s into the test, as shown in figure 14(a). This was attributed to decreased density with increasing temperature and, therefore, lower ultrasonic wave propagation. A slower propagation of thermal runaway and a less catastrophic failure was seen to lead to a more gradual ToF shift and a slower loss of acoustic signal, as seen in figure 14(b). However, slower thermal runaway propagation led to prolonged gas generation and therefore longer time (ca. 11–16.5 min) during which the ultrasonic signal was lost. Zappen et al [123] used the ultrasonic technique to study high-temperature abuse on a nickel–manganese–cobalt oxide/graphite LIB cell. The results showed the responsiveness of the ultrasonic measurements to safety-critical degradation effects which happen during exposure to high temperatures. As ultrasonic signals vary distinctively with varying temperature, this technique helps capture phenomena occurring at different temperature ranges, such as SEI dissolution and evaporation of the solvent, among others, that have been welldocumented in the literature.

Figure 13. Overcharge test results for battery: (a) photos of the battery (top view), (b) x-ray CT images of the battery (side view), (c) evolution of ToF, and (d) evolution of the first echo peak amplitude. Reproduced from [78]. CC BY 4.0.
Download figure:
Standard image High-resolution image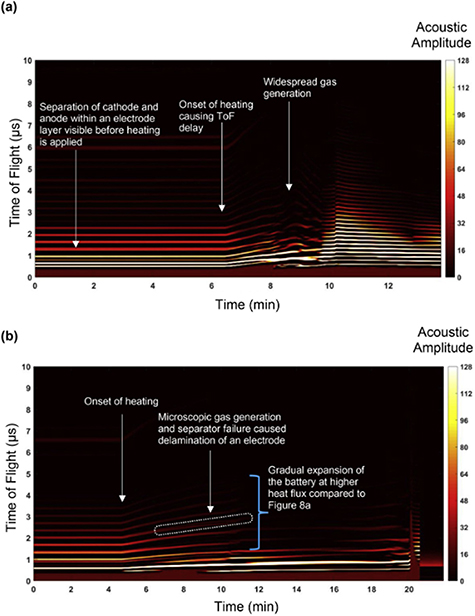
Figure 14. (a) ToF spectrogram of a 210 mAh commercial pouch cell during the first failure test, with highlighted regions of interest during induced thermal runaway. The onset of heating occurs at approximately 6 min 20 s into the test. (b) ToF spectrogram of a 210 mAh commercial pouch cell with highlighted regions of interest during thermal runaway. The onset of thermal runaway occurs at approximately 4 min 20 s into the test with the main features of interest identified. The acoustic amplitude is displayed in arbitrary units. Reprinted from [122], Copyright (2020), with permission from Elsevier.
Download figure:
Standard image High-resolution imageLIBs are expected to cycle in environments with wide temperature variations. This is an essential consideration in building battery management systems for mobile or outdoor stationary applications where temperature extremes are expected. From an acoustic viewpoint, warmer temperatures would lead to changes in the Young's modulus of materials within the battery and, therefore, in the sound propagation speed. Studies have investigated acoustic behaviour as a result of temperature change within the cell. Robinson et al [75] demonstrated that an increase in temperature from 25 °C to 30 °C showed only slight changes in the acoustic intensity attributed to slight variations in Young's modulus, with no significant change in the ToF, unsurprising given the relatively small temperature change. More recently, Chang et al [124] investigated LiCoO2/graphite LIBs over a wider temperature range from a 0 °C–60 °C environment during cycling (figure 15) and demonstrated through UT analysis that LiCoO2/graphite LIBs experience catastrophic failure when moved across this temperature range during cycling. This is based on the existing understanding that lithium plating of the graphite anode occurs below 10 °C at typical 1C charge rates and that LiPF6 electrolyte decomposition begins to occur at 60 °C and higher [125]. In addition to noticeable physical bulging of the pouch cell, ultrasonic signals transmitted through the battery provide evidence of when gassing occurs, as the ultrasonic waves are dramatically attenuated in the presence of a gaseous medium due to a high acoustic impedance mismatch. In all cases, as seen in figure 15, the initial temperature shift, shown by the first dotted line, results in a corresponding shift of the acoustic waveforms due to temperature effects on sound transmission. Subsequently, acoustic signal loss was observed for all temperature shifts. Similarly, Bommier et al [126] explored the use of the UT technique for gassing and lithium plating detection at lower temperatures. The results showed that the period of visible gassing and swelling correlated well with permanent attenuation of the acoustic signal.

Figure 15. Acoustic and electrochemical data of 210 mA h pouch cells initially cycled at a cold (<10 °C) temperature to induce plating, before the environmental temperature was shifted higher to (a) 20 °C, (b) 30 °C, (c) 40 °C, (d) 50 °C, and (e) 60 °C while keeping the cell at open circuit potential and bottom of charge. For each condition, plots are shown for the heatmap of the acoustic waveforms superimposed over time on the x-axis (the acoustic ToF), the total amplitude vs time, the voltage/current profiles, and the environmental temperature in the incubator as measured by a thermistor. The dotted lines indicate the time range starting from the temperature shift until loss of signal was observed. Reproduced from [124]. CC BY 4.0.
Download figure:
Standard image High-resolution image3.2. Acoustic diagnostics of RFBs
In RFBs, external electrolyte tanks containing two soluble redox couple are pumped through flow-through electrodes contained within a stack and separated by an ionic conducting membrane. In this set-up, the SoC, determined by the concentration of the electroactive ion in each solution, is a critical indicator of battery health. Thus, SoC estimation is of vital importance for long-term, safe operation. Direct measurement of these concentrations online during cell operation is challenging. Currently, one of the most common approaches for SoC estimation relies on the measurement of the open circuit voltage (OCV). Although this technique is fast and easy, it gives only an indication of the SoC of the system and no information on the individual electrolyte solutions. However, degradation mechanisms in RFBs can often be asymmetric, affecting one of the electrolyte solutions disproportionately, thus creating a capacity imbalance between the catholyte and anolyte [109]. Therefore, accurate and reliable methods for monitoring the individual SoC of each electrode is highly desirable.
As initial studies have shown, UT provides a promising solution for monitoring the individual SoC of the positive and negative electrolyte solutions. The large changes in solution viscosity with the electrochemical conversion of the species in each electrolyte solution mean that there are significant changes in the speed at which sound will travel through the solution. The first such study by Chou et al [109] used the UT technique to monitor the SoC of vanadium RFBs. Using a through-transmission set-up, the authors showed an increase in the SoC of the VRFB correlated to an increase in the ToF of the ultrasonic signal. However, due to the close relationship between the properties of a solution and the temperature, temperature could significantly impact the ultrasonic velocity. Thus, the authors demonstrated that the temperature effect could be compensated for, but as a result, the electrolyte temperature would require constant monitoring for this technique to be effective. Zang et al demonstrated in a follow-up study that the acoustic attenuation coefficient is a more robust parameter for SoC monitoring. By monitoring the acoustic attenuation coefficient rather than the wave velocity, the influence of temperature could be significantly reduced and could practically be considered negligible for the typical 20 °C–39 °C temperature range at which VRFBs operate [127]. They showed that for the parameters used in the study, the acoustic coefficient is most influenced by molecular relaxation processes that are dependent on the ratio and concentration of different redox ions present in the electrolyte. They also reported operando testing of ultrasonic SoC monitoring. They found good agreement between the acoustic measurements and the chemical titration and inductively coupled plasma analysis with a maximum reported deviation of 4.8%.
3.3. Acoustic characterisation of fuel cells
For more reliable and high-performance PEM fuel cells and broader adoption, one major technical challenge that must be surmounted is the water management within the cell [128]. A minimum amount of water is essential to keep the PEM well hydrated for good ionic conductivity. However, too much water causes flooding in the cell, where the pores in the electrodes are filled with water, and the transport of reactant gases to the catalyst site is obstructed [129]. Therefore, improving or optimising water management during cell operation is crucial and has attracted significant interest [22, 32, 130, 131].
Several techniques [37] have been employed to estimate the amount of water contained in the membrane. However, real-time non-invasive diagnosis remains an imperative objective, and the acoustic technique has been shown to have the potential to fill this gap. The Nafion membrane structure depends on its water content [132], and thus its evolution gives rise to considerable structural changes. The cyclic stress and dimensional change induced by water uptake can be substantial and are the leading causes of the mechanical degradation of the membrane [133], which can trigger AE events.
Thus the AE technique has been applied for PEMFC diagnostics, including the water uptake of the Nafion membrane, the impact of water content on the dimensional changes occurring in a membrane [31, 134], and performance diagnosis of a PEMFC under various operating conditions [29, 130]. Legros et al [29, 31, 134] were the first to apply the AE technique through a series of studies for water management diagnostics in PEMFCs. In their earliest study [134], they investigated the AE activity of a Nafion membrane under dehydration in a climatic chamber. The results demonstrated that the structural changes occurring in the membrane during drying trigger AE events that can be sensed by an appropriate sensor. They further demonstrated a relationship between the ionic conductivity of the membrane and the AE activity of the PEMFC. They reported that the AE technique is more sensitive to the membrane dehydration process than electrochemical impedance spectroscopy. In a subsequent study [29], the authors employed the AE technique to investigate PEMFC under various operating conditions, such as with the membrane electrode assembly (MEA) at open circuit and under load, and for a cell without MEA. AE events from various sources within the cell were identified, and a strong correlation between the AE hits and the various physicochemical phenomena taking place during cell operation was detected. They showed that the hydrodynamics in the flow-field channels, water uptake and release by the MEA, and electrochemical reactions could contribute to AE from the cell. Subsequently, Bethapudi et al [30] used the AE technique to explore fuel cell operation over a range of current densities, reactant relative humidity (RH) and cell operating temperature. The acoustic events were measured as CAEE of the acoustic hits generated at discrete points of fuel cell polarisation. As shown in figure 16, strong correlation between the PEMFC and acoustic activity were observed over the various operating conditions. The AE technique identified various features such as membrane dehydration, liquid water formation and the transition from wet channels to dry channels during operation. In a follow-up study, Bethapudi et al [130] used the AE technique to evaluate hydration conditions inside PEMFCs equipped with fractal flow fields. The occurrence of flooding in the cell was shown to correspond to higher acoustic activity, further corroborated by other techniques such as polarisation curves and impedance spectroscopy.

Figure 16. Correlation of PEMFC performance with acoustic activity. Top row: polarisation curve at 40%, 70% and 100% reactant RH, at 45 °C and 60 °C cell temperature respectively. Bottom row: corresponding acoustic emission CAEE at the various operating conditions. Reprinted from [30], Copyright (2019), with permission from Elsevier.
Download figure:
Standard image High-resolution imageIn SOFCs, the high temperatures and reductive/oxidative environment subject the materials to significant stresses resulting in material fracturing and cracking. This mechanical stability and reliability is a critical issue for wider deployment, and the AE is ideally suited to detecting these failure mechanisms. Several studies have also used the AE technique for diagnostics of SOFCs. Bodhayan et al [135] used the AE for compression testing to examine the formation of damage in SOFCs. Malzbender and Steinbrech [136] used the AE technique to monitor thermal and re-oxidation cycling to provide valuable information on mechanical stack failure mechanisms and showed AE to be a powerful tool for assessing localisation of damage. Sato et al [137, 138] subjected a SOFC to simulated operating conditions with operando AE monitoring. They detected damage occurring within the cell, with most acoustic hits detected in the two heating periods where chemical expansion-induced stresses were highest. Three distinct types of acoustic hits were identified based on their time lag, frequency and waveform attributed to vertical cracking and delamination in the cathode and vertical cracking in the electrolyte. Fukui et al developed an artificial neural network model to produce cluster maps of acoustic events, revealing six phases of damage progress. Komagata et al [104] expanded on this work in a later study, using the AE technique to monitor mechanical damage and deformation in a SOFC stack rather than a single cell. In addition to the mechanical damage occurring in the electrodes and electrolyte, additional hits due to the deformation of the stack and the friction or delamination in the power collector were also observed. Recently, Rangel-Hernandez et al [139] used the AE technique to monitor the fracture process in the glass–ceramic material often used as a sealant in SOFCs. They demonstrated the ability of AE to track the mechanical degradation of the material and ascribed acoustic hits for the debonding and pull out of fibres within the structure as well as the microscopic fracture of the fibres and materials found within the composite. Kumada et al [140] distinguished between the AE hits received as the seal cracked and damage occurring within the cell as it operated. They studied the electrochemical oxidation of the anode and found that while no hits were detected for the cell operating under normal conditions under an H2 cutoff test, vertical cracking and delamination in the cell could be detected. While we did not identify any reports of the use of ToF acoustic methods on SOFC, the technique would potentially identify the formation of cracks and delamination of the anode/cathode layers, which can occur during start-up and shutdown. In addition, the use of ToF tools will likely result in increased signal sensitivity and reliability over AE techniques due to the noise imparted by the furnaces and balance-of-plant required to operate SOFCs at elevated temperatures.
3.4. Acoustics diagnostics in PEMWEs
In water electrolysis, degradation and two-phase water–gas management in PEMWEs are suited to non-invasive diagnostics using acoustic methods. The earliest study by Crowther et al [141] used the AE technique to monitor gas evolution at the electrodes in an alkaline electrolyser. The authors reported an increase in AE intensity with increasing gas bubble emission. More recently, Maier et al [142] used the AE technique to characterise the two-phase flow conditions in a single-channel PEMWE cell between 0.0 A cm−2 and 2.0 A cm−2. During operation, the number of acoustic hits was shown to reach a maximum around 0.5 A cm−2 before decreasing to a plateau at higher current densities linked to the number of gas bubbles passing the sensor in the flow channel. The average frequency of the hits also decreased with current density, attributed to an increase in average bubble size which was confirmed by extracting the average bubble size from high-speed optical imaging. The study showed strong correlations between the water flow rates, current density and acoustic parameters, indicating that the AE technique can be used to detect the transitions from bubbly to slug flow in PEMWEs. Maier et al [143] further combined the AE technique with high-speed imaging to diagnose the blockage of flow channels in PEMWEs with stagnant gas bubbles, reporting sudden step-like changes in the number of acoustic parameters attributed to the growth of stagnant bubbles towards the AE sensor. The authors also applied the UT technique to investigate the water–gas distribution in the flow-fields and liquid–gas diffusion layers (LGDLs) of a PEMWE during operation (figure 17) [144]. The ultrasonic acoustic response showed a close correlation between the acoustic attenuation in the flow field and the production and removal of oxygen gas through the flow channel and between the acoustic response and water thickness in the LGDL.

Figure 17. (a) Ultrasonic ToF scan of the anode flow field of a PEMWE, showing rib and channel areas, as well as the water inlet and outlet. (b) CAD design of the flow field, shown for comparison. (c) Ultrasonic ToF scan of the LGDL, illustrating a granular distribution of high and low reflection intensity. (d) SEM image of the LGDL microstructure given for comparison. Both ToF area scans were obtained during the operation of the PEMWE at a constant current density of 0.25 A cm−2. Hence, water was circulated through the flow field, and LGDL and flow channels contained water as well as oxygen. Reprinted from [144], Copyright (2021), with permission from Elsevier.
Download figure:
Standard image High-resolution image
4. Perspective and outlook
Recent advances have demonstrated the potential of acoustic methods for diagnostics of processes, degradation and health monitoring of energy conversion and power devices. Here the outlook for further development and application of these techniques as well as promising future directions are discussed.
Despite the promising developments, there is still significant scope for further application of acoustic methods for battery diagnostics, even as the importance of battery degradation and failure monitoring increases over the coming years as batteries are placed in progressively challenging applications. Moreover, the desire to improve the range and reduce the cost of electric vehicle batteries drastically provides a compelling case for the manufacture of increasingly power and energy-dense packs. Furthermore, the deployment of fully electrified flight, either in the form of vertical take-off and landing or short–medium-range flight, will necessitate the manufacture of batteries with energy density over 400 W h kg−1 although the viability of lithium-ion technology for this application is still to be proved [73]. These various drivers will result in an increased thermal load on cells and substantially enhanced stress on the electrodes as LIBs are pushed further towards their ultimate limits. Therefore, in addition to earlier studies, there remains much room to deploy the acoustic techniques for monitoring the propagation and development of the most significant degradation pathways which have been reported in lithium-ion cells. This range of possibilities is presented in table 1 [41, 74–76].
Table 1. Summary of the potential application of acoustic techniques for monitoring of specific degradation mechanisms in lithium-ion batteries.
| Degradation mechanism | Cause | Effect | Potential acoustic signatures | Difficulty of identification |
|---|---|---|---|---|
| Delamination | Electrode expansion over time, electrode cracking, manufacturing defects | Additional interface | Additional interfaces, loss of acoustic signal (if void does not contain electrolyte) | Low |
| Penetration | Insertion of foreign body | Distortion of layers, presence of additional interfaces, temperature rise, gas generation | Change in overall waveform, presence of additional layers, increased acoustic impedance | Low |
| Internal short circuit | Foreign body, failure of separator | Gas generation, temperature rise | Loss of signal, increased acoustic impedance, change in overall waveform | Low |
| Thermal runaway | Electrolyte/electrode reaction | Severe gas generation, electrode movement, temperature rise | Loss of signal, increased acoustic impedance, change in overall waveform | Low |
| Electrolyte decomposition | Lithium reaction with electrolyte | Reduced capacity/power | Reduced transmission between layers | Medium |
| Porosity change | Electrode swelling, SEI formation | Change in mechanical properties of electrode | Change in acoustic impedance, speed of sound, change in ToF of peaks | Medium |
| Current collector corrosion | Electrolyte reaction, potential outside safe range | Change in composition of current collector, additional interface | Altered speed of sound, change in ToF of peaks | Medium |
| Lithium plating | Low temperature operation, high rate operation, heterogeneous current distribution | Formation of lithium layer, gas generation | Increased acoustic impedance, additional interface, change in ToF of peaks | Medium |
| Metal oxide degradation | Phase and structural changes | Change in mechanical properties of electrode | Change in acoustic impedance, enhanced stress–strain effects | Medium |
| Metal dissolution | Reaction with electrolyte | Change in mechanical properties of electrode | Change in acoustic impedance, enhanced stress–strain effects | Medium/high |
| Dislocation of particles | Binder decomposition, electrode swelling | Change in electrode density | Altered speed of sound, change in ToF of peaks | Medium/high |
| SEI growth reducing surface area | Electrolyte reaction with electrodes | Additional interface, gas generation | Additional interface, reduced transmission | Medium/high |
| Decomposition of binder | Reaction with charged anode to form LiF | Loss of connected material | Altered speed of sound, change in ToF of peaks | Medium/high |
| Particle cracking | Electrode swelling | Change in electrode density | Change in speed of sound, change in ToF of peaks | Medium/high |
Acoustic techniques also offer the possibility to provide near-real-time information to battery management systems due to the short measurement durations. Therefore, tracking of degradation and failure of cells can be achieved over the cell lifetime in several ways. In the simplest BMS integration, a simple fault signal could be delivered if a characteristic event is observed [35]. In contrast to electrical measurements, this signal is related to the mechanical structure of the cells, providing a secondary means of monitoring the safety of battery systems. Further, acoustic signals could be supplied to a reduced-order model to enable an alternative method for degradation monitoring and frequency analysis could be performed to correlate a signal to specific depths and identify degradation at locations within battery packs [84]. The comparatively low cost and compact, lightweight nature of acoustic techniques will enable the widespread deployment of this tool in battery technology and could complement existing monitoring technology, including thermal and electrochemical measurements to extend the lifetime of batteries.
Acoustic techniques also offer the potential to screen cells that have reached the end of their useable first life, often considered to be 80% of initial SoC. Given the existing challenges with LIB recycling [85], there is an increasing drive to reuse or repurpose batteries, focusing on domestic storage and applications in developing economies [86, 87]. To achieve this on a massive scale, the rapid assessment of the SoH of the cell is imperative. Thus, acoustic methods are among the most promising techniques due to their rapid acquisition time. Here the acoustic methods could be used to probe the cell, which are then categorised against predefined pass/fail criteria. In this scenario, failed cells could be subjected to further analysis. The screening process could also be extended to the manufacturing of new cells, in which acoustic tools act as part of a triage system, enabling cells that do not pass the criteria to be examined using a secondary technique that can assess the extent of the defect in more detail, before a decision on the suitability of the cell is made. To enable the deployment of acoustic tools in these various scenarios, substantial developments will be required, especially in the analysis of cylindrical cells, which, to date, have not been well characterised due to the challenges posed by their geometry.
Beyond lithium-ion chemistry, there exists an opportunity to develop diagnostic and monitoring techniques in concert with novel battery types. Cells containing a lithium-metal anode are at an advanced stage of development, with an expectation that such cells will replace lithium-ion cells in specific niche applications by the end of the decade [88]. These cells are challenging to image using conventional x-ray techniques due to the low attenuation of lithium metal, offering an opportunity for acoustic imaging to aid their developments. Indeed, the delamination of electrodes in solid-state batteries, which have the potential for enhanced volumetric energy density, could be monitored using acoustic methods in a relatively facile manner. Sodium-ion cells that may be used as a low-cost alternative to LIBs in low-power scenarios also offer significant potential for acoustic analysis. These cells contain similar components to LIBs which will allow a straightforward migration of acoustic techniques to these cells should they become widely adopted. Li–S batteries offer substantial improvements in gravimetric energy density and are particularly well suited to acoustic monitoring. The large changes in the density of the cathode and viscosity of the electrolyte provide the opportunity to monitor the SoH and SoC of these cells in a manner which is challenging using electrochemical methods due to the tendency of the cells to relax to an OCV in the middle of the operating window [145]. Moreover, monitoring the 'polysulfide shuttle effect' as well as characterisation of the optimum storage conditions for particular cells could be possible using these tools. As most of these battery types and chemistries are in a comparatively early stage of commercialisation, there remains an opportunity to develop a suite of diagnostic tools in which the acoustic methods could play a huge role [89].
4.1. Perspectives for fuel cells and water electrolysers
Passive acoustic techniques have offered significant benefit for monitoring both water formation and membrane cracking in PEMFCs and are expected to continue to provide a useful diagnosis for water management. However, possibilities abound for the deployment of acoustic methods during cell design and manufacturing, especially in SOFCs where thermal considerations are paramount. As initial studies have shown, the multi-layered ceramic geometry of SOFCs can be monitored using acoustic methods to ensure the integrity of the device. In water electrolysis, a handful of studies have shown the significant potential of the acoustic techniques for PEMWE diagnostics, particularly to study two-phase flow and mass transport processes during system operation with much room for further deployment for understanding degradation in cell components for cell performance optimisation. Table 2 highlights the various possibilities for the deployment of acoustic methods for diagnostics of critical design and process parameters in both fuel cell and electrolyser technologies.
Table 2. Summary of potential applications of acoustic techniques for monitoring of specific process and degradation in fuel cells and electrolysers. Reproduced from [70]. © IOP Publishing Ltd. All rights reserved.
| Degradation mechanism | Cause | Effect | Potential acoustic signatures | Difficulty of identification | Reference |
|---|---|---|---|---|---|
| Electrode delamination | Poor adhesion to membrane | Reduction in active catalytic sites | Additional interfaces, loss of acoustic signal | Low | [146] |
| Blocking of catalytic sites (FC) | Flooding/excess water content in cell | Heterogeneous current density/thermal distribution in cell | Increased transmission through cell | Low | [147] |
| Gas diffusion layer cracking | Excessive compression, low temperature operation | Inhibited electrical contact, inhomogeneous thermal distribution | Additional interfaces, loss of signal across cell | Low | [148] |
| Bipolar plate corrosion | High humidity, acidity of operating environment | Loss of electrical contact, potential catalyst poisoning | Loss of interface, decreased transmission through cell | Low | [149] |
| Bipolar plate fracture | Excessive compression, cold start/low temperature operation | Inhibited electrical contact, inhomogeneous thermal distribution | Additional interfaces, loss of signal across cell | Low | [150] |
| Mismatched electrodes | Substandard manufacturing | Poor electrical contact, gas leaking | Poor transmission across cell, spatially variant interfaces | Low | [151] |
| Poor contact | Insufficient compression | Poor electrical contact, excessive ohmic heating | Poor transmission across cell | Low | [152] |
| Membrane dehydration | High-temperature and high-rate operation | Decrease in membrane malleability | Reduced transmission across cell | Low/medium | [153] |
| Fouling/particulate build-up (electrolyser) | Dissolved solids in liquid streams, corrosion of pipes | Blocking of flow channels | Additional interfaces | Low/medium | [85] |
| Seal failure | Degradation of component material, high pressure | Gas leaking, stack failure | Poor transmission across cell, additional interfaces | Medium | [154] |
| Blocking of catalytic sites (electrolyser) | Excess gas in cell | Heterogeneous current density, enhanced stress on membrane | Decreased transmission through cell | Medium | [155] |
| Catalyst layer cracking | Migration of catalytic particles, excessive compression | Dislocation of active catalytic sites | Additional interfaces, loss of signal across cell | Medium | [156] |
| Fouling/particulate buildup (FC) | Particulates in gas streams, corrosion of pipes, of particular concern in microbial fuel cells | Blocking of gas channels | Additional interfaces, increased transmission through cell | Medium | [157] |
| Pinhole formation | High-temperature and high-rate operation | Increase in membrane dehydration locally | Loss of and/or reduction in signal | Medium/high | [158] |
| Catalyst poisoning | Interaction with bipolar plates | Heterogeneous current density | Reduced transmission at bipolar plate | High | [159] |
5. Conclusion
This review discusses recent progress in the increasing application of acoustic methods for process diagnostics and health monitoring of various electrochemical power devices. The fundamental principle and theory behind the AE and UT techniques and its suitability for diagnostics of electrochemical devices are discussed, and the various implementations of acoustic techniques in various electrochemical power systems are highlighted. Perspectives on future applications for this technique are provided for both battery and polymer electrolyte devices with a focus on identifying specific degradation and failure modes.
Across the range of devices reviewed, it can be seen that the physical, chemical, and mechanical changes during the operation of these electrochemical power devices can be detected using AE features, especially amplitude, frequency, counts and cumulative acoustic energy. In battery applications, many researchers found that electrode particle cracking and gas evolution by electrolyte decomposition are the main sources of AE in batteries. In UT of batteries, various processes and degradation were detected as a shift in amplitude and ToF of the acoustic signal. Given the high rate of publication in this area, it is anticipated that acoustic techniques will play an increasing role in the diagnosis of degradation and failure mechanisms in the years to come. There is also a clear scope to deploy these techniques in the development of reuse and recycling efforts which will become increasingly important as the volume of used cells increases with the replacement of the early fleet of electric vehicles.
While both AE and UT techniques have also been deployed in fuel cells and electrolysers, the number of reports is significantly smaller. These have primarily focussed on the study of two-phase transport, water management and cell degradation; however, it is clear that there remains a wide range of uses for acoustic methods which have yet to be explored in these fields in particular at the stack level, at which acoustic tools offer substantial benefits over more invasive techniques. It is expected that the acoustic techniques will form a key part of the diagnostic tools for monitoring electrochemical devices across various processes including fabrication, operando and post-mortem diagnostics and in the end-of-life decision making process.
Acknowledgments
The authors would like to gratefully acknowledge the EPSRC for supporting the electrochemical research in the Electrochemical Innovation Lab (EP/R020973/1; EP/R023581/1; EP/N032888/1; EP/R023581/1; EP/P009050/1; EP/M014371/1; EP/M009394; EP/L015749/1; EP/K038656/1) and Innovate UK for funding the VALUABLE project (Grant No. 104182). The authors would also like to acknowledge the Royal Academy of Engineering for funding Robinson and Shearing through ICRF1718\1\34 and CiET1718 respectively and the Faraday Institution (EP/S00353/1, Grant Nos. FIRG003, FIRG014). The authors also acknowledge the STFC for supporting Shearing and Brett (ST/K00171X/1) and ACEA for supporting ongoing research at the EIL. Support from the National Measurement System of the UK Department for Business, Energy and Industrial Strategy is also gratefully acknowledged.
Data availability statement
No new data were created or analysed in this study.