

Abstract
The Raman scattering parameters of linewidth and peak energy of liquids that are undergoing local nanoscale spatial confinement are investigated. This is done using several polar and nonpolar liquid molecules of varying size, weight, shape, and polarity that are placed inside different nanometer-sized silica glass pores. Nanoscale confinement is shown to produce changes in the Raman spectra that are related to different quantum effects. Raman spectra are collected from filled porous glass samples with average pore sizes of 2.5, 5, 10, and 20 nm. The resulting spectra are then compared to bulk liquid samples. The most salient spectral changes of individual vibrational modes, overtone modes, and combinations modes of methanol, deuterated methanol, acetone, benzene, carbon disulfide, carbon tetrachloride, and beta-carotene are graphed and tabularized. Results illustrate how different types of molecular vibrations respond to confinement, and how molecular geometrical restrictions affect Raman active modes based on the ratio of pore size to molecular size. Nano-confinement allows for the direct measurement of how intra-molecular and inter-molecular forces affect the expression of vibrational resonant peak energies as well as vibrational dephasing times. The outcome demonstrates a preference for polar molecules, specific vibrational types, and ratios of molecular size to cavity size.
Export citation and abstract BibTeX RIS
1. Introduction
Nanometer-scale confinement can alter vibrational energy states through geometrical restrictions and inter- and intra-molecular interactions with nearest neighbors. These effects give rise to shifts in vibrational energy and narrowing of linewidths in the observed Raman spectra. Recent advancements in sol-gel technologies allow for the manufacturing of silica glass that has porous structures with diameters as small as only a few nanometers. Nanoscale confinement in such a structure can cause changes in molecular behavior and local effects in neat liquids [1]. These effects are created by the high ratio of surface area to volume created, which forces the molecules to reorient themselves along the surface monolayer of the liquid and from the reduction in molecular collisions with the surrounding molecules. The reorientation causes changes in the expression of Van Der Waals forces and dipole interactions. Previous studies have shown that this causes a slowing of reorientational motion and alters vibrational relaxation time [1–3].
Vibrational relaxation is controlled by a higher-order anharmonic process where vibrations are annihilated or created depending on the decay routes available [4, 5]. When the active modes of a solvent system are excited, they may relax by intramolecular and intermolecular interactions with the other molecules present. The relaxation is modified from the liquid's bulk state by the altered intra- and inter-molecular interactions created by nanoscale confinement. These effects can be measured by looking at the Raman linewidth, which is proportional to the inverse of dephasing times  . The rate
  in which vibrational modes decay is given by Fermi's golden rule:

where  is the matrix element for the perturbation between the final and initial states and ρ is the density of the final states. As higher-order interactions occur, additional matrix elements can be added for each vibrational transition [5]. The rate
  can then be converted into the molecular dephasing time
  via
via 
Nanometer pores can be used to isolate and reduce the interaction with other neighboring molecules. During confinement, almost all of the molecules are interacting with the walls of the glass pore. In the case of polar molecules, dipole interactions between the molecules and walls of the pore play a much larger role in the expression of the molecule's vibrational states. Nano confinement has been used to reveal an entirely new vibrational band related to hydrogen bonds created with cavity wall [6–8]. Confinement has also been shown to have a dramatic effect on viscosity, increasing it by 30 times in pyridine in 3 nm pores [3].
Since nonpolar molecules will have minimal interaction with the wall, they can be used to determine the effects of intermolecular interactions caused by pure geometrical restrictions [2, 9]. Molecules are forced to adopt new lowest energy configurations when confined. In the case of nonpolar molecules, this is largely due to Van Der Waals forces. This effect, however, is rather weak until pore size becomes comparable to the molecular size. Both dipole interaction and geometrical restrictions give rise to an additional dephasing contribution 
Reported in [1, 8, 10] the effects of inter- and intra-molecular forces cause restructuring of the spatial distribution of the molecule's atoms [11]. This will change the expression of vibrational peak energies and vibrational linewidths. Linewidths will be affected by the confinement reducing the rate of molecular collisions, which is created from the isolation of the solvent molecule from its surroundings, when inside the pore. The rate of molecular collisions alters the vibrational dephasing time  , which depends on pure dephasing
  and depopulation time
  . Linewidth is related to vibrational relaxation through dephasing time
  [12]:
[12]:

where  is the vibrational dephasing time,
  is the speed of light and
  is the Raman linewidth full width at half maximum (FWHM).
 depends on various contributing processes:

where  is the pure dephasing time,
  is the vibrational lifetime,
  is rotational diffusion, and
  is the contribution of the new molecular interactions created from confinement.
  can typically be ignored for measurements especially at low temperatures. The contribution of
  is very small and in most cases can be ignored entirely [13–15].
 can be thought of as a combination of
  molecular forces such as isolation of the dipole interactions with the pore walls (inter), plus the molecule's interactions with itself because of the geometrical restrictions created by confinement (intra). In the case of this experiment using equations (2) and (3) the relationship between linewidth and vibrational relaxation time can be approximated as:

This paper focuses on Raman linewidth and peak energy effects of several polar and nonpolar liquids to demonstrate the effects polarity, size, shape, as well as intra- and inter-molecular effects such as dipole interactions on the expression of a molecule's vibrational resonance.
2. Methods
Silica porous glass pieces with average pore sizes of 2.5, 5, 10, and 20 nm were impregnated with polar and nonpolar liquid samples of methanol, deuterated methanol, acetone, benzene, carbon disulfide, carbon tetrachloride, and a mixture of beta-carotene in methanol. The spectra produced for a blank 2.5 nm porous glass sample can be found in figure A8 and the parameters of the glass samples can be found in table 1.
Table 1. Physical parameters of porous glass samples used, as provided by the manufacturer.
| Pore Diameter | 2.5 nm |  |
 |
 |
|---|---|---|---|---|
| Total Pore Volume (cc/g) | 0.4 | 0.7 | 1.0 | 1.3 |
| Specific Density (cc/g) | 0.8 | 1.1 | 1.4 | 1.6 |
A small amount of the liquid would be placed on top of the glass using a pipet turning the glass a visible opaque white signifying that the pores have been filled [16]. The glass was allowed to sit for about two minutes before collecting the spontaneous Raman signal to ensure that any liquid not entrapped in the pores could evaporate. In the case of beta-carotene, methanol was used to help transport the beta-carotene into the pores; after confinement, the glass was allowed to sit for much longer so that the majority of the methanol could evaporate. All experimental trials were performed at ambient temperature.
Raman signals of the filled porous glass were then collected by focusing the 532 nm 37 mW beam from an Ocean Optics Raman Microscope model IDR-Micro-532 through a 40x microscope objective. The backscattered light produced at the surface of the glass was then collected and measured. Bulk liquid measurements were taken using the cuvette compartment of the same microscope. The device uses a 3 Megapixel imager that can resolve Raman peaks down to a FWHM of  and has a range of
  .
.
In between chemical trials that glass sample would be placed in an oven for an hour to sterilize and remove any traces of the previous chemical [17].
The resulting Raman spectra were analyzed using code written in Mathematica. The background signal of the filled pore was removed by fitting it to a polynomial and subtracting it from the spectra. The methanol in 2.5nm glass signal before background subtraction can be found in the figure A9, and the polynomial used can be seen in figure A10. This was done instead of subtracting the background of a blank glass sample because the addition of the chemical changes the scattering coefficient of the glass, thus changing the background signal [16]. For example, 5 nm glass when filled would produce a much larger scattering wing in its background signal than the other glass samples. Peak position measurements were rounded to the nearest  to conform to previously published standards.
Cavity induced pressure effects can be ignored. Using equation (5). The pressure in our smallest pore of 2.5 nm is only about 200 bar [16].

where P is pressure,  is the surface tension, and r is the pore radius [16]. To see vibrational spectral shifts as large as reported here, the sample would have to be experiencing over 1 kbar of pressure [18, 19].
Not all vibrational modes were able to be measured. Weaker modes and modes that overlapped with the silica background signal could not always be reliably measured. This is particularly true for weak lower energy modes in the range of about 0–600 cm−1, and high energy modes over 3000 cm−1 as these modes begin to fall outside the range of the spectrometer used. This is true for the CCC bend, CO bend, CO stretch, one of the CH3 stretches of Acetone, the CH stretch of Benzene, the degenerate stretches of Carbon Tetrachloride, the C–S bend overtone of Carbon Disulfide, and the C–C stretch of Beta-Carotene. Linewidths of overlapping modes are also in some cases excluded.
3. Results
The full Raman Spectrum of bulk neat methanol can be seen in the figure A6 and neat methanol in 2.5 nm pore samples after background removal can be found in figure A7.
3.1. Peak energy positions
As seen in figure 1. the primary CH3 stretch vibrational mode of methanol gains in energy as pore size decreases. In the case of Methanol (table 2), the change in vibrational energy seems to be somewhat linearly related to the average pore size of the glass. This trend deviates from other molecules.
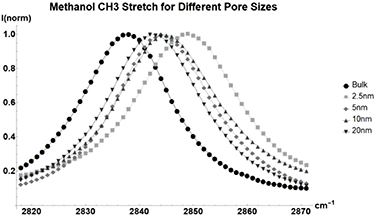
Figure 1. Normalized Raman shift of the 2838  methanol CH3 stretch for Bulk liquid (Circle), and Methanol inside glass with average pore sizes of 2.5 nm (Square), 5 nm (Diamond), 10 nm (Triangle), and 20 nm (Upside-down Triangle).
Download figure:
Standard image High-resolution imageTable 2. Changes in Methanol vibrational modes measured in  . Mode names and reference energies provided by [20].
| Methanol | Bulk ( ) ) |
 (2.5 nm) (2.5 nm) |
 (5 nm) (5 nm) |
 (10 nm) (10 nm) |
 (20 nm) (20 nm) |
|---|---|---|---|---|---|
| CO stretch | 1039 | −10 | −4 | −4 | −4 |
| CH3 bend | 1456 | 0 | 0 | 0 | 0 |
| CH3 stretch | 2838 | 10 | 6 | 6 | 4 |
| CH3 stretch | 2946 | 9 | 7 | 7 | 5 |
Tables shown show the changes in peak energies  in the vibrational spectral assignment of individual vibrational modes for the molecules tested when compared to bulk liquid measurements. Tables not shown can be found in the appendix.
Methanol demonstrates that not all vibrational modes are affected the same by nanoscale confinement. CH3 bend is completely unchanged when introduced into small pores, unlike all three stretching vibrations which experience dramatic changes in vibrational peak energies. CO stretch is also shown to lose energy as pores decreases. This suggests that nanoconfinement prefers certain types of vibrational motion and may be causing vibration energy to become redistributed between the different modes.
The additional weight of deuterated methanol (figure 2, table A1) causes a difference in how methanol responds to confinement. Bending motions are more strongly affected and there is little difference in peak energy when changing between pores sizes. Comparing Deuterated Methanol to standard methanol suggests that heavier molecules are affected at a different rate than lighter molecules.
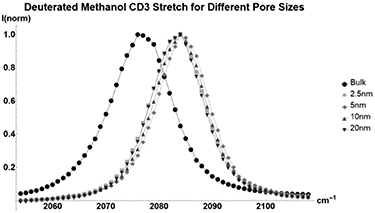
Figure 2. Normalized Raman shift of the  CD3 stretch of deuterated methanol for Bulk Liquid (Circle), and deuterated methanol inside glass with average pore sizes of 2.5 nm (Square), 5 nm (Diamond), 10 nm (Triangle), and 20 nm (Upside-down Triangle). Full table found in table A1.
Download figure:
Standard image High-resolution imageAcetone (figure 3, table A2) is both heavier and has a more complex shape than methanol. Observations show that this causes more sporadic changes in individual vibrational mode peak energies when changing between pore diameters.
Acetone breaks the linear trend that was shown in methanol. While the overall sum of  for all modes trends linearly with pore size, each individual mode sees sporadic fluctuations in its peak energy as pore size decreases. One possible explanation for this is that the more complex structure of acetone is forced to adopt different states of energy redistribution as it becomes more tightly confined.
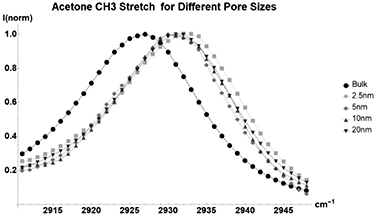
Figure 3. Normalized Raman shift of the  acetone CH3 stretch for Bulk liquid (Circle), and acetone inside glass with average pore sizes of 2.5 nm (Square), 5 nm (Diamond), 10 nm (Triangle), and 20 nm (Upside-down Triangle). Full table found in table A2.
Download figure:
Standard image High-resolution imageBenzene (figure 4, table 4) has smaller changes in its vibrational spectrum, due to the fact that it is nonpolar, all changes can be attributed to geometrical restrictions [2]. There are some changes in lineshape, but the peak position stays almost the same.
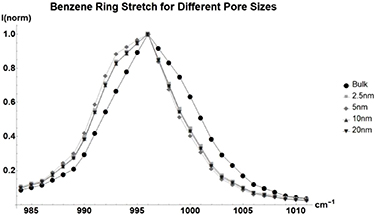
Figure 4. Normalized Raman shift of the  ring stretch of benzene for bulk liquid (Circle), and benzene inside glass with average pore sizes of 2.5 nm (Square), 5 nm (Diamond), 10 nm (Triangle), and 20 nm (Upside-down Triangle).
Download figure:
Standard image High-resolution imageTable 3. Changes in the FWHM of measured vibrational lines of Methanol in different pore sizes compared to bulk neat liquid. Mode names provided by [20].
| Methanol |  ( ( ) ) |
 (2.5 nm) (2.5 nm) |
 (5 nm) (5 nm) |
 (10 nm) (10 nm) |
 (20 nm) (20 nm) |
|---|---|---|---|---|---|
| CO stretch | 25.51 | 4.79 | 6.08 | 8.38 | 6.66 |
| CH3 stretch | 21.14 | 3.1 | 0.91 | 2.49 | 0.84 |
Table 4. Changes in Benzene vibrational modes measured in  . Mode names and reference energies provided by [20].
| Benzene | Bulk ( ) ) |
 (2.5 nm) (2.5 nm) |
 (5 nm) (5 nm) |
 (10 nm) (10 nm) |
 (20 nm) (20 nm) |
|---|---|---|---|---|---|
| Ring Bend | 610 | 0 | 0 | 0 | 0 |
| Ring Stretch | 992 | 4 | 4 | 4 | 4 |
| CH bend | 1182 | −2 | −2 | −3 | −3 |
| Ring Stretch | 1593 | −3 | −5 | 0 | −3 |
| Ring stretch | 1608 | 0 | 1 | 3 | 0 |
| CH Stretch | 2951 | 0 | 0 | 0 | 2 |
A similar argument can be made for nonpolar molecules Carbon Disulfide and Carbon Tetrachloride, which differ from benzene in terms of weight and shape.
Like Benzene, carbon disulfide (figure 5, table A3) sees little to no change in its peak position and line shape. The secondary mode does, however, see changes. This is likely due to the mode's strong overlap with the background signal of the silica glass.
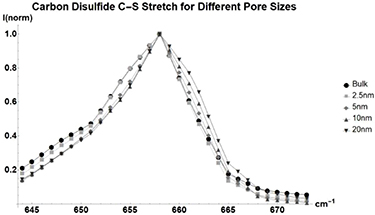
Figure 5. Normalized Raman shift of the  C–S stretch of carbon disulfide for bulk liquid (Circle), and benzene inside glass with average pore sizes of 2.5 nm (Square), 5 nm (Diamond), 10 nm (Triangle), and 20 nm (Upside-down Triangle). Full table found in table A3.
Download figure:
Standard image High-resolution imageLike carbon disulfide and benzene, the nonpolar carbon tetrachloride (figure 6, table A4) sees little to no changes in its vibrational mode assignment when confined in nanometer pores. The only significant changes show up in modes with significant overlap with the silica background signal.

Figure 6. Normalized Raman shift of the  Symmetric stretch of carbon tetrachloride for bulk liquid (Circle), and benzene inside glass with average pore sizes of 2.5 nm (Square), 5 nm (Diamond), 10 nm (Triangle), and 20 nm (Upside-down Triangle). Table found in table A4.
Download figure:
Standard image High-resolution imageUnlike the other molecules previously discussed, the nonpolar beta-carotene (figure 7, table A5) is very large by comparison. The molecule is about 2.3 nm in length meaning it likely does not fit reliably in the 2.5 nm pore. Beta-carotene has larger shifts in its peak energies than the other nonpolar molecules, as its size should be maximizing the geometrical effects discussed in [2]. Due to Beta-Carotenes resonance properties with the source laser, the low energy overtone and combination modes in the  region can be measured [22, 23]. Overtone and combination modes are heavily affected by confinement.
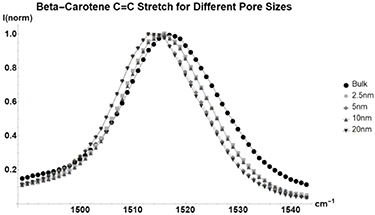
Figure 7. Normalized Raman shift of the  C=C stretch of Beta-Carotene for bulk liquid (Circle), and benzene inside glass with average pore sizes of 2.5 nm (Square), 5 nm (Diamond), 10 nm (Triangle), and 20 nm (Upside-down Triangle). Full table found in table A5.
Download figure:
Standard image High-resolution image3.2. Vibrational linewidth
Nano-scale confinement has been shown to affect the linewidths of Raman active vibrational modes [1]. Vibrational linewidth is inversely related to the dephasing relaxation time [12] as shown in equation (2). It has been suggested that as pore size decreases vibrational line width should either increase or decrease depending on the mode [2].
The following measurements are from the same datasets as the previously shown work. The data presented excludes modes with strong overlap with the silica background signal, or with other modes. Also excluded are measurements for weaker vibrational modes that were not sharp enough to be reliable. Graphs and tables of the linewidth changes for methanol and benzene can be found below, all other data can be found in the appendix.
The vibrational linewidths of the measurable methanol (figure 8, table 3) modes broaden when confined in a nanometer pore. The trend does not correlate linearly to pore size. The CD3 stretch of deuterated methanol (figure A1, table A6) sharpens as pore size decreases. This is the opposite of the CH3 stretch of standard methanol. This implies that weight plays a large role in the determination of vibrational relaxation time.
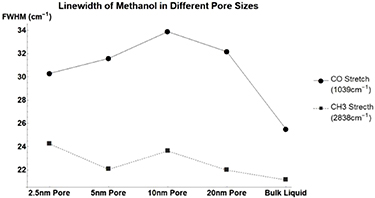
Figure 8. Methanol's vibrational mode linewidths when confined in nanometer pores. CO Stretch at  (Square) and CH3 Stretch at
  (Circle).
Download figure:
Standard image High-resolution imageSimilar to peak energy measurement, the line width of acetone (figure A2, table A7) is also sporadic. Some modes change between positive and negative broadening as pore size decreases. This backs up the previous idea, that acetone likely must adopt radically different configurations when confined.
All molecules listed beyond this are nonpolar. One immediate difference is that there is significantly less change in the linewidth compared to polar molecules. This is similar to what was shown before with vibrational peak energies.
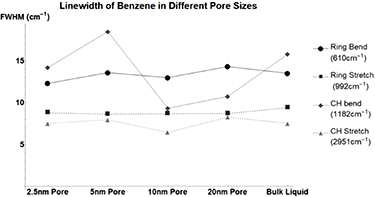
Figure 9. Changes in Benzene's vibrational mode linewidths when confined in nanometers pores. Ring Bend at  (Circle), Ring Stretch at
  (Square), CH Bend at
  (Diamond), and CH Stretch at
  (Triangle).
Download figure:
Standard image High-resolution imageTable 5. Changes in the FWHM of measured vibrational lines of Benzene in different pore sizes compared to bulk neat liquid. Mode names provided by [20].
| Benzene |  ( ( ) ) |
 (2.5 nm) (2.5 nm) |
 (5 nm) (5 nm) |
 (10 nm) (10 nm) |
 (20 nm) (20 nm) |
|---|---|---|---|---|---|
| Ring Bend | 13.52 | −1.2 | 0.08 | −0.52 | 0.81 |
| Ring Stretch | 9.42 | −0.62 | −0.79 | −0.73 | −0.72 |
| CH bend | 15.82 | −1.62 | |||
| CH Stretch | 7.53 | 0 | 0.43 | 0.75 |
Benzene has almost no notable change in its linewidth when confined. The other nonpolar molecules tested; Carbon Disulfide (figure A3, table A8) and Carbon Tetrachloride (figure A4, table A9) see similarly small changes in linewidth. Beta-Carotene (figure A5, table A10) despite being nonpolar sees large changes in linewidth similar to that of polar molecules. This once again occurs for pore sizes of 5, 10, and 20 nm but not for 2.5 nm. For nonpolar molecules, this is analogous to the data presented previously for peak vibrational energy changes.
4. Discussion
Nanoscale confinement shows clear changes in the expression of vibrational energies and dephasing. The most prominent factor in altering these vibration properties is the molecule's polarity. The vibrational modes of a polar molecule are strongly affected by dipole interactions such as hydrogen bonding with the glass pore. This causes a reduction of interbody dephasing interactions, which can be seen in the presented linewidth data.
Changes that occur in nonpolar molecules are largely due to the geometrical restrictions caused by the intense ratio of surface area to volume created. The restrictions cause the liquid to adopt a new lowest energy configuration altering the vibrational resonance energies and dephasing time. The effect of geometrical restriction is directly related to the size of the molecule relative to the pore diameter. The 2.3 nm long nonpolar molecule beta-carotene sees large changes in its Raman spectrum for pore sizes of 5, 10, and 20 nm while not being able to properly fit inside the 2.5 nm pore. When compared to the other smaller nonpolar molecules used in this study the difference appears dramatic. Once the size of the pore is equal to about 4 times the size of the molecule, the shifts in vibrational peak energy become comparable to small polar molecules. The trend does not appear to be exponential as there is minimal change between pores twice the size and four times the size of the molecule while a pore 8 times the size sees almost no change compared to the bulk state.
While polar molecules are also under geometrical restrictions, they are more heavily influenced by polarity-based interactions and reduction of intermolecular interactions. Most of the molecules are located in the surface layer of the liquid, so with decreasing pore size, a higher percentage of molecules will be experiencing dipole interactions with the silica wall. Both effects force the molecules to adopt vastly different lowest energy configurations. Simpler molecules like methanol and methanol-d4 responded to this by altering their vibrational expressions somewhat linearly relative to pore size. More structurally complex molecules like acetone have an overall linear trend but see sporadic fluctuations in individual modes. As pore size decreases, acetone may be forced to adopt radically different molecular configurations. There should be a pore size to molecular size ratio where the effects of geometrical restrictions overtake that of dipole interactions. Based on our nonpolar data this may occur for pores around 4 times the size of the confined molecule.
In most of the polar and nonpolar molecules tested, the peak energy of vibrational stretching is the most overall affected by confinement. One possible explanation for this is that the elongation of the bonds during the vibration causes the most disruption of the molecular configuration. Vibrational overtones and combination bands are also strongly affected because they are a combination of two modes, so the confinement effects become additive. Nano confinement does not appear to have any preference for the type of motion when altering vibrational linewidth, both stretching and bending motions overall seem to be almost equally affected. There also does not seem to be an easy predictor as to whether or not a mode will increase or decrease in linewidth.
In addition, a quantization effect may be occurring. A particle or molecule confined in a nanometer cavity may quantize the vibrational levels causing peak shift and linewidth reduction. This effect will be investigated further.
5. Conclusion
The nanoconfinement of liquids is worth further study as it allows for direct Raman measurements of different types of molecular interactions that would not generally be measurable. Further study could illustrate the effects of hydrogen bonding on the creation of a new vibrational band, and how cavity wall dipole interactions could change for different cavity materials.
A full theoretical model could be developed to better explain what positions the molecules are forced to adopt when confined. Something similar to the atom spatial distribution modeling like what was done in [11], would be a particularly good representation of this effect.
It may be worth studying the threshold in which the effects of geometrical restrictions become large. This could be done using a more tightly controlled pore to molecular size ratio. Based on these results, pore sizes ranging between 4 to 8 times the size of the molecule should be targeted.
Analogous studies can also be performed for phonon trapping. Nanodiamond materials have been shown to have a phonon quantum confinement effect, which produces Raman spectral shifts like what has been reported above [24, 25]. Phonon trapping could allow for quantum effects such as quantum wells to be measured.
Acknowledgments
This work is supported in part by Corning Research and the Army Research Office (ARO). Also thank you to Dr Dan Nolan (Corning).
A1.: Peak energy positions
Table A1. Deuterated methanol vibrational mode changes measured in  . Mode names provided by [20].
| Deuterated Methanol | Bulk
( ) ) |
 (2.5 nm) (2.5 nm) |
 (5 nm) (5 nm) |
 (10 nm) (10 nm) |
 (20 nm) (20 nm) |
|---|---|---|---|---|---|
| CO stretch | 983 | 0 | 0 | 0 | 0 |
| CD3 bend | 1070 | 1 | 0 | −2 | 1 |
| CD3 bend | 1132 | −6 | −7 | −7 | −6 |
| CD3 stretch | 2076 | 8 | 7 | 8 | 8 |
| CD3 stretch | 2140 | 6 | 8 | 6 | 6 |
| CD3 stretch | 2253 | 0 | 2 | 1 | 0 |
Table A2. Changes in acetone vibrational modes measured in cm−1. Mode names and reference energies provided by [20].
| Acetone | Bulk ( ) ) |
 (2.5 nm) (2.5 nm) |
 (5 nm) (5 nm) |
 (10 nm) (10 nm) |
 (20 nm) (20 nm) |
|---|---|---|---|---|---|
| CO op-bend | 499 | −4 | −7 | −7 | −4 |
| CC stretch | 793 | 1 | 1 | 1 | 1 |
| CH3 rock | 1071 | 0 | 0 | 0 | 0 |
| CC stretch | 1227 | 12 | 9 | 9 | 9 |
| CH3 bend | 1361 | 2 | 0 | 3 | 6 |
| CH3 bend | 1437 | −9 | −12 | −9 | −9 |
| CO stretch | 1714 | −1 | −4 | −4 | −3 |
| CH3 bend Doubling | 2703 | 10 | 3 | 5 | 8 |
| CH3 stretch | 2851 | −2 | −5 | −3 | 0 |
| CH3 stretch | 2927 | 5 | 3 | 3 | 5 |
Table A3. Changes in Carbon Disulfide vibrational modes measured in  . Mode names and references provided by [20].
| Carbon Disulfide | Bulk
( ) ) |
 (2.5 nm) (2.5 nm) |
 (5 nm) (5 nm) |
 (10 nm) (10 nm) |
 (20 nm) (20 nm) |
|---|---|---|---|---|---|
| C–S Stretch | 658 | 0 | 0 | 0 | 0 |
Table A4. Changes in Carbon Tetrachloride vibrational modes measured in  . Mode names and references provided by [20].
| Carbon Tetrachloride | Bulk
( ) ) |
 (2.5 nm) (2.5 nm) |
 (5 nm) (5 nm) |
 (10 nm) (10 nm) |
 (20 nm) (20 nm) |
|---|---|---|---|---|---|
| C–CL Bend | 221 | −1 | 0 | ||
| C–CL Bend | 318 | 0 | 0 | 0 | 0 |
| C–CL Stretch | 464 | −1 | −1 | −1 | −1 |
Table A5. Changes in Beta-Carotene prepared in Methanol vibrational modes measured in  . Mode names and reference energies provided by [21, 22].
| Beta-Carotene | Bulk
( ) ) |
 (2.5 nm) (2.5 nm) |
 (5 nm) (5 nm) |
 (10 nm) (10 nm) |
 (20 nm) (20 nm) |
|---|---|---|---|---|---|
| Methyl rock | 1009 | 3 | 3 | 3 | 0 |
| C–C Stretch | 1157 | 1 | 0 | 1 | 0 |
| C–C Stretch | 1193 | 0 | −2 | −1 | 0 |
| C–C Stretch | 1213 | 1 | 0 | 0 | 0 |
| C–H Rock | 1271 | 0 | 0 | 3 | 0 |
| Methyl Bend | 1453 | 2 | 2 | 2 | |
| C=C Stretch | 1516 | 0 | −3 | 0 | −3 |
| Methyl Rock + C–C Stretch | 2167 | 0 | −4 | −5 | −1 |
| C–C Stretch Doubling | 2312 | −2 | −2 | −2 | −2 |
| C=C Stretch + Methyl Rock | 2525 | 1 | −3 | −1 | −1 |
| C=C Stretch + C–C stretch | 2667 | 0 | 0 | −1 | 0 |
A2.: Vibrational linewidth
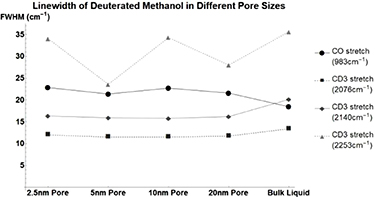
Figure A1. Changes in deuterated methanol's vibrational mode linewidths when confined in nanometers pores. CO stretch at  (Circle), CD3 at
  (Square), CD3 Stretch at
  (Diamond), and CD3 Stretch at
  (Triangle).
Download figure:
Standard image High-resolution imageTable A6. Changes in the FWHM of measured vibrational lines of deutered methanol in different pore sizes compared to bulk neat liquid. Mode names provided by [20].
| Deuterated Methanol |  ( ( ) ) |
 (2.5 nm) (2.5 nm) |
 (5 nm) (5 nm) |
 (10 nm) (10 nm) |
 (20 nm) (20 nm) |
|---|---|---|---|---|---|
| CO stretch | 18.45 | 4.4 | 2.93 | 4.27 | 3.14 |
| CD3 stretch | 13.44 | −1.44 | −1.94 | −1.94 | −1.71 |
| CD3 stretch | 20.14 | −3.8 | −4.22 | −4.35 | −3.95 |
| CD3 stretch | 35.65 | −1.59 | −12.05 | −1.35 | −7.64 |
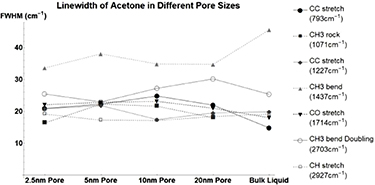
Figure A2. Changes in Acetone's vibrational mode linewidths when confined in nanometers pores. CC Stretch at  (Circle), CH3 Rock at
  (Square), CC Stretch at
  (Diamond), CH3 Bend at 1437
  (Triangle), CO Stretch at
  (Upside-down Triangle), CH3 Bend Doubling at
  (Hollow Circle), and CH3 Stretch at
  (Hollow Square).
Download figure:
Standard image High-resolution imageTable A7. Changes in the FWHM of measured vibrational lines of Acetone in different pore sizes compared to bulk neat liquid. Mode names provided by [20].
| Acetone |  ( ( ) ) |
 (2.5 nm) (2.5 nm) |
 (5 nm) (5 nm) |
 (10 nm) (10 nm) |
 (20 nm) (20 nm) |
|---|---|---|---|---|---|
| CC stretch | 14.84 | 6.12 | 7.48 | 10.02 | 7.15 |
| CH3 rock | 18.07 | 4.25 | 3.59 | 1.49 | |
| CC stretch | 19.91 | 0.92 | 1.93 | −2.45 | −0.37 |
| CH3 bend | 45.66 | −11.98 | −7.58 | −10.76 | −10.87 |
| CO stretch | 18.04 | 4.07 | 4.82 | 5.15 | 2.98 |
| CH3 bend Doubling | 25.38 | 0.11 | −2.38 | −1.9 | 4.85 |
| CH3 stretch | 19.19 | 0 | −1.92 | −2.03 | −0.79 |
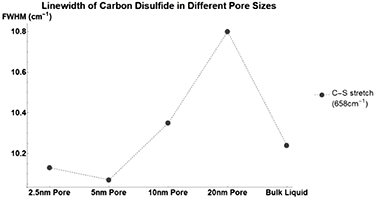
Figure A3. Changes in Carbon Disulfide's vibrational mode linewidths when confined in nanometers pores. CS Stretch at  (Circle).
Download figure:
Standard image High-resolution imageTable A8. Changes in the FWHM of measured vibrational lines of Carbon Disulfide in different pore sizes compared to bulk neat liquid. Mode names provided by [20].
| Carbon Disulfide |  ( ( ) ) |
 (2.5 nm) (2.5 nm) |
 (5 nm) (5 nm) |
 (10 nm) (10 nm) |
 (20 nm) (20 nm) |
|---|---|---|---|---|---|
| C–S Stretch | 10.24 | −0.11 | −0.17 | 0.11 | 0.56 |
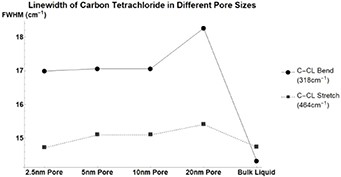
Figure A4. Changes in Carbon Tetrachloride's vibrational mode linewidths when confined in nanometers pores. CCL Bend at 318  (Circle), CCL Stretch at 464
  (Square).
Download figure:
Standard image High-resolution imageTable A9. Changes in the FWHM of measured vibrational lines of Carbon Tetrachloride in different pore sizes compared to bulk neat liquid. Mode names provided by [20].
| Carbon Tetrachloride |  ( ( ) ) |
 (2.5 nm) (2.5 nm) |
 (5 nm) (5 nm) |
 (10 nm) (10 nm) |
 (20 nm) (20 nm) |
|---|---|---|---|---|---|
| C–CL Bend | 14.33 | 2.66 | 2.73 | 2.73 | 3.93 |
| C–CL Stretch | 14.74 | −0.02 | 0.36 | 0.36 | 0.67 |

Figure A5. Changes in Beta Carotene's vibrational mode linewidths when confined in nanometers pores. C–C Stretch at  (Circle), CH Rock at
  (Square), C=C Stretch at
  (Diamond), Methyl Rock + C–C Stretch at
  (Triangle), C–C Stretch Doubling at
  (Upside-down Triangle), C=C Stretch + Methyl Rock at
  (Hollow Circle), and C=C Stretch + C–C Stretch at
  (Hollow Square).
Download figure:
Standard image High-resolution imageTable A10. Changes in the FWHM of measured vibrational lines of Beta-Carotene in different pore sizes compared to bulk neat liquid. Mode names provided by [21, 22].
| Beta-Carotene |  ( ( ) ) |
 (2.5 nm) (2.5 nm) |
 (5 nm) (5 nm) |
 (10 nm) (10 nm) |
 (20 nm) (20 nm) |
|---|---|---|---|---|---|
| C–C Stretch | 15.14 | −0.54 | −0.91 | −0.86 | −1.32 |
| C–H rock | 20.12 | −0.84 | 0.22 | −2.74 | −2.14 |
| C=C Stretch | 21.45 | −1.55 | −1.65 | −1.75 | −1.94 |
| Methyl Rock + C–C Stretch | 28.04 | −0.08 | −0.64 | ||
| C–C Stretch Doubling | 22.62 | −0.98 | 0.89 | −0.67 | −0.92 |
| C=C Stretch + Methyl Rock | 25.62 | −1.36 | 0.83 | 1.12 | 0.95 |
| C=C Stretch + C–C stretch | 28.2 | −2.26 | −3.11 | −1.46 | 1.37 |
A3.: Other spectral data
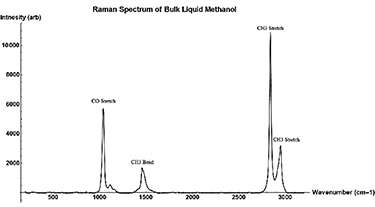
Figure A6. Raman Spectrum of neat bulk Methanol taken with 532 nm Ocean Optics Raman Spectrometer. Raman peaks are labeled by their corresponding vibration type.
Download figure:
Standard image High-resolution image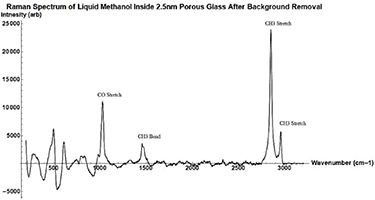
Figure A7. Raman Spectrum of neat Methanol in 2.5 nm porous glass taken with 532 nm Ocean Optics Raman Spectrometer. Raman peaks are labeled by their corresponding vibration type.
Download figure:
Standard image High-resolution image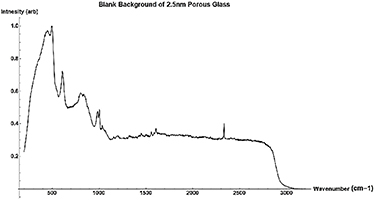
Figure A8. Normalized Raman Background Spectrum of 2.5 nm porous glass sample.
Download figure:
Standard image High-resolution image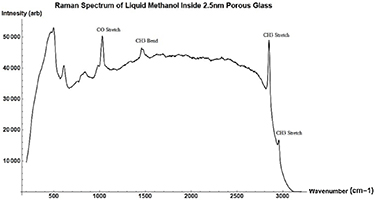
Figure A9. Raman Spectrum of neat Methanol in 2.5 nm porous glass before background removal.
Download figure:
Standard image High-resolution image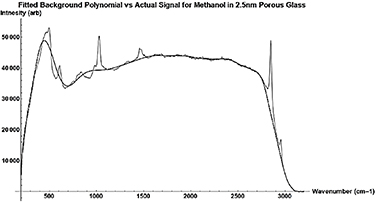
Figure A10. Actual Raman Signal (gray) vs the polynomial (black) used to fit the background.
Download figure:
Standard image High-resolution image