

Abstract
Assessing the quality of groundwater and upstream water in regions experiencing water scarcity during the dry season, such as the mountainous districts of Northern Vietnam, holds immense significance in the management, utilization, and preservation of natural water resources. In this study, we collected and analyzed 54 samples of groundwater and upstream streamwater within the Nam Mu river basin in Lai Chau province during the dry season. These samples underwent thorough analysis for physicochemical parameters, major ion concentrations, and trace elements. Some results revealed a close relationship between streamwater and groundwater, indicating a similar chemical composition. These waters could be classified based on geological formations, yielding two primary water types in the area. The first type, characterized by Ca2+ - Mg2+ - HCO3− is prevalent in Triassic terrigenous sediments. The second type is a mixed water type, ranging from Ca2+ - Mg2+ - Cl− to Ca2+ - Na+ - HCO3−, primarily distributed in Permian felsic volcanic formations. These distinct water types are primarily the result of interactions between water and rock, precipitation processes, and ion exchange phenomena. Geochemical simulation results demonstrated the supersaturation of aragonite, calcite, and dolomite minerals, leading to the precipitation of carbonate minerals. Concurrently, the simulation indicated a tendency to dissolve minerals such as fluorite, gypsum, halite, and sylvite. The assessment of water quality using the WQI indicates that, in accordance with QCVN 01-1:2018/BYT 2018 standards, the majority of groundwater and streamwater are suitable for domestic use. However, exceptions exist in certain sample locations where water quality exceeds permissible standards, primarily due to elevated levels of Fe, Mn, and NO3− concentration. Hence, it is important to implement water treatment processes for the water sourced from these specific locations before their utilization in daily activities to ensure the safety and well-being of the local population.
Export citation and abstract BibTeX RIS

Original content from this work may be used under the terms of the Creative Commons Attribution 4.0 licence. Any further distribution of this work must maintain attribution to the author(s) and the title of the work, journal citation and DOI.
1. Introduction
The El Nino phenomenon, coupled with climate change, leads to a global rise in surface temperatures, resulting in increasingly frequent and severe droughts. These droughts, in turn, contribute to water shortages in numerous regions across the world. Surface water and groundwater serve as the primary sources of water supply for various human, agricultural, and industrial needs (Fu et al 2014, Shamsuddin et al 2014, Su et al 2014a, 2014b, Shamsuddin et al 2019). Consequently, the quality of water is a subject of significant research interest, as it directly impacts the well-being and development of humans, animals, and plants (Todd 1980, Hem 1991, Karanth 1997, Shamsuddin et al 2019). Moreover, the assessment of water quality, particularly concerning groundwater, aids in elucidating the interplay between water sources and geological formations. This understanding is grounded in the processes of groundwater recharge, movement, and storage (Walton 1970). Numerous research projects have undertaken evaluations of surface water and groundwater quality, utilizing various hydrogeochemical tools to assess suitability for domestic consumption, agriculture, and industrial purposes (Nagaraju et al 2014, Sefie et al 2015, Shammi et al 2016). In addition, studies around the world have explored the chemical composition characteristics of groundwater, its origins, and patterns of water recharge. These investigations provide insights into the chemical processes influencing groundwater in specific areas (Winter et al 1998, Banks et al 2001, Kennedy et al 2009, Binley et al 2013, Wang et al 2022, Yang et al 2022).
Lai Chau province, situated along the northern border of Vietnam in the northwest region, is characterized by its mountainous terrain, in which Than Uyen and Tan Uyen districts are located on the key economic growth driving force of the province, closely linked with neighboring provinces as Lao Cai, Son La, Yen Bai and with the Northern Vietnam key economic region as well as with the People's Republic of China. The Nam Mu basin in Lai Chau province, Vietnam, plays an important role in regulating water and regional climate. It serves as a crucial source of water supply for daily living and production activities for the entire region. However, the current situation regarding water resource utilization in this area presents several challenges. These challenges encompass issues related to water quantity, reservoirs, and water quality. Meeting the demands for domestic water supply and industrial production across the entire province, while also effectively managing water sources during periods of drought, water scarcity, or heavy rainfall and flooding, poses considerable difficulties. As of 2023, based on calculations by Lai Chau province, the Nam Mu river basin, covering Than Uyen and Tan Uyen areas, consistently experiences water shortages during the dry season months, from January to March each year (Lai Chau Department of Planning and Investment 2023) Consequently, it is imperative to conduct research and assess the quality of underground water, as well as water in upstream streams, in these critical areas. Such endeavors are of paramount importance for the sustainable management, utilization, and preservation of natural water resources. The findings from these assessments will guide relevant agencies in formulating strategies to ensure the responsible and enduring use of these precious resources.
In this study, the authors have, for the first time, presented hydrogeochemical data on groundwater and upstream streamwater in Tan Uyen and Than Uyen districts to address the following key issues: (i) Elucidate the possible source of chemical composition of surface water and groundwater, encompassing the examination of major ions and trace elements; (ii) Evaluate the interaction between groundwater and surface water in conjunction with the surrounding soil and rock, considering hydrogeological and chemical factors.; and (iii) Assess the quality of groundwater for domestic use, including an analysis of the factors influencing its quality. These investigations aim to provide a more contemporary understanding of hydrogeochemical processes and offer guidance for the responsible and sustainable utilization of water resources, thereby contributing to local socio-economic development.
2. Study area
The study area is situated within the Nam Mu river basin, spanning two districts, Tan Uyen and Than Uyen, in Lai Chau province, in the northwest region of Vietnam (figure 1). The terrain in this region is notably intricate, characterized by two primary zones: to the east lies the western slope of the Hoang Lien Son range, featuring high mountains with rugged topography and steep slopes, while the western and southern regions consist of low mountainous areas with an average elevation ranging from 600 to 1,800 meters above sea level. The study area is geographically located between 21°40' 44'' and 22°18'16'' North latitude and 103°32'10'' and 103°59'22'' East longitude, covering an extensive land area totaling 1,693 km2.
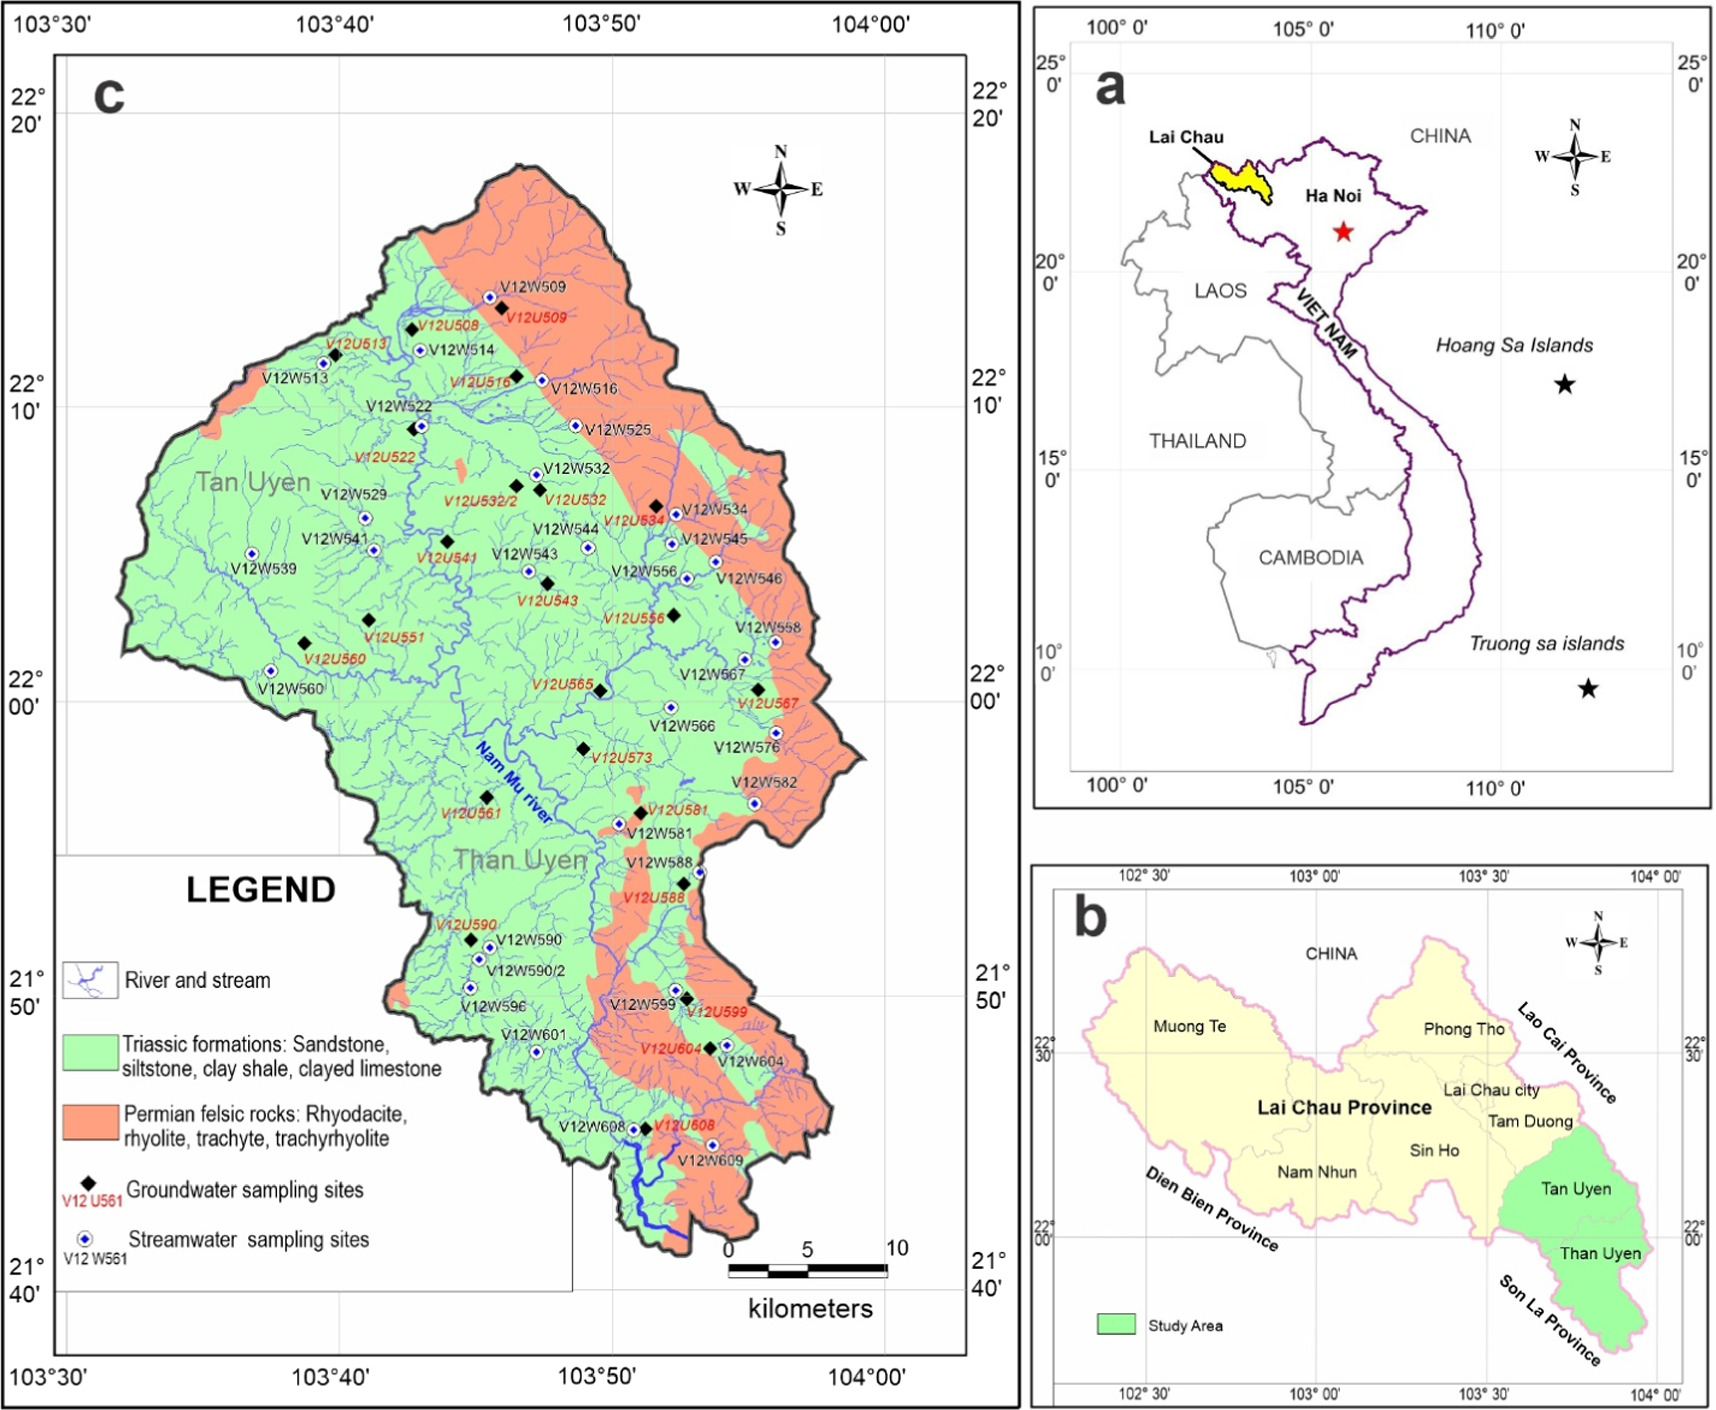
Figure 1. Location map and water sample sites.
Download figure:
Standard image High-resolution imageThe climate in this region exhibits two distinct seasons: the rainy season, which typically spans from April to September each year, and the dry season, which extends from October to March of the following year. During the dry season, dry winds prevail, and precipitation is limited, resulting in scarce water resources. The average annual air temperature in the study area is approximately 19.6 °C. The temperature regime within the region varies significantly due to the substantial differences in altitude. Areas situated above 1,000 meters experience a consistently cool, cold, and humid climate throughout the year. Rainfall in the study area is relatively abundant but unevenly distributed across the calendar. Heavy rainfall is concentrated during the summer months, notably in June, July, and August, contributing to approximately 80% of the annual precipitation.
The study area is situated within the Song Da-Tu Le continental rift system, which is distributed in Northwest Vietnam (Tran and Vu 2011). The formation and evolution of the Song Da-Tu Le continental rift hold significant geological importance in Vietnam's history, particularly during the Permian-Triassic period, as it is closely associated with the connection between the Indochina and North Vietnam terranes with Southern China (Tran et al 2016, Dung et al 2023). The study area is divided into two areas with distinctly different topography and rock formations (figure 1). The eastern part of the study area is characterized by its high mountainous terrain, which forms a segment of the Hoang Lien Son range. Here, one can find prominent felsic volcanic formations dating back to the Late Permian period, specifically belonging to the Tu Le Formation (P3 tl) (Tran and Vu 2011, Usuki et al 2015, Tran et al 2016). The felsic volcanic rocks predominant in this region exhibit petrographic compositions primarily consisting of rhyodacite, rhyolite, trachyrhyolite, and trachyte (Tran and Vu 2011, Tran et al 2016) (figure 1). The western part of the study area features lower terrain compared to the eastern section and constitutes the majority of the study area's landmass. This region encompasses terrigenous sedimentary formations, interspersed with a limited presence of carbonate rocks. These geological formations primarily date to the Middle Triassic and Late Triassic periods and are categorized under the Muong Trai Formation (T2l mt), Nam Mu Formation (T3c nm), and Suoi Bang Formation (T3n-r sb) (Tran and Vu 2011). The predominant lithological composition consists of sandstone, siltstone, and shale, often intermixed with calcareous clay, with only minimal occurrences of limestone (Tran and Vu 2011) (figure 1).
The entire region encompassing Than Uyen and Tan Uyen districts falls within the Nam Mu river basin (figure 1), which constitutes one of the three primary river systems in Lai Chau province. The Nam Mu River originates in Phong Tho district, located within Lai Chau province, at an elevation of 700 meters above sea level. It flows in a northwest-to-southeast direction, traversing the Binh Lu and Tan Uyen valleys before reaching Than Uyen, covering a total river length of 165 kilometers. The primary river branches of the Nam Mu River are predominantly situated in Phong Tho district. The hydrogeological characteristics of the study area are closely related to the underlying geological formations, which have led to the division of the study area into two distinct regions (figure 1). The eastern part primarily comprises geological formations from the Late Permian period, characterized by a lithological composition predominantly consisting of felsic extrusive rocks such as rhyolite and trachyrhyolite. This region exhibits a limited water supply and is characterized by a fractured aquifer dating from the Middle and Late Triassic periods, situated along the lower Nam Mu River (figure 1). The lithological composition of this aquifer is characterized by dark gray shale interspersed with siltstone, sandstone, siltstone-sandstone interbeds, shale, and occasional limestone lenses. The aquifer possesses a water-bearing fracture zone with depths ranging from 19 meters to 101 meters and an average thickness of approximately 66.7 meters. It falls under the category of a medium aquifer type. The primary sources of water in this aquifer are rainwater and temporary surface currents within the area. The aquifer exhibits drainage sources at exposed points, as well as interactions with underlying aquifers (Lai Chau Department of Planning and Investment 2023).
3. Methods
3.1. Sampling and analytical methods
A total of 22 groundwater samples and 32 streamwater samples were systematically collected and preserved during the dry season between 2021 and 2022 (figure 1). Groundwater samples were sourced from various locations, including drilled wells, dug wells, and surface water bodies, to encompass a representative sample of the study area. Streamwater samples were extracted from upstream segments within the Nam Mu River basin, serving as a comparative reference to the groundwater samples within the study area. Water samples were stored in 500 ml polyethylene bottles. Each bottle underwent a thorough rinsing with sample water before collection and was clearly labeled. Each sampling location yielded three bottles. Among those, one bottle was subjected to filtration through filter paper with a size of 10–15 μm and subsequently acidified with 0.1 M HNO3. This acidified sample was reserved for the analysis of cations and trace elements, which was carried out using the ICP-MS method on an Agilent 7900 device at the Institute of Geography, VAST (comprehensive analysis methods, in Lim et al 2022). Non-acidified samples were designated for the analysis of ions, including NO3 −, NH4 +, and PO4 3−, which were assessed via the photometric method. Additionally, Cl−, HCO3 −, and SO4 2− were analyzed using the titration and turbidimetry methods. All collected samples were promptly refrigerated at 4 °C and remained so until they underwent laboratory analysis. In addition to laboratory analysis, certain parameters were measured in the field using a HANNA HI9829-01042 handheld device. These parameters encompassed temperature (T), pH, electrical conductivity (EC), and total dissolved solids (TDS).
Quality control for the analytical results in this study involved calculating the ion balance error, which is based on the relationship between total cations and anions for each water sample. As per the guidelines outlined in the American Public Health Association (APHA 2005), the calculated ion balance errors were found to fall within the acceptable range of ±5%. This validation confirms the reliability of the analysis results obtained in the study.
Groundwater and streamwater hydrogeochemical facies classification and main processes governing the overall chemistry using Piper (1944), Gibbs (1970), and bivariate diagrams were discussed. The Schoeller indexes (Schoeller 1977) such as CAI-I and CAI-II were calculated to analyse the base ion exchange reactions, as follows:


The saturation index (SI) is determined using the following formula:

In which, Q represents the ion activity, while Ksp signifies the mineral dissolution constant. A positive SI value (SI > 0) indicates supersaturation, signifying the propensity of minerals to precipitate from groundwater. Conversely, negative SI values (SI < 0) indicate subsaturation, reflecting the inclination of minerals to dissolve into groundwater and surface water. The equilibrium SI value (SI = 0) signifies that the mineral phase is in a state of equilibrium (Srinivasamoorthy et al 2008, and Pant et al 2018). In this study, the SI index was calculated for 22 groundwater samples and 32 streamwater samples within the study area using the thermodynamic software PHREEQC version 2 (Parkhurst and Appelo 1999). PHREEQC (pH-Redox-Equilibrium in the C programming language) was developed by United States Geological Survey. It is a computer program that can simulate chemical reactions and transport processes in natural or polluted. The program uses an ion-association aqueous model and can perform speciation and SI calculations (Parkhurst and Appelo 1999).
3.2. Water quality index (WQI)
The WQI is a crucial technical parameter employed to assess water quality by considering various physicochemical parameters individually and in aggregate. It serves as a vital tool for categorizing the quality of both surface water and groundwater. In recent years, the WQI has gained widespread usage in the field of environmental science and monitoring to track developments in water quality (Horton 1965, Bordalo et al 2001, Rubio-Arias et al 2012, Bartsch et al 2015, Das Kangabam et al 2017). Sahu and Sikdar 2008, Shinde and Ningwal 2013 have employed the WQI as a valuable tool for assessing the quality of both surface water and groundwater within river basins. These studies have utilized the relationship between various water quality parameters and aquifer characteristics. As a result, the authors have proposed basin-specific water quality parameters, aiming to simplify complex water quality data into easily interpretable indicators. This approach facilitates more effective monitoring and management of water quality within these river basins.
The WQI reflects the influence of each different water quality parameter, depending heavily on the characteristics of the study area and the intended use. Water quality is calculated using the WQI formula and compared with Vietnam's National Technical Regulations on clean water for domestic use (QCVN 01-1: 2018/BYT 2018). The quality scale (Qi) for each water quality parameter is calculated according to the following equation (4):

Where Mi is the concentration of the ith parameter, Ii is the ideal value of each ith parameter, Si is the allowable limit value of the ith parameter as recommended by national standards or the World Health Organization. In this study, the Si value is used according to the recommendations of QCVN 01-1: 2018/BYT 2018. The Si value is taken as an absolute value.
Wi is calculated according to equation (5) as follows:

The water quality index is calculated according to equation (6) as follows:

Water quality index is used to discuss the intended use of water. In this study, water quality will be discussed for drinking and domestic purposes. Therefore, the water quality index is calculated and classified into five levels, from very good water quality to very poor water quality, see table 1 for details.
Table 1. Water quality classification based on WQI (Shinde and Ningwal 2013).
| WQI | Water quality |
|---|---|
| 0–25 | Very good |
| 26–50 | Good |
| 51–75 | Medium |
| 76–100 | Poor |
| >100 | Very poor, unsuitable for drinking |
Water quality assessment using physio-chemical parameters and WQI. The descriptive statistics for analyzed parameters are summarized and presented in section 3.1, and tables 2, 4.
Table 2. The hydrogeochemical attributes values at different sampling sites in the Nam Mu River basin.
| Sample | Temp (oC) | pH | Ec μS/m | TDS mg/L | HCO3 − mg/L | Cl− mg/L | SO4 2− mg/L | NO3 − mg/L | PO4 3− mg/L | Ca2+ mg/L | Mg2+ mg/L | NH4 + mg/L | F−mg/L | Na+ mg/L | K+ mg/L | (Ca+Mg)/ΣCation | (Na+K)/ΣCation |
|---|---|---|---|---|---|---|---|---|---|---|---|---|---|---|---|---|---|
| Groundwater, Permian felsic volcanic rocks | |||||||||||||||||
| V12U534 | 18.9 | 5.90 | 10 | 25 | 9.15 | 3.12 | 3.58 | 2.01 | 0.010 | 2.45 | 0.27 | <0.10 | 0.005 | 2.51 | 2.10 | 0.46 | 0.52 |
| V12U509 | 18.6 | 7.40 | 30 | 25 | 10.37 | 2.81 | 3.20 | 0.99 | 0.004 | 2.40 | 0.73 | <0.10 | 0.08 | 2.63 | 1.75 | 0.53 | 0.47 |
| V12U516 | 23.0 | 6.20 | 80 | 30 | 13.42 | 3.12 | 2.64 | 1.41 | 0.028 | 1.60 | 0.97 | <0.10 | 0.15 | 3.68 | 2.93 | 0.40 | 0.59 |
| V12U581 | 23.8 | 6.70 | 20 | 28 | 10.98 | 2.85 | 2.00 | 2.65 | 0.006 | 1.50 | 1.10 | <0.10 | 0.005 | 1.65 | 5.51 | 0.44 | 0.56 |
| V12U588 | 18.5 | 6.90 | 20 | 38 | 19.81 | 2.75 | 3.11 | 1.24 | 0.034 | 3.95 | 1.36 | <0.10 | 0.005 | 3.89 | 1.98 | 0.58 | 0.41 |
| Streamwater, Permian felsic volcanic rocks | |||||||||||||||||
| V12W534 | 17.1 | 7.40 | 20 | 23 | 8.90 | 2.80 | 3.10 | 1.80 | 0.01 | 2.95 | 0.24 | <0.10 | 0.03 | 1.61 | 1.15 | 0.59 | 0.35 |
| V12W609 | 16.5 | 8.30 | 50 | 49 | 30.10 | 3.09 | 3.20 | 0.34 | 0.01 | 5.61 | 1.22 | 0.10 | 0.08 | 3.41 | 1.94 | 0.65 | 0.34 |
| V12W509 | 18.0 | 7.4 | 20 | 24 | 9.20 | 2.51 | 3.02 | 2.08 | 0.001 | 4.10 | 0.54 | 0.10 | 0.03 | 1.52 | 0.79 | 0.74 | 0.26 |
| V12W516 | 21.9 | 7.3 | 90 | 21 | 8.05 | 3.12 | 3.25 | 0.75 | 0.008 | 2.35 | 0.65 | 0.10 | 0.02 | 1.37 | 1.42 | 0.63 | 0.35 |
| V12W525 | 19.4 | 9.3 | 90 | 18 | 6.10 | 3.01 | 2.85 | 1.52 | 0.006 | 2.10 | 1.11 | 0.10 | 0.01 | 1.11 | 0.07 | 0.79 | 0.20 |
| V12W546 | 17.0 | 7.3 | 20 | 29 | 10.37 | 3.12 | 6.03 | 1.79 | 0.014 | 2.81 | 0.97 | 0.10 | 0.05 | 2.00 | 1.13 | 0.58 | 0.31 |
| V12W556 | 21.8 | 7.7 | 30 | 30 | 9.15 | 4.37 | 6.35 | 1.49 | 0.006 | 3.37 | 1.12 | 0.10 | 0.01 | 2.52 | 1.63 | 0.61 | 0.35 |
| V12W576 | 16.0 | 6.9 | 10 | 25 | 10.37 | 3.74 | 3.17 | 1.17 | 0.012 | 2.00 | 1.22 | 0.20 | 0.02 | 2.05 | 1.41 | 0.60 | 0.38 |
| V12W581 | 21.1 | 7.0 | 90 | 80 | 33.55 | 7.80 | 5.06 | 9.49 | 0.008 | 9.50 | 3.30 | 0.25 | 0.01 | 4.95 | 5.85 | 0.66 | 0.32 |
| V12W582 | 19.8 | 7.1 | 20 | 35 | 18.30 | 3.12 | 3.26 | 0.95 | 0.042 | 3.21 | 1.46 | 0.20 | 0.13 | 2.47 | 1.66 | 0.64 | 0.34 |
| V12W588 | 16.6 | 7.1 | 20 | 37 | 19.52 | 3.12 | 3.01 | 0.88 | 0.018 | 2.81 | 1.22 | 0.20 | 0.07 | 4.28 | 2.19 | 0.48 | 0.48 |
| Groundwater, Triassic sedimentary rock | |||||||||||||||||
| V12U532/2 | 39.0 | 7.10 | 1260 | 1,408 | 201.30 | 3.12 | 835.66 | 0.25 | 0.012 | 272.54 | 82.69 | <0.10 | 1.63 | 8.38 | 3.90 | 0.98 | 0.02 |
| V12U508 | 23.0 | 6.60 | 250 | 111 | 76.25 | 2.81 | 3.67 | 1.46 | 0.002 | 19.24 | 2.68 | 0.250 | 0.04 | 1.99 | 0.77 | 0.87 | 0.08 |
| V12U513 | 15.3 | 8.00 | 130 | 38 | 21.35 | 2.81 | 3.20 | 0.83 | 0.002 | 5.61 | 1.95 | <0.10 | 0.00 | 0.98 | 0.64 | 0.86 | 0.12 |
| V12U522 | 20.0 | 7.70 | 40 | 30 | 15.25 | 2.81 | 2.83 | 0.44 | 0.008 | 4.01 | 1.46 | <0.10 | 0.005 | 1.85 | 1.52 | 0.73 | 0.27 |
| V12U532 | 17.7 | 7.90 | 60 | 49 | 30.50 | 3.12 | 3.00 | 0.70 | 0.014 | 8.02 | 2.19 | <0.10 | 0.005 | 1.25 | 0.29 | 0.90 | 0.10 |
| V12U541 | 20.5 | 7.90 | 60 | 53 | 33.11 | 3.82 | 3.58 | 0.18 | 0.042 | 6.91 | 2.73 | <0.10 | 0.05 | 1.97 | 0.28 | 0.85 | 0.14 |
| V12U543 | 19.7 | 8.40 | 130 | 137 | 94.55 | 3.12 | 5.00 | 0.29 | 0.028 | 24.85 | 4.62 | <0.10 | 0.03 | 4.04 | 0.41 | 0.90 | 0.10 |
| V12U551 | 18.0 | 8.10 | 60 | 77 | 48.80 | 2.81 | 5.66 | 0.44 | 0.010 | 12.42 | 2.92 | <0.10 | 0.02 | 2.67 | 0.97 | 0.81 | 0.13 |
| V12U560 | 19.7 | 7.20 | 110 | 130 | 91.50 | 3.43 | 4.71 | 0.65 | 0.174 | 20.04 | 5.35 | <0.10 | 0.06 | 1.87 | 2.80 | 0.90 | 0.10 |
| V12U561 | 17.8 | 8.50 | 130 | 162 | 112.85 | 2.81 | 6.22 | 0.81 | 0.210 | 24.05 | 9.73 | <0.10 | 0.05 | 2.43 | 2.92 | 0.92 | 0.08 |
| V12U565 | 19.0 | 8.00 | 90 | 102 | 67.10 | 3.12 | 6.2 | 1.12 | 0.040 | 14.83 | 5.11 | <0.10 | 0.01 | 3.19 | 1.52 | 0.87 | 0.13 |
| V12U567 | 22.8 | 6.80 | 70 | 79 | 39.65 | 3.74 | 7.06 | 5.33 | 0.006 | 14.43 | 1.22 | <0.10 | 0.06 | 2.53 | 4.34 | 0.76 | 0.21 |
| V12U573 | 17.5 | 8.10 | 40 | 62 | 39.65 | 2.81 | 4.71 | 0.65 | 0.012 | 7.62 | 3.89 | <0.10 | 0.04 | 1.88 | 0.36 | 0.87 | 0.11 |
| V12U590 | 18.7 | 8.00 | 100 | 116 | 77.47 | 3.12 | 6.50 | 2.28 | 0.022 | 18.60 | 4.04 | <0.10 | 0.04 | 3.04 | 0.60 | 0.89 | 0.10 |
| V12U590/D | 18.7 | 8.00 | 100 | 118 | 78.08 | 3.43 | 6.92 | 2.60 | 0.030 | 18.44 | 4.28 | <0.10 | 0.04 | 3.32 | 0.66 | 0.89 | 0.11 |
| V12U599 | 24.1 | 6.70 | 150 | 185 | 131.15 | 3.43 | 5.36 | 1.68 | 0.001 | 30.06 | 8.76 | <0.10 | 0.17 | 2.17 | 2.16 | 0.94 | 0.06 |
| V12U604 | 15.0 | 6.80 | 10 | 183 | 131.15 | 3.12 | 4.71 | 1.21 | 0.020 | 28.06 | 10.21 | <0.10 | 0.01 | 0.99 | 3.76 | 0.94 | 0.06 |
| V12U608 | 21.7 | 7.10 | 170 | 200 | 140.30 | 3.43 | 4.50 | 4.34 | 0.004 | 36.87 | 6.81 | <0.10 | 0.005 | 1.88 | 1.59 | 0.94 | 0.05 |
| Streamwater, Triassic sedimentary rock | |||||||||||||||||
| V12W522 | 17.1 | 7.50 | 70 | 62 | 39.65 | 3.43 | 4.15 | 0.69 | 0.00 | 9.62 | 2.92 | <0.10 | 0.02 | 1.24 | 0.71 | 0.91 | 0.09 |
| V12W560 | 17.8 | 8.30 | 140 | 146 | 103.70 | 3.12 | 3.67 | 0.14 | 0.00 | 25.65 | 6.08 | <0.10 | 0.04 | 1.60 | 1.59 | 0.94 | 0.06 |
| V12W513 | 16.6 | 7.2 | 80 | 32 | 18.30 | 2.64 | 2.11 | 1.42 | 0.008 | 4.26 | 1.46 | 0.10 | 0.01 | 1.05 | 0.69 | 0.83 | 0.16 |
| V12W514 | 19.6 | 7.8 | 440 | 227 | 126.00 | 3.65 | 42.19 | 0.65 | 0.018 | 42.01 | 2.95 | 0.10 | 0.02 | 1.02 | 0.56 | 0.70 | 0.02 |
| V12W529 | 17.9 | 7.7 | 50 | 55 | 33.55 | 3.43 | 3.67 | 0.87 | 0.006 | 7.21 | 3.40 | 0.10 | 0.01 | 1.90 | 0.79 | 0.86 | 0.14 |
| V12W532 | 17.7 | 7.8 | 190 | 175 | 103.70 | 3.43 | 23.30 | 1.90 | 0.004 | 32.46 | 6.08 | 0.10 | 0.05 | 2.09 | 1.51 | 0.94 | 0.06 |
| V12W539 | 17.7 | 8.2 | 70 | 61 | 39.65 | 3.43 | 2.83 | 1.14 | 0.082 | 9.62 | 2.68 | 0.10 | 0.01 | 0.77 | 0.68 | 0.93 | 0.07 |
| V12W541 | 19.6 | 8.0 | 60 | 70 | 45.75 | 3.12 | 3.20 | 0.88 | 0.001 | 10.82 | 3.65 | 0.10 | 0.04 | 1.58 | 1.10 | 0.89 | 0.10 |
| V12W543 | 17.8 | 8.0 | 90 | 77 | 51.85 | 3.43 | 3.20 | 0.44 | 0.024 | 10.42 | 4.62 | 0.10 | 0.03 | 2.50 | 0.34 | 0.88 | 0.12 |
| V12W544 | 17.4 | 7.6 | 30 | 42 | 24.40 | 2.81 | 3.58 | 0.70 | 0.001 | 5.21 | 2.43 | 0.10 | 0.01 | 1.77 | 0.71 | 0.80 | 0.17 |
| V12W545 | 20.0 | 7.8 | 150 | 150 | 103.70 | 3.12 | 4.90 | 0.52 | 0.001 | 29.26 | 4.13 | 0.10 | 0.13 | 2.41 | 1.88 | 0.92 | 0.08 |
| V12W558 | 18.9 | 6.9 | 60 | 73 | 42.70 | 4.68 | 6.06 | 0.36 | 0.006 | 8.82 | 5.11 | 0.60 | 0.06 | 2.34 | 2.33 | 0.83 | 0.16 |
| V12W566 | 16.8 | 7.6 | 100 | 115 | 79.30 | 3.12 | 4.71 | 0.22 | 0.034 | 16.83 | 6.57 | 0.10 | 0.01 | 3.44 | 0.61 | 0.89 | 0.11 |
| V12W567 | 20.2 | 8.3 | 110 | 94 | 61.00 | 3.43 | 4.71 | 0.52 | 0.016 | 16.03 | 3.65 | 0.20 | 0.13 | 2.41 | 2.31 | 0.86 | 0.13 |
| V12W590 | 17.4 | 8.7 | 90 | 93 | 61.00 | 3.74 | 5.07 | 0.77 | 0.008 | 14.59 | 4.28 | 0.20 | 0.05 | 2.61 | 0.81 | 0.89 | 0.11 |
| V12W590/2 | 18.1 | 8.4 | 30 | 38 | 20.12 | 4.37 | 3.57 | 0.65 | 0.010 | 4.75 | 1.95 | 0.20 | 0.03 | 1.62 | 0.69 | 0.81 | 0.18 |
| V12W596 | 16.0 | 8.8 | 60 | 75 | 48.80 | 3.43 | 4.80 | 0.50 | 0.004 | 10.82 | 3.16 | 0.20 | 0.04 | 2.55 | 0.43 | 0.86 | 0.13 |
| V12W599 | 22.0 | 8.1 | 160 | 182 | 128.10 | 4.37 | 6.13 | 1.01 | 0.002 | 27.74 | 9.92 | 0.20 | 0.01 | 2.54 | 2.39 | 0.93 | 0.07 |
| V12W601 | 8.7 | 120 | 136 | 91.50 | 3.43 | 5.08 | 0.28 | 0.006 | 27.25 | 3.40 | 0.20 | 0.05 | 3.39 | 1.07 | 0.90 | 0.10 | |
| V12W604 | 18.5 | 7.0 | 150 | 178 | 128.10 | 3.74 | 2.92 | 2.22 | 0.004 | 26.45 | 10.94 | 0.10 | 0.18 | 1.19 | 1.86 | 0.95 | 0.04 |
| V12W608 | 20.4 | 7.9 | 200 | 225 | 161.65 | 4.05 | 5.26 | 1.76 | 0.008 | 39.28 | 8.51 | 0.10 | 0.11 | 2.63 | 1.99 | 0.94 | 0.06 |
| QCVN 01-1:2018/ BYT | 6.0–8.5 | 1,000 | 250 | 8.86 | 0.39 | 1.50 | 200 | ||||||||||
| WHO ( 2022 ) | 6.5–8.5 | 1,500 | 1,000 | 400 | 250 | 250 | 50 | 200 | 150 | 1.50 | 200 | 30 | |||||
4. Result and discussion
4.1. Groundwater and streamwater characteristics
Hydrogeochemical characteristics of groundwater and streamwater can be influenced by many different factors including rock-mineral types, residence time in bedrock, water characteristics, flow through rock, and the location of initial groundwater formation (Toth 1999). Ion concentration in water reflects the basic hydrogeochemical characteristics of groundwater (Li et al 2018). In this study, the results of physicochemical analysis of groundwater and streamwater samples in the study area are summarized in tables 2 and 3, thereby serving as a basis for identifying and analyzing hydrogeological characteristics, and chemistry of streamwater and groundwater here as well as evaluating the controlling factors. Guidelines for clean water used for living and drinking purposes recommended according to Vietnamese guidelines (QCVN 01-1:2018/BYT 2018) and the World Health Organization (WHO 2022) are also included for comparison.
Table 3. Correlation matrix of hydrogeochemical compositions in groundwater and streamwater of the Nam Mu River basin.
| Permian felsic volcanic rock | Si | Ca2+ | Mg2+ | Na+ | K+ | ||
|---|---|---|---|---|---|---|---|
| Groundwater | Si | 1 | |||||
| Ca2+ | 0.780936 | 1 | |||||
| Mg2+ | 0.794378 | 0.99928 | 1 | ||||
| Na+ | 0.890013 | 0.970293 | 0.970787 | 1 | |||
| K+ | 0.968526 | 0.860639 | 0.86823 | 0.94697 | 1 | ||
| Streamwater | Si | 1 | |||||
| Ca2+ | 0.097132 | 1 | |||||
| Mg2+ | 0.080106 | 0.762437 | 1 | ||||
| Na+ | 0.648074 | 0.288263 | 0.056563 | 1 | |||
| K+ | 0.348556 | 0.185295 | 0.057305 | 0.166987 | 1 | ||
| Triassic sedimentary rock | Groundwater | Si | 1 | ||||
| Ca2+ | −0.187976 | 1 | |||||
| Mg2+ | −0.035937 | 0.764019 | 1 | ||||
| Na+ | 0.485045 | −0.107835 | −0.063284 | 1 | |||
| K+ | 0.745369 | −0.009092 | 0.247688 | 0.001 | 1 | ||
| Streamwater | Si | 1 | |||||
| Ca2+ | −0.08491 | 1 | |||||
| Mg2+ | −0.10257 | 0.745244 | 1 | ||||
| Na+ | 0.526831 | −0.028774 | −0.12428 | 1 | |||
| K+ | 0.025128 | 0.060586 | 0.098758 | 0.583393 | 1 |
The analysis results presented in table 2 indicate that the pH values of groundwater samples span from 5.9 to 8.5, with an average pH of 7.4. In contrast, the pH values of streamwater samples range from 6.9 to 9.3, with an average pH of 7.8. These findings reveal that the groundwater within the study area tends to be slightly acidic to alkaline in nature, whereas the streamwater exhibits a neutral to alkaline pH range. The EC of groundwater samples falls within the range of 10 to 250 μS/cm, with an average value of 84.5 μS cm−1. In comparison, the EC of streamwater samples spans from 10 to 440 μS cm−1, with an average EC of 90.9 μS/cm. Furthermore, the TDS in groundwater samples exhibit a range of 24.9 to 199.9 mg l−1, with an average TDS of 89.9 mg/l. On the other hand, the TDS values in streamwater samples vary between 17.9 and 227.3 mg l−1, with an average TDS of 83.6 mg l−1.
The average cation concentration in groundwater within the study area exhibits a distinct dominance of Ca2+ ions over other cations. These cations are observed in the following order of concentration Ca2+ > Mg2+ > Na+ > K+, with respective concentrations of 13.9 mg l−1, 3.7 mg l−1, 2.4 mg l−1, and 1.8 mg l−1. Similarly, in streamwater samples, the average cation concentration follows a similar order of predominance Ca2+ > Mg2+ > Na+ > K+ with corresponding concentrations of 13.1 mg l−1, 3.5 mg l−1, 2.2 mg l−1, and 1.4 mg/l (table 2).
The average anion concentration in groundwater within the study area follows the order of HCO3 − > SO4 2− > Cl− > NO3 −, with respective concentrations of 58.7 m g /l , 4.5 m g /l , 3.1 mg l−1, and 1.5 mg/l. Notably, HCO3 − ions are significantly more abundant in the water compared to the other anions, highlighting their clear predominance. Similarly, the order and values of these anions are similar and closely aligned with those found in the upstream water of the study area, where the anion concentration is also in the order of HCO3 − > SO4 2− > Cl− > NO3 −, with corresponding concentrations of 52.4 mg l−1, 5.9 mg l−1, 3.6 mg l−1, and 1.2 mg l−1 (table 2).
The concentrations of ion F− in groundwater samples vary within the range of 0 to 0.17 mg l−1, while ion NH4 + range from less than 0.1 mg l−1 to 0.25 mg l−1. Similarly, in streamwater samples, the concentrations fluctuate within the corresponding range of 0.01 mg l−1 to 0.18 mg l−1 for ion F− and from 0.1 mg l−1 to 0.6 mg l−1 for ion NH4 +.
Among the sampled water set, one particular sample, labeled as V12U532/2 and sourced from Trung Dong commune, Tan Uyen district, stands out with distinctive analytical results. This water sample exhibits a notably high water temperature of 39 °C, a Total Dissolved Solids (TDS) value of 1,408 mg l−1, and an elevated fluoride ion concentration of 1,626 mg l−1. The water is categorized as having a Ca2+ - SO4 2− composition (figure 1, table 2). These exceptional physicochemical characteristics distinguish this water sample from the rest, classifying it as mineral water with a high temperature and an unusually high fluoride concentration. Such characteristics render it a valuable source of hot mineral water, warranting further investment and in-depth research for potential utilization and development.
4.2. Hydrogeochemical process and control mechanisms
In nature, surface water and groundwater are mostly composed of the main cations Mg2+, Ca2+, Na+, K+ and the main anions SO4 2−, Cl− and HCO3 −. Recognizing the significance of these key components, Piper introduced the Piper triangle diagram in 1944. This diagram serves as a valuable tool for classifying various types of water based on their origins (Piper 1944). Beyond classification, the Piper triangle diagram also aids in understanding the distribution patterns of different water types and provide information about flow and water quality (Back 1960, Freeze and Cherry 1979, Ophori and Toth 1989, Sikdar et al 1993, Sahu and Sikdar 2008, Sunitha and Reddy 2022, Yang et al 2022). In the context of the study area, the Piper chart was generated, revealing notable patterns. The majority of samples, encompassing both streamwater and groundwater originating from Triassic sedimentary formations, are concentrated within zones A and G on the diagram. This concentration signifies that Ca2+ and HCO3 − are the predominant cation and anion within these samples (figure 2). In contrast, within the Permian felsic volcanic formations, the Piper diagram illustrates distinct patterns. The majority of both streamwater and groundwater samples are concentrated in zones D, C, and G. Among these, streamwater is predominantly clustered in zone D, showing no pronounced dominance between cations and anions. However, groundwater samples within this geological context exhibit some concentrations in zone C, providing evidence of Na+ as a prevalent cation in these specific samples. This distribution highlights the variability in cation and anion compositions within the study area's water sources (figure 2). On the Piper diagram, most streamwater and groundwater samples in Triassic sedimentary formations are distributed in zone I, belonging to the Ca2+-Mg2+-HCO3 − water type. Groundwater and streamwater samples in Permian felsic volcanic formations have quite diverse water types, belonging to zone I corresponding to Ca2+-Mg2+-HCO3 − water type, zone III with mixed Ca2+- Mg2+- Cl− water type, and zone IV belongs to mixed Ca2+-Na+-HCO3 − water type (figure 2). Of which, zone III is mainly streamwater samples and zone IV is mainly groundwater samples. The similarity in water types of streamwater and groundwater in the dry season in the study area shows the similarity in recharge sources, possibly mainly from rainwater. In mountainous areas, rainwater is commonly composed of Ca2+ and HCO3 − ions and the penetration of rainwater into groundwater has increased the dissolution rate of carbonate minerals rich in Ca2+ and HCO3 −, thus creating a type of Ca2+-Mg2+-HCO3 − water (Gao et al 2020, Wang et al 2022). The formation of mixed water Ca2+-Mg2+- Cl− and Ca2+-Na+-HCO3 − may be due to evaporation being much larger than precipitation, increasing the Cl− and Na+ concentration thereby creating the water type Ca2+-Mg2+- Cl− (Gao et al 2020, Wang et al 2022). These are representative of evolved water patterns, the meteorological signature of which disappears due to rock-water interactions and ion exchange reactions.
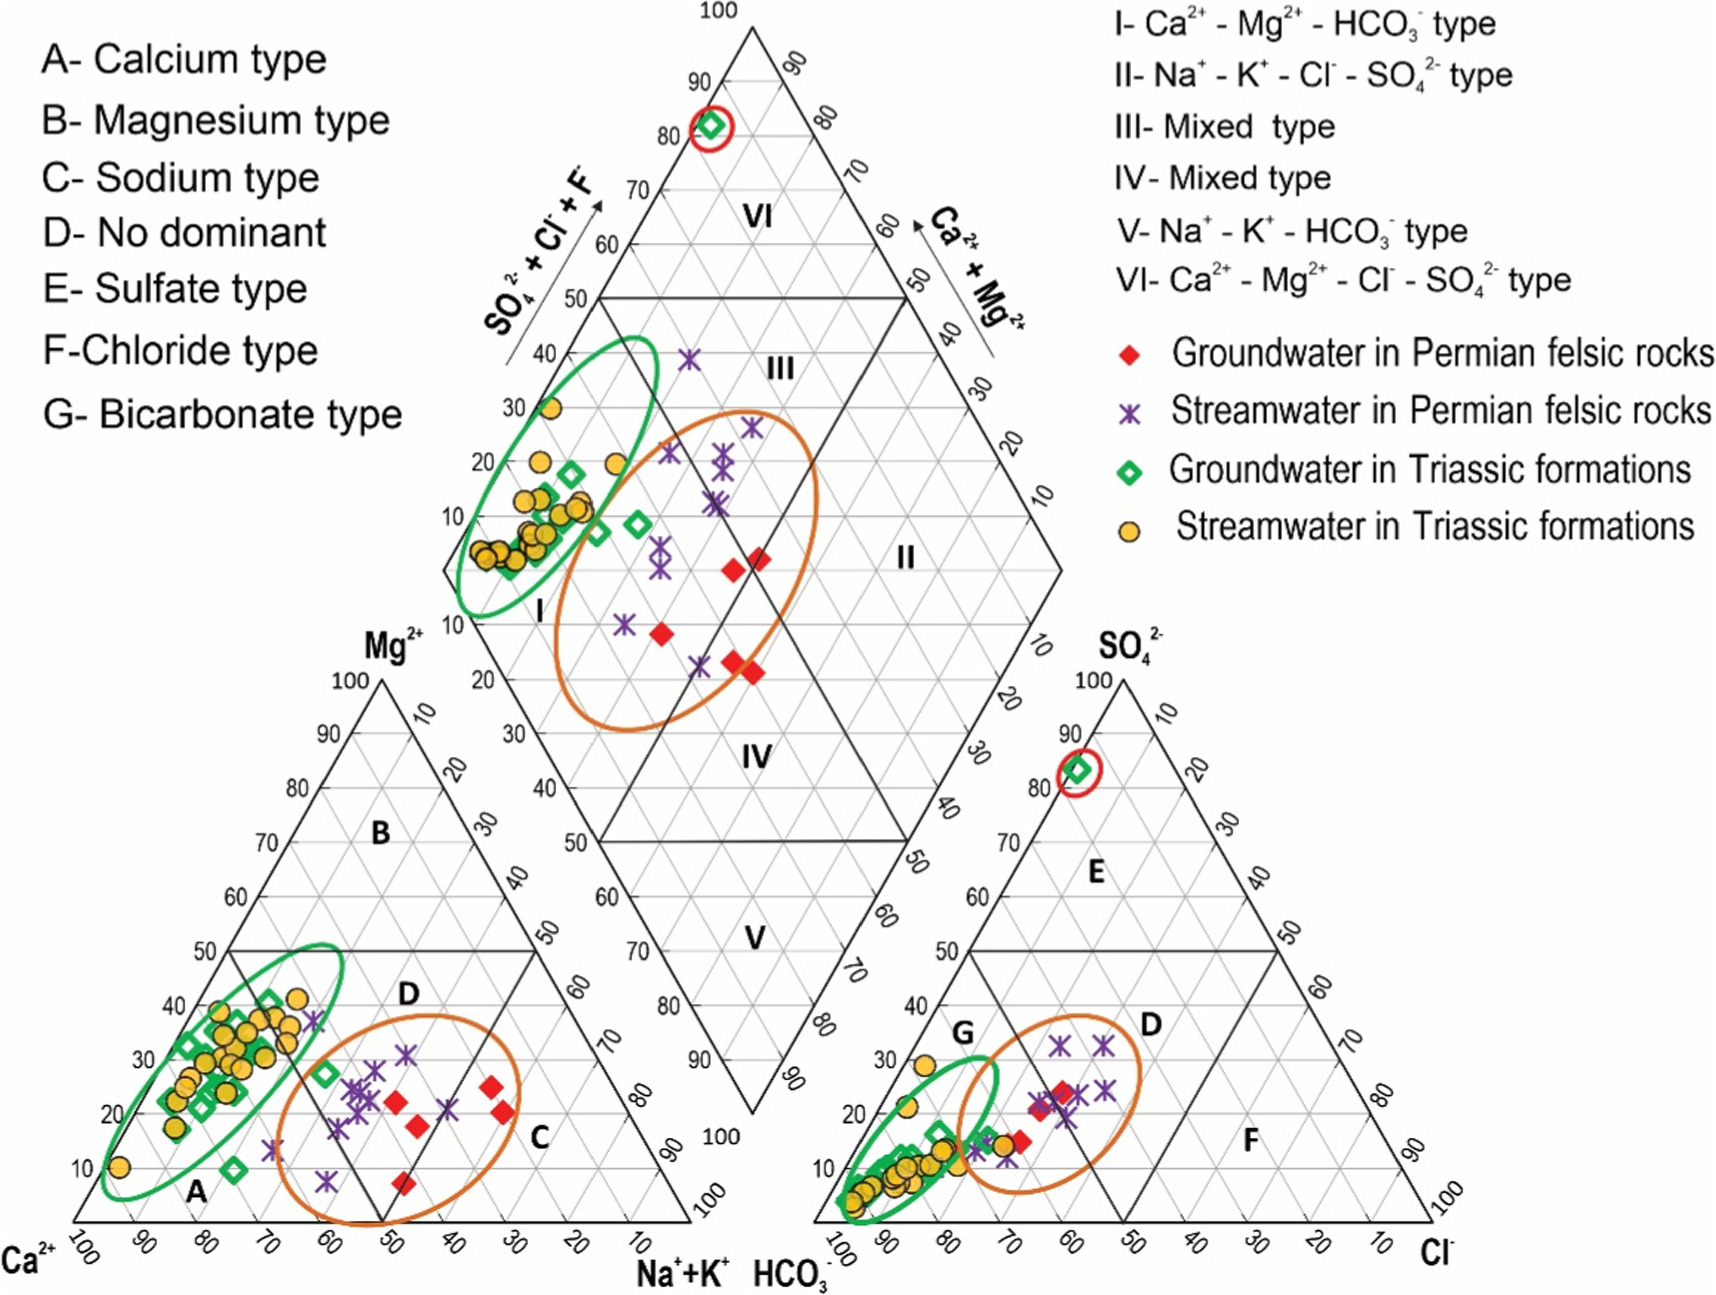
Figure 2. Piper diagram showing hydrogeochemical facies of groundwater and upstream water in the Nam Mu River basin.
Download figure:
Standard image High-resolution imageThe hydrogeochemical characteristics of water are affected and changed by various natural processes such as evaporation, precipitation, bedrock weathering or a combination of the above factors (Gaur et al 2022). These processes are clearly shown through the Gibbs diagram, based on the correlation between the ratios of cation Na+/(Na+ + Ca2+) to TDS and anion Cl− /(Cl− + HCO3 −) to TDS (figure 3). The Gibbs diagram can determine the geochemical reaction mechanism in aquifers, stream water and lithological factors, and explain the origin of water as well as the mechanism that affects the chemical composition of water,. natural water (Gibbs 1970, Shamsuddin Mohd et al 2019). Groundwater and streamwater samples in Tan Uyen and Than Uyen districts are shown on the Gibbs diagram (figure 3), showing that the majority of samples are located in the bedrock dissolution area and rainwater influence area. This proves that the two main factors affecting the chemical composition of groundwater and streamwater in the study area are the weathering process of rock-forming minerals and the recharge of rainwater into the aquifers. In particular, groundwater and streamwater samples in Permian felsic volcanic formations are influenced by the recharge process of rainwater, while groundwater and streamwater samples in Triassic terrigenous sediments are mainly affected by the weathering of rock-forming minerals (figure 3). This is also evidenced by the Schoeller indexes (Schoeller 1977) such as CAI-I and CAI-II.
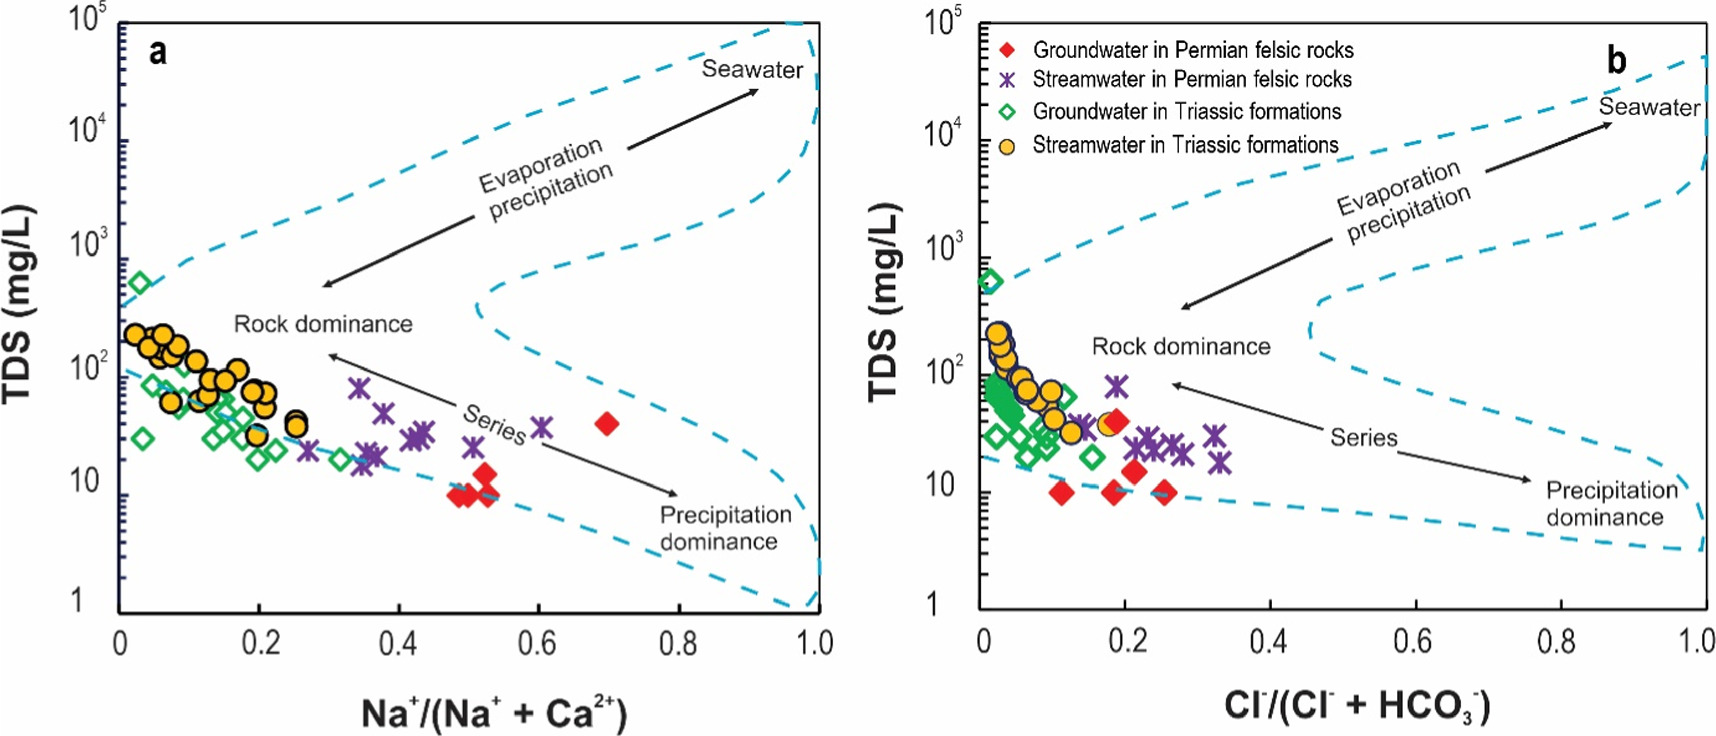
Figure 3. Gibbs diagram of the main processes controlling groundwater and streamwater chemistry in the Nam Mu River basin.
Download figure:
Standard image High-resolution imageThe CAI-I and CAI-II indexes can be positive or negative because they depend on the exchange of Na+ and K+ ions in water with Ca2+ and Mg2+ in rock or soil and vice versa. If these values are positive, it means the exchange of Na+ and K+ in water with Ca2+ and Mg2+ occurs. In contrast, if these values are negative, it shows that ion exchange occurs between Ca2+ and Mg2+ ions of surface water and Na+ and K+ ions in rocks or soil (Schoeller 1977, Kant et al 2018, Gaur et al 2022). This process occurs with bedrock formations or soils that serve as the main source of dissolved solids in water. The samples in figure 4(a) mostly show negative values, showing that the reverse ion exchange process controls the chemical composition of surface water as well as the interaction between rock and water. The patterns shown in the Na+ and Cl− correlation plot (figure 4(b)) show that Na+ mainly originates from the dissolution of halite (Wu et al 2018, Wang et al 2022). However, some samples located above the 1:1 line show the predominance of Cl−, indicating that Cl− can come from anthropogenic sources. Concomitantly, ion exchange between Na+, K+ with Ca2+ and Mg2+ from surrounding formations can also reduce Na+ concentration, causing Cl− concentration to increase. Some samples are below the 1:1 line, possibly due to the weathering process of silicate rocks, increasing the Na+ concentration in water samples and accompanying it with increased concentrations of HCO3 −. Figure 4(c) shows that samples are quite close to 0.5*Total cations, especially groundwater and streamwater samples in Permian felsic volcanic formations. This proves that silicate weathering plays a dominant role in Na+ concentration in water samples of the study area, especially for groundwater and streamwater in Permian felsic volcanic formations. The correlation chart of Ca2+ with Mg2+ with most samples lying on the 1:1 line further confirms this role (figure 4(d)).

Figure 4. Plots of CAI-I versus CAI-II (a), Na+ versus Cl− (b), Na+ versus Total cation (c), Ca2+ versus Mg2+ (d), (Ca2+ + Mg2+) versus (HCO3 − + SO4 2−) (e), Ca2+ versus SO4 2− (f).
Download figure:
Standard image High-resolution imageOn the correlation chart between (Ca2+ + Mg2+) and (HCO3 − + SO4 2−) (figure 4(e)), the research samples lie on the 1:1 line, proving that in different formations of the study area, reaction is mainly dissolution of calcite, dolomite, anhydrite, gypsum. In addition, previous studies have shown that, if sulfate minerals (e.g., gypsum) are the main source of Ca2+ in water, the ratio of Ca2+ to SO4 2− is 1:1 (Bahir et al 2018, Wang et al 2022). Samples of the study area were mostly below the 1:1 line (figure 4(f)), demonstrating that Ca2+ and SO4 2− did not completely originate from gypsum dissolution.
The dissolution process of various materials gives rise to distinct ion combinations, and as a result, the geological formations within the study area exert a significant influence on the chemical composition of both streamwater and groundwater. Notably, the presence of ions such as Ca2+ and Mg2+ can be attributed to the weathering process of silicate, carbonate, and evaporite rocks. In addition, ions like Na+ and K+ find their origins in the weathering of silicate rocks and the dissolution of evaporite formations. This understanding underscores the pivotal role of geological factors in shaping the chemical makeup of the study area's water sources. Notably, SO4 2− and Cl− ions predominantly originate from the dissolution of evaporite rocks, while HCO3 − ions mainly derive from the weathering of silicate and carbonate minerals (Mortatti and Probst 2003, Pant et al 2018, Wang et al 2022). According to Meybeck 1987, carbonate minerals have 12–40 times higher solubility than silicates and are more easily weathered under natural conditions. Analytical results of the study area show that the average value of the ratio [(Ca2+ + Mg2+)/Total cation] is quite high for groundwater and streamwater samples in Triassic terrigenous sedimentary formations, with values of 0.87 and 0.88, respectively, and lower values for groundwater and streamwater samples in the Permian felsic volcanic formation, with values of 0.48, 0.63, respectively. In contrast, the ratio (Na+ + K+/Total cation) is quite low for groundwater and streamwater samples in Triassic terrigenous sediments, with values of 0.10 and 0.11, respectively, and higher for groundwater and streamwater in the Permian felsic volcanic formation, with values of 0.33 and 0.51, respectively (table 2, figure 4(c)). This observation suggests that in the groundwater and streamwater samples from Triassic terrigenous sediments, the weathering of silicate and evaporate minerals appears to be less pronounced when compared to the weathering of carbonate minerals. In contrast, it is apparent that in groundwater and streamwater sourced from Permian felsic volcanic formations, the processes of silicate weathering and evaporation exhibit greater intensity when compared to the weathering of carbonate minerals. These findings are further substantiated by the positive correlation observed between Si and cations such as Na+, K+, Ca2+, and Mg2+ in groundwater and streamwater samples from Permian felsic extrusive formations. In contrast, there exists a negative correlation between Si and most of these cations in groundwater and streamwater samples derived from Triassic terrigenous sediments (table 3). This phenomenon is also distinctly evident in the correlation chart between Ca2+/Na+ with HCO3 −/Na+ and Mg2+/Na+ (figure 5), thus water samples from Permian felsic volcanic formations cluster near the silicate field, signifying a substantial silicate weathering process. Besides, water samples from Triassic terrigenous sediments gravitate towards the carbonate end member of the field, demonstrating the prevalence of carbonate weathering processes in this geological context. This chart provides a visual representation of the differing geochemical processes in these two distinct areas (figure 5).
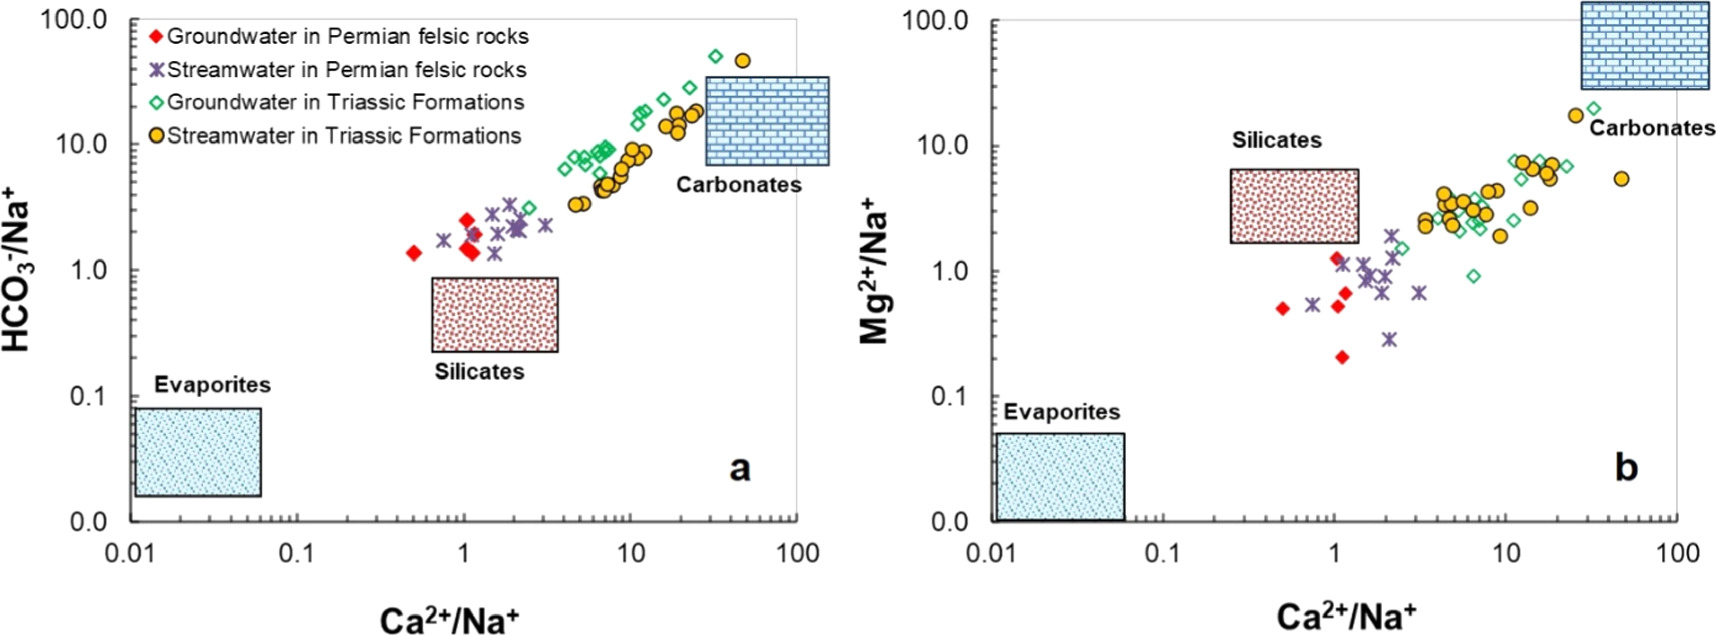
Figure 5. Plots of Na-normalized Ca versus HCO3 (a), and Na-normalized Ca versus Mg of groundwater and streamwater in the study area.
Download figure:
Standard image High-resolution image4.3. Saturation index
The process of mineral precipitation or dissolution significantly influences the chemical characteristics of both streamwater and groundwater, and this influence is quantified through the mineral saturation index (SI). The SI value plays a crucial role in assessing the equilibrium between groundwater and surface water, providing valuable insights into the degree of saturation within specific mineral phases.
The SI values, arranged in descending order, exhibit the following trend: dolomite > calcite > aragonite > gypsum > anhydrite > fluorite > sylvite > halite (figure 6). Notably, the SI values for dolomite, calcite, and gypsum fall within the oversaturated range, indicating their propensity to precipitate from the water. In contrast, the SI values for minerals such as aragonite, anhydrite, fluorite, and halite indicate subsaturation, suggesting their tendency to dissolve into the water (figure 6). These results confirm the substantial influence of carbonate minerals on the geochemistry of both groundwater and streamwater within the study area, aligning with the prevalence of the Ca2+-Mg2+-HCO3 − water type. This is further corroborated by the saturation indices of calcite (SIC), which demonstrate oversaturation for most samples in terms of Ca2+ (figure 7(a)), and dolomite (SID), which similarly exhibits oversaturation for most samples, particularly in relation to Mg2+ (figure 7(b)). This study, conducted during the dry season characterized by low rainfall, may have contributed to the oversaturation of the minerals mentioned above. This phenomenon aligns with the observations of previous studies (e.g., Garrels and Mackenzie 1967, Elango and Ramachandran 1991) that saturation indices can vary in response to rainfall conditions. During dry conditions, groundwater often remains supersaturated with calcite and dolomite due to factors like evaporation, leading to the precipitation of these minerals. In contrast, in the rainy season, these minerals are diluted. The observed oversaturation suggests that these minerals have a sufficient residence time to reach a state of equilibrium (Singh et al 2017).
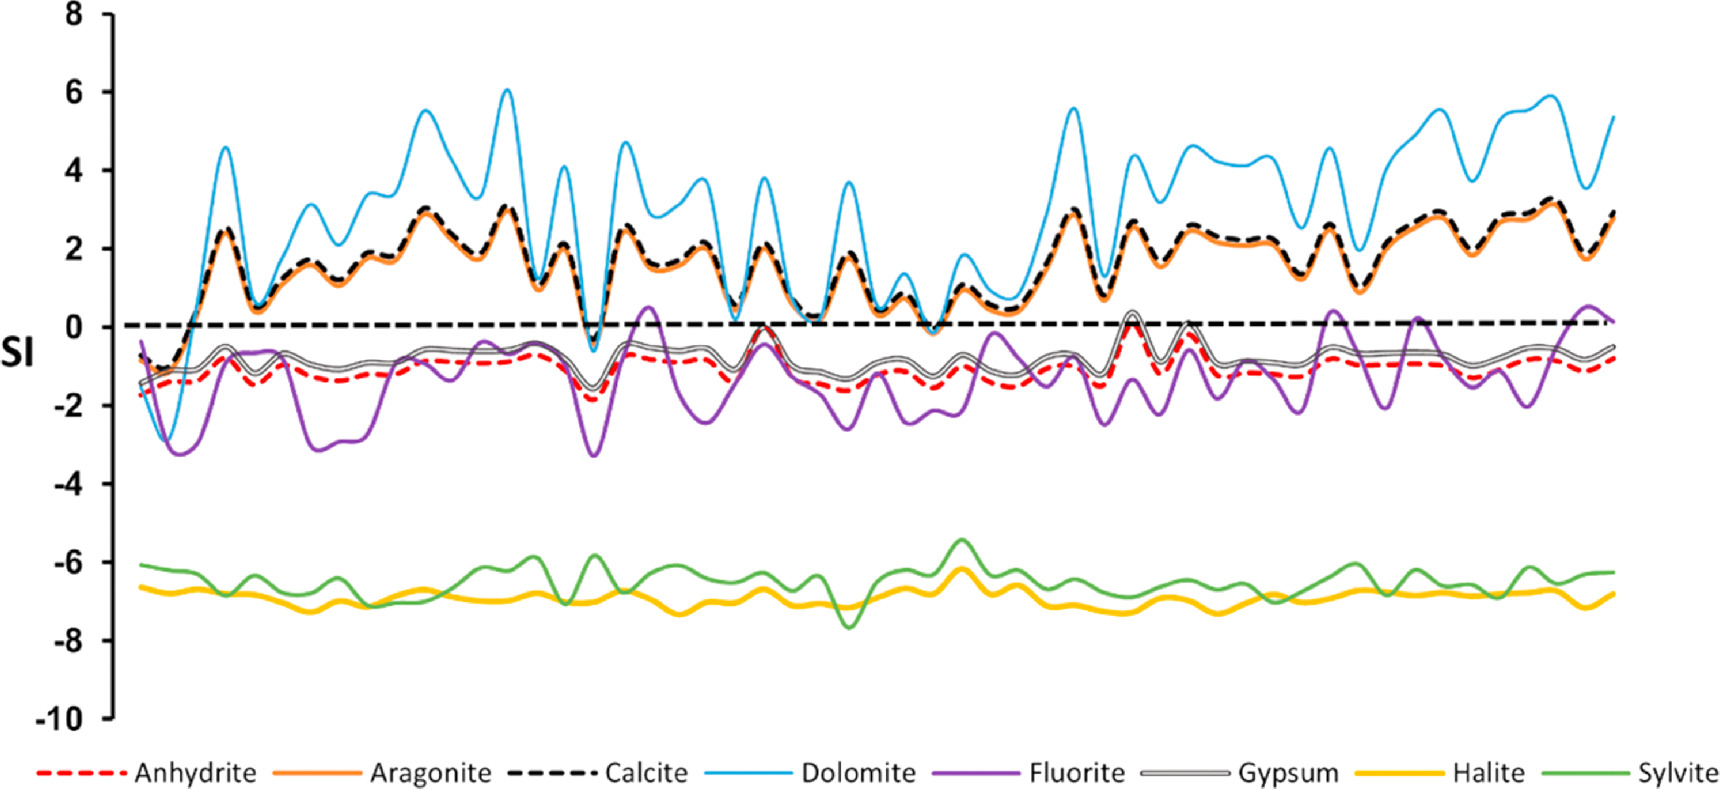
Figure 6. SI for minerals of groundwater and streamwater in the study area.
Download figure:
Standard image High-resolution image
Figure 7. Plot of SI of calcite versus Ca2+ (a), and plot of SI of dolomite versus Mg2+ (b).
Download figure:
Standard image High-resolution image4.4. Water quality evaluation for drinking and domestic use
4.4.1. Water quality assessment based on physicochemical parameters and indicators
The analysis of physicochemical parameters and indicators (table 2) reveals that the pH values in the majority of water samples meet the safety standards outlined in Vietnamese regulations (QCVN 01-1:2018/BYT 2018) and the guidelines set by the World Health Organization (WHO 2022). Specifically, out of the 54 samples, 49 (approximately 90.7%) exhibit pH values within the acceptable range. However, 5 samples (accounting for 9.3%) fall outside these standards. Normally, water is considered clean when it exhibits an electrical conductivity (EC) value of <1,500 μS/cm and a TDS level of <1,000 mg l−1 (QCVN 01-1:2018/BYT 2018, WHO 2022). In the study area, the EC and TDS values of groundwater closely align with those of upstream streamwater and remain below the threshold of 1,500 μS/cm and 1,000 mg l−1, respectively.
According to Vietnam's drinking water standards, water is considered suitable for drinking and domestic use when the NO3 − concentration is <8.86 mg l−1 (QCVN 01-1:2018/BYT 2018). The analysis reveals that 22/22 groundwater samples ( %) have NO3 − concentrations below the 8.86 mg l−1 threshold, meeting the Vietnamese standards for drinking water. Notably, these samples predominantly originate from wells within the deep aquifer. On the other hand, in the case of streamwater, the statistics reveal that 31 out of 32 water samples (approximately 97%) have NO3 − concentrations below 8.86 mg l−1, meeting the Vietnamese standards for safe drinking water. In addtion, only 1 (V12W581) out of 32 samples have NO3 − concentrations exceeding the safe limit, rendering them unsuitable for drinking water purposes. However, it is noteworthy that all of these samples fall within the safety thresholds recommended by the World Health Organization (WHO 2022). With the exception of the streamwater sample V12W558, which exceeds the allowable threshold with an NH4 + concentration of 0.6 mg l−1, both the F− and NH4 + values in groundwater and streamwater samples within the study area are well within the acceptable limits as per Vietnamese standards for drinking and domestic water QCVN 01-1:2018/BYT 2018 (table 2).
The analysis of trace elements included Al, Fe, Mn, As, Cr, Cu, Hg, Pb, Zn, and Sb (table 4). In the majority of groundwater and streamwater samples collected within the study area, these trace elements were found to be present in very low concentrations, notably falling below the recommended levels outlined in the Vietnam standard for drinking water QCVN 01-1:2018/BYT 2018 as well as the standards established by the World Health Organization (WHO 2022). For most samples, these trace elements were either undetectable or were detected at concentrations well below established safety limits. However, in a few samples, elements like Fe, Mn, and Al were detected at levels that were above the detection limits, though they still remained within safe levels.
Table 4. Contents of trace elements in the Nam Mu River basin.
| Sample | Al | Fe | Mn | As | Cd | Cr | Cu | Hg | Pb | Zn | Sb |
|---|---|---|---|---|---|---|---|---|---|---|---|
| Groundwater on Permian felsic volcanic rocks | |||||||||||
| V12U534 | 0.0332 | 0.0246 | 0.0027 | <0.0005 | <0.0005 | <0.0005 | 0.0006 | <0.0005 | <0.0005 | 0.0039 | 0.0014 |
| V12U509 | 0.0005 | 0.0118 | 0.0005 | <0.0005 | <0.0005 | <0.0005 | <0.0005 | <0.0005 | <0.0005 | <0.0005 | <0.0005 |
| V12U516 | 0.0005 | 0.0040 | 0.0005 | <0.0005 | <0.0005 | <0.0005 | <0.0005 | <0.0005 | <0.0005 | <0.0005 | <0.0005 |
| V12U581 | 0.0048 | 0.0208 | 0.0005 | <0.0005 | <0.0005 | <0.0005 | 0.0007 | <0.0005 | 0.0007 | 0.0090 | 0.0016 |
| V12U588 | 0.0342 | 0.0682 | 0.0036 | <0.0005 | <0.0005 | <0.0005 | 0.0007 | <0.0005 | 0.0007 | 0.0092 | 0.0079 |
| Streamwater on Permian felsic volcanic rocks | |||||||||||
| V12W534 | 0.1245 | 0.0767 | 0.0119 | <0.0005 | <0.0005 | <0.0005 | 0.0018 | <0.0005 | <0.0005 | 0.0050 | 0.0049 |
| V12W609 | 0.0239 | 0.0460 | 0.0025 | <0.0005 | <0.0005 | <0.0005 | 0.0009 | <0.0005 | 0.0006 | 0.0064 | 0.0049 |
| V12W509 | 0.0005 | 0.0064 | 0.0005 | <0.0005 | <0.0005 | <0.0005 | <0.0005 | <0.0005 | <0.0005 | <0.0005 | <0.0005 |
| V12W516 | 0.0005 | 0.0930 | 0.0011 | <0.0005 | <0.0005 | <0.0005 | <0.0005 | <0.0005 | <0.0005 | <0.0005 | <0.0005 |
| V12W525 | 0.0005 | 0.0185 | 0.0005 | <0.0005 | <0.0005 | <0.0005 | <0.0005 | <0.0005 | <0.0005 | <0.0005 | <0.0005 |
| V12W546 | 0.0628 | 0.5988 | 0.1240 | <0.0005 | <0.0005 | <0.0005 | 0.0038 | <0.0005 | 0.0006 | 0.0237 | 0.0070 |
| V12W556 | 0.0378 | 0.1607 | 0.1041 | <0.0005 | <0.0005 | <0.0005 | 0.0009 | <0.0005 | 0.0007 | 0.0108 | 0.0041 |
| V12W576 | 0.0117 | 0.0616 | 0.0366 | <0.0005 | <0.0005 | <0.0005 | 0.0008 | <0.0005 | 0.0007 | 0.0073 | 0.0063 |
| V12W581 | 0.0069 | 0.4408 | 0.0712 | 0.0006 | <0.0005 | <0.0005 | 0.0011 | <0.0005 | 0.0008 | 0.0064 | 0.0030 |
| V12W582 | 0.0283 | 0.0481 | 0.0013 | <0.0005 | <0.0005 | <0.0005 | 0.0011 | <0.0005 | 0.0029 | 0.0098 | 0.0027 |
| V12W588 | 0.0486 | 0.2741 | 0.0294 | <0.0005 | <0.0005 | <0.0005 | 0.0007 | <0.0005 | 0.0007 | 0.0085 | 0.0018 |
| Groundwater on Triassic sedimentary rock | |||||||||||
| V12U532/2 | 0.0005 | 0.0158 | 0.0005 | <0.0005 | <0.0005 | <0.0005 | <0.0005 | <0.0005 | <0.0005 | <0.0005 | <0.0005 |
| V12U508 | 0.0005 | 0.1074 | 1.8167 | <0.0005 | <0.0005 | <0.0005 | <0.0005 | <0.0005 | <0.0005 | <0.0005 | <0.0005 |
| V12U513 | 0.0840 | 0.0893 | 0.0057 | <0.0005 | <0.0005 | 0.0006 | 0.0028 | <0.0005 | <0.0005 | 0.0038 | 0.0062 |
| V12U522 | 0.0005 | 0.0025 | 0.0005 | <0.0005 | <0.0005 | <0.0005 | <0.0005 | <0.0005 | <0.0005 | <0.0005 | <0.0005 |
| V12U532 | 0.0005 | 0.0041 | 0.0005 | <0.0005 | <0.0005 | <0.0005 | <0.0005 | <0.0005 | <0.0005 | <0.0005 | <0.0005 |
| V12U541 | 0.0447 | 0.0457 | 0.0005 | <0.0005 | <0.0005 | 0.0009 | 0.0005 | <0.0005 | <0.0005 | 0.0027 | 0.0023 |
| V12U543 | 0.0157 | 0.0168 | 0.0094 | <0.0005 | <0.0005 | <0.0005 | 0.0010 | <0.0005 | 0.0005 | 0.0029 | 0.0066 |
| V12U551 | 0.3047 | 0.4147 | 0.0448 | <0.0005 | <0.0005 | 0.0004 | 0.0009 | <0.0005 | <0.0005 | 0.0031 | 0.0047 |
| V12U560 | 0.0149 | 0.0525 | 0.0105 | <0.0005 | <0.0005 | 0.0082 | 0.0006 | <0.0005 | <0.0005 | 0.0032 | 0.0017 |
| V12U561 | 0.0204 | 0.0268 | 0.0024 | <0.0005 | <0.0005 | 0.0020 | 0.0008 | <0.0005 | <0.0005 | 0.0040 | 0.0046 |
| V12U565 | 0.0069 | 0.0158 | 0.0056 | <0.0005 | <0.0005 | <0.0005 | 0.0007 | <0.0005 | <0.0005 | 0.0030 | 0.0037 |
| V12U567 | 0.0321 | 0.4192 | 0.1246 | <0.0005 | <0.0005 | <0.0005 | 0.0009 | <0.0005 | 0.0011 | 0.0082 | 0.0103 |
| V12U573 | 0.0549 | 0.0611 | 0.0022 | <0.0005 | <0.0005 | <0.0005 | 0.0010 | <0.0005 | <0.0005 | 0.0037 | 0.0067 |
| V12U590 | 0.0005 | 0.0123 | 0.0009 | <0.0005 | <0.0005 | <0.0005 | 0.0006 | <0.0005 | 0.0006 | 0.0182 | 0.0066 |
| V12U590/D | 0.0125 | 0.0169 | 0.0020 | <0.0005 | <0.0005 | <0.0005 | 0.0012 | <0.0005 | 0.0007 | 0.0283 | 0.0043 |
| V12U599 | 0.0053 | 0.0177 | 0.0004 | <0.0005 | <0.0005 | <0.0005 | 0.0005 | <0.0005 | 0.0007 | 0.0104 | <0.0005 |
| V12U604 | 0.0049 | 0.0145 | 0.0005 | <0.0005 | <0.0005 | <0.0005 | 0.0007 | <0.0005 | 0.0006 | 0.0217 | 0.0012 |
| V12U608 | 0.1633 | 0.0166 | 0.0115 | <0.0005 | <0.0005 | 0.0008 | 0.0016 | <0.0005 | 0.0007 | 0.0117 | 0.0044 |
| Streamwater on Triassic sedimentary rock | |||||||||||
| V12W522 | 0.0005 | 0.0113 | 0.0096 | <0.0005 | <0.0005 | <0.0005 | <0.0005 | <0.0005 | <0.0005 | <0.0005 | <0.0005 |
| V12W560 | 0.0512 | 0.0909 | 0.0341 | 0.0008 | <0.0005 | 0.0007 | 0.0006 | <0.0005 | <0.0005 | 0.0025 | 0.0032 |
| V12W513 | 0.0005 | 0.0771 | 0.0059 | <0.0005 | <0.0005 | <0.0005 | <0.0005 | <0.0005 | <0.0005 | <0.0005 | <0.0005 |
| V12W514 | 8.2777 | 0.0005 | 0.0304 | <0.0005 | 0.0005 | 0.0012 | 0.0061 | <0.0005 | <0.0005 | 0.0002 | 0.0005 |
| V12W529 | 0.0005 | 0.0742 | 0.0189 | <0.0005 | <0.0005 | <0.0005 | <0.0005 | <0.0005 | <0.0005 | <0.0005 | <0.0005 |
| V12W532 | 0.0005 | 0.0329 | 0.0173 | <0.0005 | <0.0005 | <0.0005 | <0.0005 | <0.0005 | <0.0005 | <0.0005 | <0.0005 |
| V12W539 | 0.0266 | 0.0364 | 0.0006 | <0.0005 | <0.0005 | 0.0006 | 0.0006 | <0.0005 | <0.0005 | 0.0037 | 0.0026 |
| V12W541 | 0.0287 | 0.1002 | 0.0197 | <0.0005 | <0.0005 | 0.0005 | 0.0007 | <0.0005 | <0.0005 | 0.0033 | 0.0040 |
| V12W543 | 0.0172 | 0.0194 | 0.0005 | <0.0005 | <0.0005 | 0.0005 | 0.0006 | <0.0005 | <0.0005 | 0.0026 | 0.0071 |
| V12W544 | 0.0133 | 0.2699 | 0.0627 | <0.0005 | <0.0005 | <0.0005 | 0.0006 | <0.0005 | <0.0005 | 0.0029 | 0.0082 |
| V12W545 | 0.0606 | 0.1037 | 0.0315 | <0.0005 | <0.0005 | <0.0005 | 0.0009 | <0.0005 | <0.0005 | 0.0035 | 0.0043 |
| V12W558 | 0.0087 | 0.1268 | 0.0422 | <0.0005 | <0.0005 | <0.0005 | 0.0007 | <0.0005 | 0.0006 | 0.0075 | 0.0069 |
| V12W566 | 0.0090 | 0.0321 | 0.0033 | <0.0005 | <0.0005 | <0.0005 | 0.0014 | <0.0005 | 0.0007 | 0.0088 | 0.0083 |
| V12W567 | 0.0458 | 0.1237 | 0.0495 | <0.0005 | <0.0005 | <0.0005 | 0.0012 | <0.0005 | 0.0007 | 0.0068 | 0.0025 |
| V12W590 | 0.0005 | 0.0568 | 0.0089 | <0.0005 | <0.0005 | <0.0005 | 0.0008 | <0.0005 | 0.0008 | 0.0074 | 0.0056 |
| V12W590/2 | 0.0187 | 0.0708 | 0.0055 | <0.0005 | <0.0005 | <0.0005 | 0.0007 | <0.0005 | 0.0008 | 0.0078 | 0.0045 |
| V12W596 | 0.0030 | 0.0816 | 0.0432 | <0.0005 | <0.0005 | <0.0005 | 0.0023 | <0.0005 | 0.0006 | 0.0069 | 0.0052 |
| V12W599 | 0.0130 | 0.0293 | 0.0131 | <0.0005 | <0.0005 | <0.0005 | 0.0012 | <0.0005 | 0.0006 | 0.0066 | 0.0059 |
| V12W601 | 0.0181 | 0.1302 | 0.1560 | 0.0007 | <0.0005 | <0.0005 | 0.0008 | <0.0005 | 0.0007 | 0.0086 | 0.0045 |
| V12W604 | 0.0131 | 0.1320 | 0.0318 | <0.0005 | <0.0005 | <0.0005 | 0.0014 | <0.0005 | 0.0005 | 0.0070 | 0.0046 |
| V12W608 | 0.0025 | 0.0167 | 0.0073 | <0.0005 | <0.0005 | <0.0005 | 0.0006 | <0.0005 | 0.0006 | 0.0061 | 0.0059 |
| QCVN 01-1:2018/ BYT | 0.20 | 0.30 | 0.10 | 0.01 | 0.0030 | 0.05 | 1.00 | 0.0010 | 0.01 | 2.00 | 0.02 |
| WHO ( 2022 ) | — | — | — | 0.01 | — | — | 2.00 | 0.0060 | 0.01 | 3.00 | 0.02 |
Fe2+, Fe3+ and Mn2+ are naturally occurring ions that are commonly found in soil, rocks, and minerals, and they often coexist. Their solubility in water is dependent on the availability of oxygen within the water. In the context of this study, the total iron concentration in groundwater samples was observed to range from 0.00253 to 0.41924 mg l−1, with an average concentration of 0.06887 mg/l. Among the groundwater samples, there are 2 out of 22 samples (approximately 9.1%) were found to have total iron concentrations that exceeded the Vietnamese standard for drinking water QCVN 01-1:2018/BYT 2018 (table 4). The Fe concentration in streamwater samples exhibited a range from 0.0005 to 0.59875 mg l−1, with an average concentration of 0.10754 mg/l. Out of the 32 streamwater samples analyzed, 2 samples (around 6.3%) were observed to have total iron concentrations that exceeded the drinking water standards QCVN 01-1:2018/BYT 2018 (table 4). The Mn concentration of groundwater samples was observed to vary between 0.00042 and 1.8167 mg l−1, with an average concentration of 0.09736 mg/l. Notably, 2 out of the 22 groundwater samples (approximately 9.1%) were found to have Mn concentrations that exceeded the standards established for drinking water in Vietnam QCVN 01-1:2018/BYT 2018. Besides, the Mn concentration in streamwater samples was found to range from 0.0005 to 0.15604 mg l−1, with an average concentration of 0.03048 mg/l. Among 32 stream samples, there are 3 samples, about 9.4%, exhibited manganese concentrations that exceeded the Vietnam standards for drinking water (table 4).
4.4.2. Water quality assessment using Water Quality Index (WQI)
Groundwater and surface water are primary sources of water supply for domestic, agricultural, and industrial purposes (Shinde and Ningwal 2013, and Osta et al 2020). Consequently, assessing water quality is a vital parameter that demands continuous monitoring and evaluation. In this study, the quality of both groundwater and upstream streamwater was evaluated, particularly regarding domestic use, utilizing the WQI method. All water quality parameters monitored during the dry season in the study area are statistically displayed according to the minimum (Min.), maximum (Max.), and average (Mean) values of the data set (table 5). Major parameters including pH, TDS, TH, Cl−, SO4 2−, NO3 −, NH4 +, Fe, Mn and F− in water samples are compared with clean domestic water according to National technical regulations on quality of clean water used for domestic purposes QCVN 01-1:2018/BYT 2018 (table 5). The WQI index is calculated according to the arithmetic ranking method depending on the weight of the above mentioned domestic parameters. The results of the WQI assessment provided in table 5 and figure 8 illustrates that the majority of water samples, including both groundwater and streamwater, received ratings of 'very good' and 'good' in terms of water quality. This indicates that the water is well-suited for drinking and domestic purposes. According to geological formations, water samples within Permian felsic volcanic eruption formations, both in streamwater and groundwater, are generally well-suited for domestic water use. Specifically, in the case of groundwater, all samples fall within the 'very good' category with a WQI of less than 25 (table 6). For streamwater, 54.55% of samples achieved a WQI score of less than 25, signifying very good water quality. In addition, 18.18% of samples fell within the 26–50 WQI range, indicating good water quality. However, 9.09% of samples had WQI values between 51 and 75, which reflects poor water quality, and the same percentage of samples had WQI values exceeding 100, signifying very poor water quality. The water quality is classified as very poor and unsuitable for daily use, primarily due to the elevated levels of Fe and Mn surpassing standards (tables 5 and 6).
Table 5. WQI at individual sampling site.
| No | Sample | Water and Rock type | pH | TDS mg/L | TH mg/L | Cl- mg/L | SO42- mg/L | NO3- mg/L | NH4+ mg/L | Fe mg/L | Mn mg/L | F mg/L | WQI | Water quality status |
|---|---|---|---|---|---|---|---|---|---|---|---|---|---|---|
| 1 | V12U516 | Groundwater, Permian felsic volcanic rock | 6.20 | 30 | 3 | 3.12 | 2.64 | 1.41 | 0.05 | 0.0040 | 0.0005 | 0.146 | 3.38 | Very good water |
| 2 | V12U588 | Groundwater, Permian felsic volcanic rock | 6.90 | 38 | 5 | 2.50 | 3.00 | 1.04 | 0.05 | 0.0682 | 0.0036 | 0.005 | 8.73 | Very good water |
| 3 | V12U509 | Groundwater, Permian felsic volcanic rock | 7.40 | 25 | 3 | 2.81 | 3.20 | 0.99 | 0.05 | 0.0118 | 0.0005 | 0.083 | 3.52 | Very good water |
| 4 | V12U534 | Groundwater, Permian felsic volcanic rock | 5.90 | 24 | 3 | 3.12 | 3.58 | 2.01 | 0.05 | 0.0236 | 0.0027 | 0.005 | 5.80 | Very good water |
| 5 | V12U581 | Groundwater, Permian felsic volcanic rock | 6.70 | 28 | 3 | 2.50 | 2.00 | 2.65 | 0.05 | 0.0208 | 0.0005 | 0.005 | 3.98 | Very good water |
| 6 | V12W534 | Streamwater, Permian felsic volcanic rock | 7.40 | 23 | 3 | 2.80 | 3.10 | 1.80 | 0.05 | 0.0767 | 0.0119 | 0.03 | 14.54 | Very good water |
| 7 | V12W609 | Streamwater, Permian felsic volcanic rock | 8.3 | 49 | 7 | 3.1 | 3.2 | 0.3 | 0.1 | 0.0460 | 0.0025 | 0.1 | 9.29 | Very good water |
| 8 | V12W509 | Streamwater, Permian felsic volcanic rock | 7.4 | 24 | 5 | 2.51 | 3.02 | 2.08 | 0.10 | 0.0064 | 0.0005 | 0.031 | 5.06 | Very good water |
| 9 | V12W516 | Streamwater, Permian felsic volcanic rock | 7.3 | 21 | 3 | 3.12 | 3.25 | 0.75 | 0.10 | 0.0930 | 0.0011 | 0.024 | 11.01 | Very good water |
| 10 | V12W525 | Streamwater, Permian felsic volcanic rock | 9.3 | 18 | 3 | 3.01 | 2.85 | 1.52 | 0.050 | 0.0185 | 0.0005 | 0.010 | 4.69 | Very good water |
| 11 | V12W546 | Streamwater, Permian felsic volcanic rock | 7.3 | 29 | 4 | 3.12 | 6.03 | 1.79 | 0.100 | 0.5988 | 0.1240 | 0.046 | 117.66 | Very poor water |
| 12 | V12W556 | Streamwater, Permian felsic volcanic rock | 7.7 | 30 | 4 | 4.37 | 6.35 | 1.49 | 0.05 | 0.1607 | 0.1041 | 0.010 | 75.00 | Medium water |
| 13 | V12W576 | Streamwater, Permian felsic volcanic rock | 6.9 | 25 | 3 | 3.74 | 3.17 | 1.17 | 0.20 | 0.0616 | 0.0366 | 0.017 | 33.86 | Good water |
| 14 | V12W581 | Streamwater, Permian felsic volcanic rock | 7.0 | 80 | 13 | 7.80 | 5.06 | 9.49 | 0.25 | 0.4408 | 0.0712 | 0.010 | 82.04 | Poor water |
| 15 | V12W582 | Streamwater, Permian felsic volcanic rock | 7.1 | 35 | 5 | 3.12 | 3.26 | 0.95 | 0.20 | 0.0481 | 0.0013 | 0.131 | 12.25 | Very good water |
| 16 | V12W588 | Streamwater, Permian felsic volcanic rock | 7.1 | 37 | 4 | 3.12 | 3.01 | 0.88 | 0.20 | 0.2741 | 0.0294 | 0.070 | 43.72 | Good water |
| 17 | V12U508 | Groundwater, Triassic sedimentary rock | 6.60 | 110.79 | 21.91 | 2.81 | 3.67 | 1.46 | 0.25 | 0.1074 | 1.8167 | 0.04 | 1,098.20 | Very poor water |
| 18 | V12U513 | Groundwater, Triassic sedimentary rock | 8.00 | 38 | 8 | 2.81 | 3.20 | 0.83 | 0.05 | 0.0893 | 0.0057 | 0.004 | 11.80 | Very good water |
| 19 | V12U522 | Groundwater, Triassic sedimentary rock | 7.70 | 30 | 5 | 2.81 | 2.83 | 0.44 | 0.05 | 0.0025 | 0.0005 | 0.005 | 2.80 | Very good water |
| 20 | V12U532 | Groundwater, Triassic sedimentary rock | 7.90 | 49 | 10 | 3.12 | 3.00 | 0.70 | 0.05 | 0.0041 | 0.0005 | 0.005 | 3.02 | Very good water |
| 21 | V12U541 | Groundwater, Triassic sedimentary rock | 7.90 | 52 | 9 | 3.43 | 3.58 | 0.18 | 0.05 | 0.0457 | 0.0005 | 0.045 | 5.83 | Very good water |
| 22 | V12U543 | Groundwater, Triassic sedimentary rock | 8.40 | 137 | 29 | 3.12 | 5.00 | 0.29 | 0.05 | 0.0168 | 0.0094 | 0.033 | 9.45 | Very good water |
| 23 | V12U551 | Groundwater, Triassic sedimentary rock | 8.10 | 77 | 15 | 2.81 | 5.66 | 0.44 | 0.05 | 0.4147 | 0.0448 | 0.023 | 56.62 | Medium water |
| 24 | V12U561 | Groundwater, Triassic sedimentary rock | 8.50 | 162 | 34 | 2.81 | 6.22 | 0.81 | 0.05 | 0.0268 | 0.0024 | 0.051 | 6.07 | Very good water |
| 25 | V12U565 | Groundwater, Triassic sedimentary rock | 8.00 | 102 | 20 | 3.12 | 6.2 | 1.12 | 0.05 | 0.0158 | 0.0056 | 0.013 | 6.93 | Very good water |
| 26 | V12U567 | Groundwater, Triassic sedimentary rock | 6.80 | 79 | 16 | 3.74 | 7.06 | 5.33 | 0.05 | 0.4192 | 0.1246 | 0.060 | 104.44 | Very poor water |
| 27 | V12U573 | Groundwater, Triassic sedimentary rock | 8.10 | 62 | 12 | 2.81 | 4.71 | 0.65 | 0.05 | 0.0611 | 0.0022 | 0.043 | 8.00 | Very good water |
| 28 | V12U590 | Groundwater, Triassic sedimentary rock | 8.00 | 116 | 23 | 3.12 | 6.50 | 2.28 | 0.05 | 0.0123 | 0.0009 | 0.036 | 4.02 | Very good water |
| 29 | V12U590/D | Groundwater, Triassic sedimentary rock | 8.00 | 118 | 23 | 3.43 | 6.92 | 2.60 | 0.05 | 0.0169 | 0.0020 | 0.040 | 5.02 | Very good water |
| 30 | V12U599 | Groundwater, Triassic sedimentary rock | 6.70 | 185 | 39 | 3.43 | 5.36 | 1.68 | 0.05 | 0.0177 | 0.0004 | 0.165 | 4.08 | Very good water |
| 31 | V12U604 | Groundwater, Triassic sedimentary rock | 6.80 | 183 | 38 | 3.12 | 4.71 | 1.21 | 0.05 | 0.0145 | 0.0005 | 0.014 | 3.44 | Very good water |
| 32 | V12U608 | Groundwater, Triassic sedimentary rock | 7.10 | 200 | 44 | 3.43 | 4.50 | 4.34 | 0.05 | 0.0166 | 0.0115 | 0.005 | 10.30 | Very good water |
| 33 | V12U560 | Groundwater, Triassic sedimentary rock | 7.20 | 130 | 25 | 3.43 | 4.71 | 0.65 | 0.05 | 0.0525 | 0.0105 | 0.064 | 11.96 | Very good water |
| 34 | V12W522 | Streamwater, Triassic sedimentary rock | 7.50 | 62 | 13 | 3.43 | 4.15 | 0.69 | 0.10 | 0.0113 | 0.0096 | 0.02 | 10.73 | Very good water |
| 35 | V12W560 | Streamwater, Triassic sedimentary rock | 8.30 | 146 | 32 | 3.12 | 3.67 | 0.14 | 0.05 | 0.0909 | 0.0341 | 0.04 | 28.97 | Very good water |
| 36 | V12W513 | Streamwater, Triassic sedimentary rock | 7.2 | 32 | 6 | 2.64 | 2.11 | 1.42 | 0.10 | 0.0771 | 0.0059 | 0.008 | 12.72 | Very good water |
| 37 | V12W514 | Streamwater, Triassic sedimentary rock | 7.8 | 227 | 45 | 3.65 | 42.19 | 0.65 | 0.10 | 0.0005 | 0.0304 | 0.019 | 22.50 | Very good water |
| 38 | V12W529 | Streamwater, Triassic sedimentary rock | 7.7 | 55 | 11 | 3.43 | 3.67 | 0.87 | 0.10 | 0.0742 | 0.0189 | 0.010 | 20.50 | Very good water |
| 39 | V12W532 | Streamwater, Triassic sedimentary rock | 7.8 | 175 | 39 | 3.43 | 23.30 | 1.90 | 0.10 | 0.0329 | 0.0173 | 0.047 | 17.04 | Very good water |
| 40 | V12W539 | Streamwater, Triassic sedimentary rock | 8.2 | 61 | 12 | 3.43 | 2.83 | 1.14 | 0.050 | 0.0364 | 0.0006 | 0.014 | 5.44 | Very good water |
| 41 | V12W541 | Streamwater, Triassic sedimentary rock | 8.0 | 70 | 14 | 3.12 | 3.20 | 0.88 | 0.050 | 0.1002 | 0.0197 | 0.043 | 20.96 | Very good water |
| 42 | V12W543 | Streamwater, Triassic sedimentary rock | 8.0 | 77 | 15 | 3.43 | 3.20 | 0.44 | 0.10 | 0.0194 | 0.0005 | 0.026 | 6.06 | Very good water |
| 43 | V12W544 | Streamwater, Triassic sedimentary rock | 7.6 | 42 | 8 | 2.81 | 3.58 | 0.70 | 0.10 | 0.2699 | 0.0627 | 0.012 | 59.42 | Medium water |
| 44 | V12W545 | Streamwater, Triassic sedimentary rock | 7.8 | 150 | 33 | 3.12 | 4.90 | 0.52 | 0.050 | 0.1037 | 0.0315 | 0.132 | 28.30 | Very good water |
| 45 | V12W558 | Streamwater, Triassic sedimentary rock | 6.9 | 73 | 14 | 4.68 | 6.06 | 0.36 | 0.60 | 0.1268 | 0.0422 | 0.059 | 57.22 | Medium water |
| 46 | V12W566 | Streamwater, Triassic sedimentary rock | 7.6 | 115 | 23 | 3.12 | 4.71 | 0.22 | 0.05 | 0.0321 | 0.0033 | 0.010 | 6.35 | Very good water |
| 47 | V12W567 | Streamwater, Triassic sedimentary rock | 8.3 | 94 | 20 | 3.43 | 4.71 | 0.52 | 0.20 | 0.1237 | 0.0495 | 0.131 | 46.47 | Good water |
| 48 | V12W590 | Streamwater, Triassic sedimentary rock | 8.7 | 93 | 19 | 3.74 | 5.07 | 0.77 | 0.20 | 0.0568 | 0.0089 | 0.048 | 17.86 | Very good water |
| 49 | V12W590/2 | Streamwater, Triassic sedimentary rock | 8.4 | 38 | 7 | 4.37 | 3.57 | 0.65 | 0.20 | 0.0708 | 0.0055 | 0.025 | 16.55 | Very good water |
| 50 | V12W596 | Streamwater, Triassic sedimentary rock | 8.8 | 75 | 14 | 3.43 | 4.80 | 0.50 | 0.20 | 0.0816 | 0.0432 | 0.036 | 39.88 | Good water |
| 51 | V12W599 | Streamwater, Triassic sedimentary rock | 8.1 | 182 | 38 | 4.37 | 6.13 | 1.01 | 0.20 | 0.0293 | 0.0131 | 0.010 | 18.15 | Very good water |
| 52 | V12W601 | Streamwater, Triassic sedimentary rock | 8.7 | 136 | 31 | 3.43 | 5.08 | 0.28 | 0.20 | 0.1302 | 0.1560 | 0.053 | 110.23 | Very poor water |
| 53 | V12W604 | Streamwater, Triassic sedimentary rock | 7.0 | 178 | 37 | 3.74 | 2.92 | 2.22 | 0.05 | 0.1320 | 0.0318 | 0.183 | 30.27 | Good water |
| 54 | V12W608 | Streamwater, Triassic sedimentary rock | 7.9 | 225 | 48 | 4.05 | 5.26 | 1.76 | 0.05 | 0.0040 | 0.0005 | 0.105 | 8.25 | Very good water |
| Mean | 7.62 | 110.17 | 23.17 | 3.35 | 20.39 | 1.33 | 0.10 | 0.09 | 0.05 | 0.07 | ||||
| QCVN01-1:2018 (Si) | 8.50 | 1,000 | 300 | 250 | 250 | 8.86 | 0.39 | 0.3 | 0.1 | 1.5 | ||||
| Ideal value (Ii) | 7.00 | 0 | 0 | 0 | 0 | 0 | 0 | 0 | 0 | 0 | ||||
| Unit weight (Wi) | 0.118 | 0.001 | 0.003 | 0.004 | 0.004 | 0.500 | 3.333 | 3.333 | 10.000 | 0.667 | ||||

Figure 8. WQI values of groundwater and streamwater in the study area.
Download figure:
Standard image High-resolution image
Table 6. The classification of water quality of the Nam Mu River basin according to WQI value.
| WQI value | % of sample | Water quality status | |||
|---|---|---|---|---|---|
| Permian felsic volcanic rock | Triassic sedimentary rocks | ||||
| Groundwater | Streamwater | Groundwater | Streamwater | ||
| 0–25 | 100 | 54.55 | 83.33 | 71.43 | Excellent |
| 26–50 | Nil | 18.18 | Nil | 14.29 | Good |
| 51–75 | Nil | 9.09 | 5.56 | 9.52 | Medium |
| 76–100 | Nil | 9.09 | Nil | Nil | Poor |
| >100 | Nil | 9.09 | 11.11 | 4.76 | Very poor, unsuitable for drinking |
Water samples from Triassic sedimentary rocks are predominantly of good quality, with only a few exceptions that exhibit a water state unsuitable for domestic purposes (WQI > 100). Specifically, groundwater within Triassic sedimentary formations includes 83.33% of samples with a WQI < 25, indicating very good water quality, and 5.56% of samples with a WQI ranging from 51 to 75, signifying a state of poor water quality. However, 11.11% of samples, with WQI > 100, fall into the category of very poor water quality, rendering them unsuitable for domestic purposes, primarily due to elevated levels of NO3 − and iron Fe that exceed established standards (tables 5 and 6). Streamwater in the Triassic sedimentary formation exhibits varying water quality levels. Specifically, 71.43% of samples are classified as having a 'very good' water quality status, 14.29% fall into the 'good' water quality category, and 9.52% are deemed to have 'average' water quality. However, 4.76% of the samples receive the designation of 'very poor' water quality, making them unsuitable for daily use. This unfavorable status is primarily attributed to elevated Mn levels exceeding established standards (tables 5 and 6).
In summary, the assessment of WQI indicators for the water sources in the study area reveals that groundwater and upstream streamwater from both Permian felsic volcanic formations and Triassic terrigenous sediments are generally of suitable quality for domestic purposes. However, some streamwater samples have higher concentrations of Fe, Mn, or NO3 − exceeding established standards. Therefore, in cases where these contaminants are present, water treatment is necessary before domestic use to ensure safety and water quality.
5. Conclusion
In this study, the origin and geochemical evolution of groundwater and streamwater were evaluated using a variety of geochemical methods and models to provide baseline information for water quality management in the Tan Uyen, Than Uyen areas. Based on the obtained results, there are some main conclusions as follows:
- 1.In the dry season, there is a close relationship between groundwater and streamwater, and their chemical composition appears to be similar based on geological formations. The order of major cations and anions were Ca2+ > Mg2+ > Na+ > K+ and HCO3 − > SO4 2− > Cl− > NO3 −, respectively. The study area exhibits two primary water types: Ca2+ - Mg2+ - HCO3 −, which is present in both streamwater and groundwater distributed within the Triassic terrigenous sediments, and mixed water, ranging from Ca2+ - Mg2+ - Cl− to Ca2+ - Na+ - HCO3 −, found in the Permian felsic volcanic formations.
- 2.Hydrogeochemical indices calculated from water chemical composition data suggest that the primary factors coordinating the hydrogeochemical composition of groundwater in the area are the processes of weathering, bedrock dissolution, and the recharge of rainwater and surface water to the aquifer.
- 3.Hydrogeochemical analyses and PHREEQC modeling revealed supersaturation of minerals such as aragonite, calcite, and dolomite, leading to the precipitation of carbonate minerals and a tendency to dissolve fluorite, gypsum, halite and sylvite.
- 4.The WQI water quality assessment index shows that the majority of water samples, including groundwater and streamwater (45/54 samples, about 83%) are at 'very good' and 'good' levels, suitable for drinking purposes of human activities in Tan Uyen and Than Uyen districts, Lai Chau province according to Vietnamese standards QCVN 01-1:2018/BYT 2018. In addition, some upstream water locations need to be treated before being used in human daily activities.
Acknowledgments
This study was funded by the key science and technology projects of VAST under the project code TĐĐHQG.02/21-23, TĐĐHQG.01/21-23. We are grateful to Duong Thi Lim for help with trace element analysis and Pham Thanh Dang, Nguyen Xuan Qua, Vu Hoang Ly, Dang Minh Tuan, Nguyen Trong Tai for their help with official documents and field works. We would like to thank Nguyen Van Hoang, Nguyen Thi Thanh Thuy, Tran Trong Hoa and reviewers for their insightful comments that significantly helped to improve the quality of the manuscript.
Data availability statement
All data that support the findings of this study are included within the article (and any supplementary files).
Conflicts of interest
The authors declare that there is no conflict of interest.