

Abstract
In the present study, a mesocosm experiment with contaminated sediment and clean groundwater using juvenile Oreochromis niloticus was set up to assess the effect of increasing temperature on bioaccumulation of metal in fish muscles (cadmium, chromium, nickel, and lead) and enzymatic activities in fish liver [reduced glutathione (GSH), glutathione reductase (GR), superoxide dismutase (SOD), glutathione transferase (GST), and glutathione peroxidase (GSH Px)]. The trend of temperature variation was Control 1 (0 Watts) < 60 Watts < 100 Watts < Control 2 (200 Watts). After 72 h, there was no observed mortality in Controls 1 and 2; however, the % Survival in 0 Watts reduced to 90.0 ± 4.0%. Furthermore, 60, 100 and 200 Watts had lower rates of survival at 46.0 ± 6.9, 36.0 ± 13.1, and 24.0 ± 11.1% respectively. The calculated bioaccumulation factors (BAFs) for metals was in the trend: Pb > Cd > Cr > Ni. Mean metal pollution index (MPI) in fish muscles was lowest at 0 watts (24 h − 7.86 ± 1.72, 72 h − 25.77 ± 4.56) and highest at 100 watts (24 h − 39.45 ± 1.91, 72 h − 55.82 ± 1.05). Controls 1 and 2 showed no significant difference in the concentration of GSH and GR while showing a significant difference in GST and GSH Px concentrations after 24 and 72 h. Pearson's correlation showed that GSH was inhibited by water temperature and, Cd, Cr, and Pb concentrations in surface water and fish. Therefore, an increase in ambient temperature in an already contaminated environment will increase the bioavailability of metal contaminants leading to an increase in bioaccumulation and exacerbation of oxidative stress in juvenile tilapia.
Export citation and abstract BibTeX RIS

Original content from this work may be used under the terms of the Creative Commons Attribution 4.0 licence. Any further distribution of this work must maintain attribution to the author(s) and the title of the work, journal citation and DOI.
1. Introduction
An aquatic environment could be considered an open system since matter and energy are exchangeable across the boundary between the system and its surrounding [1, 2]. In an aquatic ecosystem contaminated with metallic particulates, an increase in temperature constitutes physical disturbance which disrupts the state of dynamic equilibrium balance at the sediment-water interface; thereby impacting negatively on sediment-water condition [3]. Hence, the sediment which acted initially as a compartment for these metallic pollutants then reverses to function as a metallic source where they experience transformations as a result of this overturn; and are made more available in compatible status and migratable forms. The mechanism of transfer and release of these metallic forms into the water column to cause pollution involves the combination of processes such as ion exchange, dissolution, desorption, advection, diffusion, resuspension, dispersion, and bio-transfer by organisms, degradation of particulate organic matter and so on [4, 5].
Metals occur naturally in the environment and are released in nature through the weathering of rocks [6]. However, anthropogenic activities such as metallurgy, smelting, drilling, mining, landfill dumping, metal-based industries, metal scrapping and lack of proper waste management, also lead to increased metal concentration in the environment [7]. At certain concentrations, some metals could be essential to the proper functioning of living organisms; but exceeding these concentrations, these metals become toxic to life. Some other metals such as Cr, Ni, Pb, and Cd are non-essential and can be toxic at trace amounts [8]. In an aquatic environment, temperature also affects the toxicity of metals [9]; therefore, increasing the temperature will consequently increase toxicity.
Some non-essential metals, such as cadmium, can affect the absorption of essential metals, for example, zinc leading to zinc deficiency [10]. According to Blanc (2016) [11] metals primarily responsible for clinical lung injury are nickel, cadmium and mercury. Cadmium has been associated with neurotoxicity through the induction of neuron cell apoptosis and reactive oxygen species (ROS), hence leading to oxidative damage [12]. Cadmium has also been associated with damage to the kidney (nephrotoxicity) [13] and bone fragility [14].
Some metals such as chromium can be essential in small amounts when they exist in a particular oxidative state (Cr (III)) and can be extremely toxic in another oxidative state (Cr (VI) [15, 16]. Human exposure to Cr could lead to respiratory issues [17], damage to renal systems [18], hepatic effects [19], cardiovascular damage [20], gastrointestinal damage [21], dermal problems [22], immunological interference [23] and, reproductive and developmental disruption [24, 25]. Similar effects have been observed in non-humans [26].
The system most vulnerable when exposed to lead is the nervous system and its organs [27]. Chronic exposure to lead may lead to paralysis, delirium, coma, ataxia, convulsion and death [28, 29]. Exposure to lead can also cause blood-related diseases such as hypochromic, normocytic, and sideroblastic anaemia [30]. This happens through a lead-induced inhibition of heme synthesizing enzymes and iron transport [27]. Pb exposure can also lead to kidney damage [31], cardiovascular diseases [32, 33], endocrine disruption [34, 35] and bone disease [36] mong other negative effects [37, 38].
Through inhalation exposure, nickel toxicity particularly puts the lungs and brain at risk [39, 40]. Dermal contact with Ni can also cause dermatitis and other skin allergies [41, 42]. According to Hauptman et al (1993) [43], ocular exposure to Ni2+ causes lesions and retinal malformations in Xenopus embryos. Furthermore, Ni exposure increases the risk of endocrine disruption [44, 45].
Oxidative stress is the disparity between the generation of free radicals and reactive metabolites, so-called oxidants or reactive oxygen species (ROS), and antioxidants which are the protective mechanisms for eliminating them [46]. Hence, when ROS are produced in excess relative to the antioxidant defence, oxidative stress is said to have occurred [47]. This pro–oxidant-antioxidant imbalance can lead to damage to DNA molecules and other cellular components [48]. Metal ion-induced oxidative stress occurs by the binding of metal ions to biological thiols (particularly glutathione and metallothionein) thereby leading to the depletion of cellular reductants [49]. The catalysis by metal–protein complexes of redox reactions can also occur between biomolecules and H2O2 leading to oxidative stress [50, 51]. Another mechanism of metal-induced oxidative stress can be based on the allergenic activities of these metals leading to inflammation in cells, resulting in an increased release of ROS as a response [52–54].
Some antioxidant enzymes include glutathione (GSH), glutathione reductase (GR), glutathione transferase (GST), glutathione peroxidase (GSH Px) and superoxidase dismutase (SOD). GSH is a tripeptide commonly found in the liver, although it exists in other tissues, and is produced to protect the liver from damage, i.e., it can serve as a biomarker for liver damage [55]. GR is a protein that contains two polypeptide chains and aids in glutathione recycling by catalysing the reduction of oxidised glutathione (glutathione dismutase [GSSH]) to GSH; a reaction driven by NADPH [56]. GSH Px is a cytosolic enzyme responsible for the catalytic reduction of the peroxide radical and hydrogen peroxide into less toxic substances [57, 58]. GST also serves as a defence mechanism against ROS by catalysing the reaction GSH sulfydryl group which reacts with xenobiotic electrophilic sites, forming easily excretable and less toxic conjugates [59, 60]. SOD catalyses the dismutation reaction of superoxide radicals (O– 2) to form hydrogen peroxide and oxygen [61].
Global climate change is predicted to increase the environmental temperature by 1.5 °C–2.0 °C by the year 2050 [62]; this increase in ambient temperature will consequently cause an increase in water temperature [63]. According to Echeverrı́a et al (2003) [64] and Echeverría et al (2005) [65] sorption of metals is increased when the temperature increases. Temperature increases metabolism in fish, thereby increasing biochemical activities which enhances the accumulation of environmental substances such as metals [66]. Coupled with pH and electrode potential, temperature also increases the bioavailability of metals in surface water leading to an ease in epidermal adsorption [67–70].
Temperature affects water chemistry; it is knowns that increasing temperature increases the rate of chemical reactions. Studies have shown that an increasing ambient temperature has resulted in river temperature rise [63, 71]. Temperature is an intensive variable of a system, which quantifies the average degree of heat energy flowing in or out of a system [72]. An increase in atmospheric temperature raises the inflow of heat into a system, producing sufficient energy which is acquired by reactant particulates to surmount the energy of activation to raise the reaction rate [73].
The temperature of the water plays an important role in water quality; the concentration of dissolved oxygen and metabolic activities in water organisms are dependent on the surface water temperature [74]. The kind of organisms that live in rivers and lakes are governed by the temperature variation; as temperature increases beyond conducive levels, the number of individuals that live in an environment reduces [74, 75]. Studies have also reported that aquatic organisms give physiological and behavioural responses to temperature changes [76, 77]. Wilcock et al (1998) [78] recorded a negative correlation between increasing temperature and dissolved oxygen in surface water. Blumberg and Di Toro (1990) [79] predicted that an increase in temperature due to global warming will lead to losses of 1 mg L−1 of dissolved oxygen in the upper layers and of 1–2 mg L−1 in the lower layers of Lake Erie's central basin. Depression of oxygen concentration in polluted surface water increases the effects of pollutants [80].
Kingsolver and Woods (2016) [81] explored the effects of heat shock proteins on larval growth rates and larval growth rate of Manduca sexta. They observed that the maximal growth rate declined with the increasing duration of high-temperature exposure. They also observed that mean growth rates decline with time in diurnally fluctuating temperatures at higher mean temperatures; similar results were also obtained by Martin et al (2018) [82]. Ouellet et al (2013) [83] recorded that temperature increase can lead to fish kill through immunosuppression. On a community level, Porcelli et al (2017) [84] reported that thermal stress can negatively affect the fertility of aquatic organisms. Turschwell et al (2017) [85] also stated that thermal habitat restricts patterns of occurrence in multiple life stages of a headwater fish.
In the Niger Delta region of Nigeria, studies have shown that the increased industrial activities and lack of proper environmental management practices have led to an increase in sediment contamination with heavy metals [86, 87]. As earlier stated, studies have shown that an increase in ambient temperature has resulted in river temperature rise [63, 71]. It is, therefore, important to understand how the global increase in temperature may affect fishes and the aquatic ecosystems in regions with already contaminated sediment.
Thus, this study was designed to assess the mobility of metal concentrations (Cd, Cr, Ni and Pb) from contaminated sediment sampled from the Niger Delta region of Nigeria and their accumulation in tissues of juvenile Oreochromis niloticus due to increasing temperature, as well as assess the concentrations of GSH, GR, SOD, GST, and GSH Px in fish liver.
2. Materials and method
2.1. Sample collection
This study was carried out in February 2021. The collection of samples was within the axes of Woji bridge and situated at 4°48ʹ51.6ʹʹN 7°02ʹ47.0ʹʹE of Woji Creek in Obio/ Akpor Local Government Area of Rivers State, Nigeria (figure 1). A study carried out from August to October 2019 revealed that sediment studied in this location had a pollution load index of 2.58 × 10¹⁵ contributed by Cd, Ni, Fe, Pb and Cu [88]. The sample location is situated under the Woji bridge and potential sources of metal pollution may include deposition of waste from traffic emissions, Port Harcourt Zoo waste effluent, atmospheric depositions from burning, market waste dump, abattoir waste effluent, rusting abandoned scrap metals, construction works waste, abandoned and rusting boats and barges, sewage disposal, urban and industrial effluent discharge, and upstream water flow. Results of earlier studies have shown the accumulation of metals in flora [89] and fauna [90].
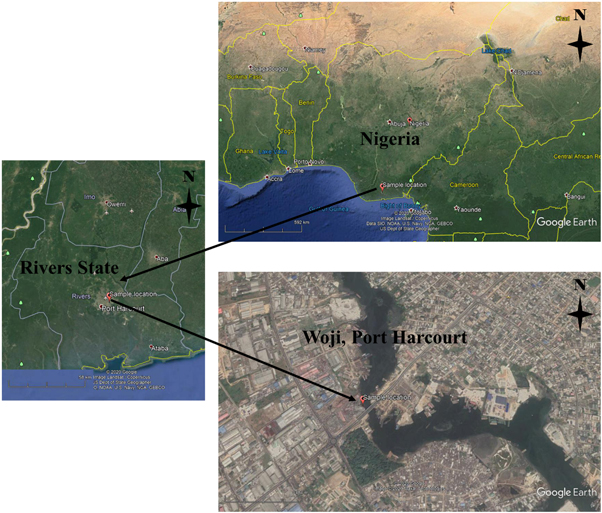
Figure 1. Satellite image of the location for sample collection.
Download figure:
Standard image High-resolution imageSamples were collected perimetrically within 100 m of this location at a depth of ≈5cm using stainless steel Van Veen grab sediment sampler (content 0.5 litres, surface covered 126 cm2). The sediment samples were placed in well-covered plastic buckets (20 litres each) and carefully moved for a mesocosm experimental setup in the laboratory.
2.2. Experimental species
The tilapia species used for this experiment was Oreochromis niloticus (Supplementary Fig. 1 (available online at stacks.iop.org/ERC/4/075008/mmedia)); the species is commonly found in fresh and brackish waters within the Niger Delta region and is a common fish species found in fish markets [91]. The length of the fish was ≈10 cm, while the width was ≈4 cm.
Juvenile fishes were obtained from the African Regional Aquaculture Centre (ARAC), University of Port Harcourt—Aluu in Rivers State. Three days before the experimental setup, the fishes were brought to the laboratory and ambient environmental conditions were maintained for acclimation (12 h in light and 12 h in dark, representing an approximate day and night hours in Nigeria). The fishes were fed throughout this process. In the laboratory, the temperature was provided by the natural environment (without air conditioners).
2.3. Experimental design
The experimental design involved six setups: 0, 60, 100, and 200 Watts, and Controls 1 and 2, set up in triplicate (figure 2). The 60, 100, and 200 Watts represent the wattage of the tungsten bulb used to generate the heat needed within the aquarium. Control 2 also had a 200 Watts bulb; Control 1 and 0 Watts had no external temperature added, hence, representing the ambient temperature. This experimental setup was designed to assess the difference in the effect of temperature alone (Control 2), different temperature variations in the presence of contaminated sediment (60, 100, and 200 Watts), the ambient temperature in the presence of contaminated sediment (0 Watt) and ambient temperature in the presence of a clean environment (Control 1). The bulbs were installed on the cover of the aquariums and connected to an alternating current (AC) power source.

Figure 2. Mesocosm experiment setup of aquariums. A, B and C are replicates of the experimental setup.
Download figure:
Standard image High-resolution imageEach aquarium had a capacity of 70L in volume. In aquariums 0, 60, 100, and 200 Watts, ≈20L of sediment from the contaminated site was added; using a hose, ≈30L of clean tap water was slowly put into each aquarium. However, in Control 1 and 2 aquariums, ≈50L of tap water was added. Aeration pumps were used to introduce air into each aquarium through a silicon tube and air stones.
The temperature increases i.e., switching on the bulbs, were done between 14:00–18:00 (2–6 pm); this time was chosen after observing the trend of water temperature rise in an aquarium due to ambient environmental conditions. Temperature observation was done every 30 min and the experiment ran for 72 h due to the increasing rate of mortality observed.
A total of 50 juveniles were put into each aquarium for the experiment; three fishes were collected for metal (Cd, Cr, Pb, Ni) and biochemical (GSH, GST, SOD, GR, and GSH Px) analyses. The number of dead fishes was observed and recorded in each aquarium to assess the mortality rate.
The sediment used for the experiment was thoroughly mixed before the experiment was set up; samples were collected and analysed for metal concentration. The three fishes and water samples were collected from each aquarium after 24 h and 72 h of the experimental setup. Using scalpel and forceps, the liver in the fish was removed and put into sterile vials and put into a thermo-flask with liquid nitrogen; while the fish muscles were dried in an oven.
2.4. Metal analysis
Dried fishes were homogenised in a blender for digestion. Approximately 0.5g of sediment and fish was weighed and put into digestion bottles. The reagents 65% Nitric acid (HNO3) Extra Pure [company: INEOS CHLOR LIMITED], 37% Hydrochloric acid (HCl) Extra Pure [company: INEOS CHLOR LIMITED], and distilled water (H2O) were used for the digestion of the samples. Approximately 100ml of water, 0.5ml of HNO3, and 5ml of HCl were added to the bottle and reduced to ≈15ml by heating in an oven. The reduced mixture is kept to cool and then filtered into vials [92]. Water samples were analysed by the direct injection method. The GBC SensAA Atomic Absorption spectrophotometer was used to analyse the samples, this equipment has a detection limit of 0.001ppm and involves the use of a flame lamp for each metal analysed. Sample analysis was carried out in triplicates using GBC SensAA Atomic Absorption Spectrophotometer (serial no. A7935Sn) with an instrument detection limit of 0.001 mg/l. To assess the analytical methodology, atomic absorption spectroscopy (AAS) Sigma-Aldrich certified reference materials (CRMs) for each metal were used [93].
A Matrix Spike (MS) was the process used to assess the rate of recovery. This was generated by adding a known amount (a spike) of the analyte to a sample, testing the spiked sample, and determining the amount added that was recovered. The recovery rate of the laboratory analytical method was assessed using two sediment and water samples, to which a spiking solution was added. Percentage recovery (%R) for metals were calculated to be: Pb- 98.7%, Ni- 98.9%, Cd- 100% and Cr- 98.3%. Calibration, blank and spiked sample analysis results can be found in the supplementary file.
2.5. Analysis of fish liver for biochemical activities
Fish liver samples were weighed and homogenised in Phosphate-buffered saline (PBS) of buffer pH 7.0. By the means of centrifugation at 4000G for 30 min using universal 320 Hettich Zentrifugen, the serum was then separated. Separated serum was prepared for analysis using the Elabscience Biochemical Kits [94]. Elabscience Biochemical Kits were produced in Houston, Texas, United States of America. The analysis was done spectrophotometrically using Contec BC300 Semi-auto Biochemistry Analyzer developed in Hebei Province, People's Republic of China.
2.6. Data analysis
Using Past statistics [95], an analysis of variance was performed to analyse the statistically significant difference between Control 1 and other treatments in the experiment (i.e. Control 2, 0, 60, 100, and 200 Watts). Pearson's correlation was performed to assess the relationship between all variables using Python by ANACONDA [96]. Non-metric Multidimensional Scaling (NMDS) was used to give a 2D representation of each treatment and present similarity data using Euclidean distance; hierarchical cluster analysis, an algorithm that groups similar objects into groups called clusters, was used to assess Euclidean similarity between treatments. Both NMDS and hierarchical cluster analysis was performed after data was normalised using PRIMER 6 Version 6.1.6 from PRIMER-E Limited [97].
Percentage mortality (% Mortality) was assessed with equation (1):

Bioaccumulation factors (BAFs) were calculated using equation (2) [98, 99]:

Metal pollution index (MPI) was assessed for metals accumulated in fish tissues for each power source using equation 3 adopted from Keshavarzi et al (2018)[100]:

3. Results and discussion
3.1. Temperature
The mean temperature for the experiment is presented in table 1. The trend of temperature variation was Control 1 (0 Watts) < 60 Watts < 100 Watts < Control 2 (200 Watts). The highest ambient temperature (Control 1 and 0 Watts) was observed at 17:00 (29.10 ± 0.00 and 29.00 ± 0.12 for Control 1 and 0 Watts respectively). Mean temperatures for Control 2 (200 Watts) ranged from 39.73 ± 0.12–27.50 ± 0.35 (39.77 ± 0.15–28.60 ± 1.41). According to public data, the maximum weather temperature in the City of Port Harcourt ranges from 29.0 °C–32.3 °C, while the minimum temperature ranges from 21.6 °C–23.1 °C; the maximum range of temperature in water is 27.1 °C–29.7 °C [101], this is similar to the measured temperature in 0 Watts and Control 1.
Table 1. Mean temperature (°C) variation by time for each experimental control.
| Time | 0 Watts | 60 Watts | 100 Watts | 200 Watts | Control 1 | Control 2 (+200 Watts) |
|---|---|---|---|---|---|---|
| 14:00 | 29.13 ± 0.12 | 29.03 ± 0.06 | 29.13 ± 0.06 | 29.17 ± 0.06 | 29.07 ± 0.06 | 29.23 ± 0.12 |
| 14:30 | 29.13 ± 0.12 | 29.03 ± 0.06 | 29.13 ± 0.05 | 29.17 ± 0.06 | 29.07 ± 0.06 | 29.23 ± 0.12 |
| 15:00 | 29.13 ± 0.12 | 29.03 ± 0.06 | 29.13 ± 0.05 | 29.17 ± 0.06 | 29.07 ± 0.06 | 29.23 ± 0.12 |
| 15:30 | 29.27 ± 0.06 | 30.13 ± 0.06 | 30.20 ± 0.54 | 31.87 ± 0.06 | 29.50 ± 0.29 | 30.23 ± 0.12 |
| 16:00 | 28.90 ± 0.20 | 31.27 ± 0.12 | 32.83 ± 1.65 | 34.27 ± 0.12 | 29.88 ± 0.06 | 32.13 ± 0.12 |
| 16:30 | 29.23 ± 0.12 | 32.07 ± 0.06 | 33.73 ± 1.59 | 37.83 ± 0.06 | 29.53 ± 0.06 | 34.35 ± 0.07 |
| 17:00 | 29.10 ± 0.00 | 33.17 ± 0.06 | 33.87 ± 0.49 | 38.73 ± 0.12 | 29.00 ± 0.12 | 38.70 ± 0.20 |
| 17:30 | 28.90 ± 0.00 | 33.73 ± 0.06 | 34.33 ± 0.28 | 39.77 ± 0.15 | 28.55 ± 0.06 | 39.73 ± 0.12 |
| 18:00 | 27.77 ± 0.06 | 31.07 ± 0.06 | 31.27 ± 1.43 | 37.3 ± 0.10 | 28.18 ± 0.12 | 37.30 ± 0.35 |
| 18:30 | 27.37 ± 0.12 | 28.17 ± 0.06 | 28.57 ± 2.50 | 28.97 ± 0.60 | 27.70 ± 0.12 | 28.50 ± 0.10 |
| 19:00 | 27.30 ± 0.00 | 27.23 ± 0.12 | 27.30 ± 1.76 | 28.60 ± 1.41 | 27.33 ± 0.00 | 27.50 ± 0.35 |
| Mean | 28.66 ± 0.77 | 30.36 ± 2.08 | 30.86 ± 2.46 | 33.17 ± 4.50 | 28.81 ± 0.79 | 32.38 ± 4.42 |
3.2. Fish survival rate
After 72 h, there was no observed mortality in Controls 1 and 2 (at 200 watts); however, the % Survival in 0 Watts reduced from 100% to 90.0 ± 4.0%. Furthermore, 60, 100 and 200 Watts had lower rates of survival amounting to 46.0 ± 6.9, 36.0 ± 13.1, and 24.0 ± 11.1% respectively. There was no statistically significant difference between Control 1 and 2; and Control 1 and 0 Watts (p > 0.05). However, ANOVA revealed a statistically significant difference between Control 1 and 60, 100 and 200 Watts (p < 0.001) (figure 3).
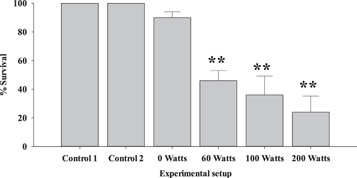
Figure 3. Percentage survival of juvenile tilapia. Asterix (*) represents statistically significant difference, ** - p < 0.001.
Download figure:
Standard image High-resolution imageThe results revealed that only temperature increase (Control 2) did not lead to mortality of fishes; however, in the presence of contaminants, increasing temperature led to a significantly low rate of survival. At higher temperatures, metabolic cellular enzymatic activities increase [102]. High temperatures disrupt hydrogen and disulphide bonds in DNA; it also reduces hydrophobic stabilization due to base-stacking [103, 104].
In a study that assessed the effects of water temperature on the growth and sex ratio of juvenile Oreochromis niloticus; it was noted that although an increase in temperature to 36.9 °C affected growth rate, it did not affect the survival rate of fishes [105]. This result is similar to those observed in the present study. However, according to Pandit et al (2010) [106], the survival rate of fries and juvenile Nile tilapia (9 and 50 days after hatching) reduced from 96 to 57%, and the growth rate reduced from 0.04 to 0.01 g f−1i−1s−1h−1 day−1 as water temperature increased from 27 to 37 °C.
3.3. Metal concentration
3.3.1. Sediment
Mean concentrations of metals in sediment used for the experiment were as follows: Cd—5.29 ± 0.13 mg/kg, Cr—136.6 ± 2.7 mg/kg, Pb—13.97 ± 1.62 mg kg−1 and Ni—0.955 ± 0.021 mg kg−1 (figure 4). Similar results from the same location were obtained by Ibezim-Ezeani et al (2020) [88] and Ibezim-Ezeani and Ihunwo (2020) [86]. Mean concentrations of Cd and Cr in surface sediment sampled from Pearl River Estuary in China (0.46 and 78.37 mg kg−1 respectively) were below those measured in the sediment sample used for this experiment, while the mean concentration of Pb (49.66 mg kg−1) was higher [107].
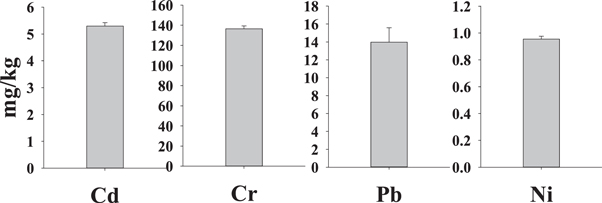
Figure 4. Concentrations of metals in sediment used for the experiment.
Download figure:
Standard image High-resolution imageAlthough the concentration of metals in sediment porewater was not analysed, it is important to note that pore water plays an important role in the bioavailability of contaminants in aquatic ecosystems. The pore acts an an interphase between the solid sediment and the water coloum for the movement of contaminants in the system [108, 109].
3.3.2. Surface water and fish
The concentrations of metals in surface water and fish tissues resulting from the experiment are presented in table 2.
Table 2. Mean metal concentrations in surface water fish tissues.
| Metals | 0 Watts | 60 Watts | 100 Watts | 200 Watts | ||||
|---|---|---|---|---|---|---|---|---|
| 24 h | 72 h | 24 h | 72 h | 24 h | 72 h | 24 h | 72 h | |
| Surface water (mg/L) | ||||||||
| Cd | 0.029 ± 0.020 | 0.039 ± 0.007* | 0.052 ± 0.015** | 0.021 ± 0.005* | 0.066 ± 0.047** | 0.053 ± 0.026** | 0.020 ± 0.007* | 0.002 ± 0.002** |
| Cr | 0.008 ± 0.008 | 0.065 ± 0.009** | 0.176 ± 0.046** | 0.047 ± 0.050** | 0.024 ± 0.013 | 0.094 ± 0.079** | 0.114 ± 0.012** | 0.109 ± 0.051** |
| Pb | 0.046 ± 0.040 | 0.264 ± 0.057** | 0.396 ± 0.171** | 0.439 ± 0.194** | 0.359 ± 0.101** | 0.286 ± 0.072** | 0.544 ± 0.314** | 0.304 ± 0.173** |
| Ni | 0.101 ± 0.044 | 0.057 ± 0.012** | 0.127 ± 0.055** | 0.289 ± 0.247** | 0.068 ± 0.008** | 0.153 ± 0.132** | 0.125 ± 0.061** | 0.131 ± 0.143** |
| Fish (mg/kg dw) | ||||||||
| Cd | 2.11 ± 0.81 | 3.59 ± 0.46 | 4.93 ± 0.64* | 6.07 ± 0.09* | 5.51 ± 1.12* | 8.32 ± 0.44** | 6.18 ± 2.22* | 9.25 ± 0.40** |
| Cr | 7.71 ± 0.12 | 9.38 ± 0.14 | 15.03 ± 2.48 | 13.93 ± 5.73 | 35.82 ± 3.52* | 47.95 ± 2.81** | 27.56 ± 3.65* | 34.42 ± 18.09* |
| Pb | 14.75 ± 14.04 | 310.67 ± 12.73** | 530.70 ± 52.26** | 609.60 ± 7.99** | 549.07 ± 63.86** | 620.96 ± 15.60** | 474.18 ± 40.15** | 590.49 ± 64.8** |
| Ni | 29.45 ± 17.43 | 50.15 ± 26.03 | 29.30 ± 11.45 | 73.63 ± 3.03* | 23.31 ± 3.81 | 39.30 ± 0.98 | 26.01 ± 4.39 | 40.74 ± 0.96 |
Asterix - represents multiple comparisons versus 0 Watts 24 h (Holm-Sidak method): Overall significance level = 0.05, * - p < 0.05, ** - p < 0.001.
ANOVA for metal concentrations in surface water and fish tissues revealed that the differences in the mean values among the treatment groups for all metals were greater than would be expected by chance, hence revealing a statistically significant difference (p < 0.05).
In the present study, the trend of metal concentrations in the surface water and fish (Pb > Ni > Cr > Cd) is similar to a study carried out by Huang et al (2017) [110]. Another study carried out to assess the effect of pH, temperature, dissolved oxygen, and flow rate of overlying water on heavy metals released from storm sewer sediments showed a similar trend (Pb > Cr > Cd) [111].
The concentrations in the fish muscles were much higher than those measured in the surface water. Cd concentration in fish had the lowest concentration across all power conditions and Pb has the highest concentration in fish tissues. There was an observed increase of metals in fish tissues from 24 h to 72 h across all power conditions. Cd, Cr, and Pb showed an increasing trend in concentration from 0 to 100 Watts; however, Ni showed an increase from 0 to 60 Watts which were lower in 100 and 200 Watts (table 2). Similar to this study, Li et al (2013) [111] observed an increase in the release of Cr and Pb from storm sewer sediments under aerobic conditions at higher temperatures (20 °C–35 °C). Therefore, temperature affected the dissolution of metals and consequently increased the bioavailability of the metals in this experiment. According to another study carried out by Başyiğit and Tekin-özan (2013) [112], although metal concentrations in surface water increased in summer corresponding to an increase in surface water temperature, Ni accumulation in fish muscles, gills, and liver was higher in winter than in summer; while the concentration of Cd and Cr were higher in summer than winter.
Metals are taken up by fishes either through dietary means or through the permeation of the epidermis by dissolved metals. According to Förstner (1981) [113], chromium and lead are not readily soluble in water but adhere to particulate matter in aquatic systems and settle to sediment. Hence the higher concentration observed could have been contributed by the fishes feeding on sediment particulate. A similar trend observed in metal concentrations dissolved in surface water and accumulated in fish muscles suggested that the means of uptake by the fish was majorly through the permeation of the fish epidermis. Temperature is one of the factors that affect metal speciation and this could also affect the toxicity of metals [114]. The higher accumulation of metals observed from 60–200 Watts, therefore, could account for the higher rate of mortality in these experimental conditions compared to Control 2 which was exposed to 200 Watts.
3.3.3. Bioaccumulation factors (BAFs)
Results of the estimated BAFs for each metal are presented in figure 5.
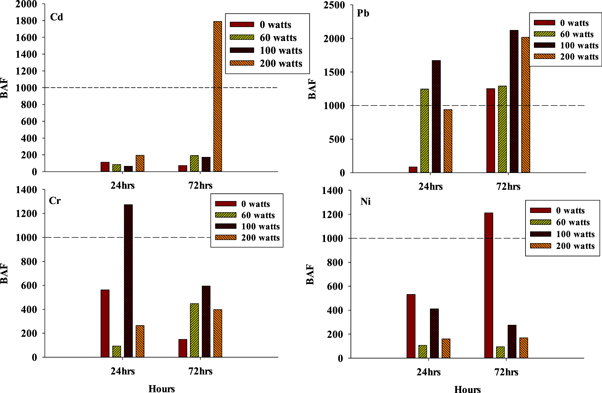
Figure 5. Bioaccumulation factors for each metal.
Download figure:
Standard image High-resolution imageThe calculated BAF for metals was in the trend: Pb > Cd > Cr > Ni (figure 6), this trend was similar to a study carried out by Ahmed et al (2019) [115]. According to Arnot and Gobas (2006) [99], BAF < 1000 means that there is no probability of accumulation, 1000 < BAF < 5000 indicates bioaccumulation and BAF > 5000 is indicative of extreme bioaccumulation. In the present study, BAFs for Cd were all below 1000, except for fish in 200 Watts after 72 h. For Cr, BAFs > 1000 for fishes in 60 watts and 100 watts aquarium after 24 h; however, after 72 h, BAFs < 1000. BAFs calculated for Cr after 24 h were below 1000 except for fishes in 100 watts aquarium; however after 72 h BAFs were all below 1000. BAFs for Ni were all below 1000 after 24 h; after 72 h BAFs values were < 1000 at 60, 100 and 200 watts except for 0 watts with BAFs > 1000 (figure 6). In fishes, Pb binds with Na+-K+-ATPase leading to a non-competitive inhibition of Na+ and Cl− influx [116, 117]. This can lead to high mortality in fishes as their homeostasis is disrupted.

Figure 6. Metal pollution Index.
Download figure:
Standard image High-resolution image3.3.4. Metal pollution index
Mean MPI in fish muscles was lowest at 0 watts (24 h − 7.86 ± 1.72, 72 h − 25.77 ± 4.56) and highest at 100 watts (24 h − 39.45 ± 1.91, 72 h − 55.82 ± 1.05) (figure 6). Usero et al (1997) [118] suggested that higher values of MPI indicate a higher degree of contamination. In the present study, the temperature played a major role in the estimated value of MPI as values increased from 0 watts to 200 watts.
3.4. Oxidative stress
Reduced glutathione (GSH) concentrations were similar in Control 1 and Control 2 after 24 and 72 h; however, in 0, 60 and 200 Watts, there was an initial drop after 24 h and a significant increase after 72 h. GSH concentrations at 100 Watts did not increase from 24- to 72 h; however, the concentration reduced from 10.5 ± 0.55–8.94 ± 0.06 mg/l. This trend was also observed in GR (24 h − 88.16 ± 7.34, 72 h − 65.91 ± 4.30 U/mg), GST (24 h − 43.78 ± 1.26, 72 h − 35.28 ± 1.57 U/mg) and GSH Px (24 h − 14.03 ± 0.07 72 h − 12.62 ± 0.45 μmol/L) (table 3). SOD concentration reduced from 24–72 h in Controls 1 and 2; however, concentration increased was observed from 24–72 h in 0 Watts (7.50 ± 0.43–13.24 ± 0.39 U mL−1), 60 Watts (7.28 ± 0.45–12.62 ± 0.47 U mL−1), 100 Watts (7.28 ± 0.32–12.51 ± 0.53 U mL−1) and 100 Watts (7.57 ± 0.50–13.97 ± 0.76 U mL−1) (table 3). ANOVA revealed statistically significant difference (p < 0.05) for all treatment groups (GSH, GR, SOD, GST and GSH Px).
Table 3. Mean concentrations of Reduced glutathione (GSH), Glutathione reductase (GR), Superoxide dismutase (SOD), Glutathione transferase (GST), and Glutathione peroxidase (GSH Px) in fish liver.
| Activity | Control 1 24 h | Control 1 72 h | Control 2 24 h | Control 2 72 h | 0 Watts 24 h | 0 Watts 72 h | 60 Watts 24 h | 60 Watts 72 h | 100 Watts 24 h | 100 Watts 72 h | 200 Watts 24 h | 200 Watts 72 h |
|---|---|---|---|---|---|---|---|---|---|---|---|---|
| GSH (mg/L) | 18.15 ± 0.14 | 18.36 ± 0.51 | 17.26 ± 0.24 | 19.82 ± 0.45 | 14.12 ± 0.11 * | 29.7 ± 0.51 ** | 6.84 ± 1.05 * | 21.06 ± 0.14 * | 10.5 ± 0.55 ** | 8.94 ± 0.06 ** | 12.11 ± 0.17 * | 24.35 ± 0.43 ** |
| GR (U/mg) | 124.95 ± 1.29 | 122.79 ± 0.34 | 115.36 ± 3.5 | 117.56 ± 4.34 | 104.06 ± 6.03 * | 173.68 ± 3.36 ** | 98.52 ± 0.86 ** | 142.31 ± 1.49 * | 88.16 ± 7.34 ** | 65.91 ± 4.30 ** | 103.83 ± 3.88 * | 206.39 ± 5.1 ** |
| SOD (U/mL) | 11.69 ± 0.86 | 10.86 ± 0.66 | 10.64 ± 0.41 | 10.10 ± 0.99 ** | 7.50 ± 0.43 * | 13.24 ± 0.39 ** | 7.28 ± 0.45 ** | 12.62 ± 0.47 ** | 7.28 ± 0.32 ** | 12.51 ± 0.53 ** | 7.57 ± 0.50 ** | 13.97 ± 0.76 ** |
| GST (U/mg) | 41.56 ± 0.76 | 39.39 ± 0.29 | 54.73 ± 0.46 ** | 49.84 ± 0.78 ** | 63.47 ± 1.19 ** | 71.57 ± 1.00 ** | 26.37 ± 1.27 ** | 49.4 ± 0.56 ** | 43.78 ± 1.26 ** | 35.28 ± 1.57 | 74.69 ± 2.70 ** | 93.91 ± 3.06 ** |
| GSH Px (μmol/L) | 16.96 ± 1.02 | 15.99 ± 0.71 | 19.02 ± 0.41 * | 21.46 ± 0.92 * | 21.31 ± 1.25 ** | 24.16 ± 1.91 ** | 14.22 ± 0.33 * | 16.98 ± 0.05 * | 14.03 ± 0.07 * | 12.62 ± 0.45 ** | 17.29 ± 0.38 * | 24.24 ± 0.63 ** |
Asterix - represents multiple comparisons versus Control 1 24 h (Holm-Sidak method): Overall significance level = 0.05, * - p < 0.05, ** - p < 0.001.
Reactive oxygen species (ROS) are formed when molecular oxygen partially reduces in cells; in the presence of environmental toxins, ROS are formed as by-products of aerobic metabolism [119]. Some of these ROS include superoxide (O2•−) and hydroxyl radicals (OH•), as well as hydrogen peroxide (H2O2) [56]. ROS are generated during the process of cellular oxidative phosphorylation [120]. In cells, superoxidase is one of the most frequently generated ROS [121]; it is highly reactive and also leads to the formation of even more reactive hydroxyl radicals [120]. SOD catalyses the conversion of O2•− to O2 or H2O2 which is further converted to OH• and H2O, a reaction catalysed by GSH Px [122]. Similarly, GSH can aid cells in the detoxification of hydrogen peroxide; in a reaction that used Nicotinamide adenine dinucleotide phosphate (NADPH) as a source of reducing electrons and catalysed by glutathione reductase (GR), the cell generates GSH. Furthermore, catalysed by GSH Px, the generated GSH converts H2O2 to H2O and generates oxidized glutathione (GSSG) [120]. Glutathione transferase enzymes facilitate the conjugation of glutathione which assists in detoxification by binding electrophiles that could otherwise bind to proteins or nucleic acids [123]. In cells, glutathione binds to metals and fat-soluble toxins, hence making them water-soluble and easy for excretion [124]. When there is a disturbance in the cellular balance between the production of ROS and antioxidant defences, oxidative stress is said to have occurred and this can lead to cell damage and-death [125].
In the present study, SOD concentration varied from one treatment to the other and from 24 to 72 h. In Control 1 and 2, SOD concentration reduced from 24 to 72 h, this can be attributed to acclimatisation to the new environment and a balance between the production of ROS and antioxidant defences [125]. However, in 0, 60 and 200 Watts, there is an observed increase between 24 and 72 h, indicating the continuous release of metals into the water column and sorption into the fish muscles. GSH and GR concentrations showed an initial drop in 0, 60, and 200 Watts when compared to Controls 1 and 2 after 24 h; however, after 72 h, the concentrations showed an increase. Similarly, research showed that zinc oxide nanoparticles inhibited the generation of GSH in the muscle of Nile Tilapia [126]. According to Eroglu et al (2015) [127], after a day's exposure, Cr and Pb significantly inhibited the generation of GSH in the liver of Oreochromis niloticus, while Cd caused a significant increase. However, another study reported that when African Catfish (Clarias gariepinus) is exposed to a combination of Cd and Pb, the concentration of GSH in the liver increased significantly [128]. Therefore, it can be suggested that the most dominant metals in the muscle (Pb) may have caused the initial inhibition observed after 24 h and a combination of metals in the fish caused the later increase observed.
Min et al (2016) [129] recorded that the concentration of GSH in the mullet (Mugil cephalus) increased as exposure to Cr6+ concentrations increased from 25–400 μg/l. In the 100 Watts set up with mean temperature exposure of 30.86 ± 2.46 °C, there was an observed decline in the concentrations of GSH, GST, GR and GSH Px. Inhibition of GSH will cause an increase in the release of H2O2, a free radical, hence causing cellular oxidative stress in the fish [130].
A study carried out by Atli & Canli (2008) showed similar results to the present study; results from their study showed that exposure to metals (cadmium, copper and zinc) significantly increased the levels of Oreochromis niloticus liver GSH except for lead [131]. Similarly, another study that investigated oxidative stress response in Cat Fish (Clarias gariepinus) from Nigeria Ogun River, Nigeria impacted by metal pollution showed significantly higher concentrations of GSH, GST and SOD in the fish liver compared to those in the control site [132].
Oreochromis niloticus (Tilapia fish) sampled from the Hadejia- Nguru wetlands, Jigawa State, Nigeria, impacted by metals through the discharge of waste from agricultural, sewage and industrial sources, was assessed for SOD and GR [133]. The results obtained from the study showed similar trends to the present study, i.e., significantly higher concentrations of the oxidative stress biomarkers. Another study also showed that Labeo rohita exposed to Cr showed a significantly increased activity of SOD and GR in all fish tissues [134].
3.5. Statistical analysis
Pearson's correlation of parameters (figure 7) showed a positive correlation between GSH, GST, SOD, GR, and GSH Px. GSH showed a strong correlation with GST (r = 0.890, p < 0.05), SOD (r = 0.764, p < 0.05), GR (r = 0.657, p < 0.05) and GSH Px (r = 0.856, p < 0.05). GST showed a strong positive correlation with SOD (r = 0.678, p < 0.05), GR (r = 0.743, p < 0.05) and GSH Px (r = 0.846, p < 0.05). GR also showed a positive and strong correlation with GSH Px (r = 0.831, p < 0.05), while SOD showed positive but weak correlation with GR (r = 0.394, p > 0.05) and GSH Px (r = 0.480, p > 0.05). Hence, the same process drives the production of GSH, GST, SOD, GR and GSH Px. GSH in the fish liver showed a negative but weak correlation with temperature in surface water (r = − 0.033, p > 0.05). However, GST, SOD, GR and GSH Px, as well as the concentrations of Cr, Pb and Ni in the water, and Cd, Cr and Pb in the fish, showed positive correlations with water temperature. This may be because an increase in water temperature which in turn caused an increase in metal accumulation by the fish over time reduces the efficiency of the generation of GSH in the fish liver; however, the cycle of detoxification which led to the production of GST, GR, and GSH Px was maintained before fish death. The positive correlation between metals in the surface water and fish muscles show that as the amount of dissolved metals in the surface water increase due to a corresponding increase in water temperature, the concentration of adsorbed metals in fish tissues also increases. Hence, this confirms that the major source of metal intake in the experiment was dermal absorption.

Figure 7. Pearson's correlation analysis.
Download figure:
Standard image High-resolution imageResults of NMDS (figure 8) and hierarchical cluster analysis (figure 9) showed that at a Euclidean distance of 14, there were four groups: 1 - Control 24 h and 72 h, 2–0 Watts 24 h, 3–0 Watts 72 h, 4–60 Watts 24 h and 72 h, 100 Watts 24 h and 72 h and 100 Watts 24 h and 72 h.
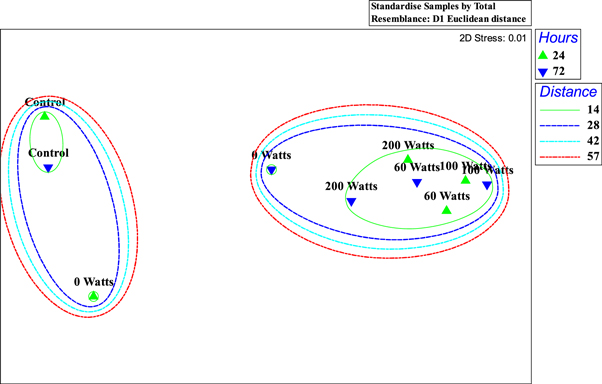
Figure 8. NMDS Plot of experimental treatments with overlaying cluster.
Download figure:
Standard image High-resolution image
Figure 9. Hierarchical cluster analysis of experimental treatments.
Download figure:
Standard image High-resolution image
Both analyses further confirmed that increasing temperature intensified the severity of oxidative stress in a contaminated. This is supported by another study designed to assess the effects of increased temperature on metabolic activity and oxidative stress in the first life stages of marble trout (Salmo marmoratus) [135]. Therefore, an increase in ambient temperature in an already contaminated environment will increase the bioavailability of metal contaminants leading to an increase in bioaccumulation and exacerbation of oxidative stress in juvenile tilapia.
4. Conclusion
The present research was designed to study the effect of increasing temperature on the rate of metal accumulation in fish muscles, and the oxidative stress response in fish liver. It involved the setting up of a mesocosm experiment for 72 h as follows: 0, 60, 100, and 200 Watts, and Controls 1 and 2, set up in triplicate. The 60, 100, and 200 Watts represent the wattage of the tungsten bulbs used to generate the heat needed within the aquarium; Control 2 also had 200 Watts bulb. A quantity of the contaminated sediment and natural tap water from groundwater boreholes were put into 0, 60, 100 and 200 Watts aquariums; while only water was put into Controls 1 and 2 aquariums. Metals (Cd, Cr, Ni, and Pb) and biochemical activities (GSH, GR, SOD, GST, and GHS Px) were analysed in fish muscles and liver respectively. Results showed that metal accumulation in fish muscles was enhanced by increasing temperature. Results also showed that increasing temperature caused an increase in antioxidant enzymatic activities. Therefore, this study revealed that an increase in ambient temperature in an already contaminated environment will increase the bioavailability of metal contaminants leading to an increase in bioaccumulation and oxidative stress in juvenile tilapia. This study calls for a need for the clean-up of aquatic systems contaminated with metals and proper environmental management of inland aquatic systems and estuaries. Most importantly, this study calls for an urgent need for countries to work hand-in-hand to mitigate global climate change.
Acknowledgments
The authors wish to appreciate the support of field and laboratory personnel of the Niger Delta Aqua Research Group
Data availability statement
No new data were created or analysed in this study.
Conflicts of interest/Competing interests
The authors have no conflict of interest/ competing interests to declare
Funding statement
This research did not receive any specific grant from funding agencies in the public, commercial, or not-for-profit sectors.