

Abstract
In this study, the energy consumption of online (streaming or video on demand) lectures is compared with on-site lectures in the case of the Garching campus of the Technical University of Munich (TUM). The energy consumption is calculated using data collected by a survey, own measurements and literature research. On-site lectures at the TUM consume up to two orders of magnitude more energy than digital formats, making any combination of both always more energy intensive than purely online lectures. Transportation turns out to be the factor with the highest energy consumption. In scenarios with a decreased impact of transportation, e.g. regarding universities with dormitories on campus, hybrid or purely on-site lectures can become more favorable in terms of energy consumption, especially if several on-site lectures are attended in one day.
Export citation and abstract BibTeX RIS

Original content from this work may be used under the terms of the Creative Commons Attribution 4.0 licence. Any further distribution of this work must maintain attribution to the author(s) and the title of the work, journal citation and DOI.
1. Introduction
Since the beginning of 2020, the COVID-19 pandemic has not only changed societal life, but has also had a major impact on universities. Lectures and seminars, which were previously held almost exclusively on campus, were transformed into online events. In addition to far-reaching consequences for the social life of students and teachers, this also affects the means by which lectures consume energy. Consuming energy is often related with the emission of greenhouse gasses responsible for climate change and its negative consequences, and it should be a goal to keep these emissions and therefore the energy consumption as low as possible, where reasonable.
Due to its more than 45,000 students (TUM 2022), the Technical University of Munich (TUM) holds a particularly large number of lectures. This comes with the responsibility of developing a teaching concept that is as sustainable as it can be and uses as little energy as possible.
The energy and climate implications of online video streaming or certain aspects of it have already been investigated at several occasions in the literature. With the background of the fast growing electricity demand of information and communication technology, one aspect researchers focused on was that of estimating the energy consumption of the transmission of data through the internet itself (Schien et al 2015, Aslan et al 2018). Other studies investigated the energy consumption of data centers, which contributes to the overall energy consumption of streaming of prerecorded lectures or videos, as these have to be stored on cloud servers (Siddik et al 2021, Masanet et al 2020, Shehabi et al 2016, Koot and Wijnhoven 2021). However, there are also works considering all energy consuming aspects of online video streaming, such as the publication from Shehabi and coauthors (Shehabi et al 2014). Here, DVD rental was compared with video streaming. While data transmission energy plays a significant role in video streaming, DVD rental nevertheless appeared to be more energy intensive, due to consumer travel. Admittedly, this can flip, if high resolution videos are watched and the travel distance is decreased at the same time. Just recently, some studies took the outbreak of the pandemic as motive to investigate the carbon footprint of international scientific conferences and compare it to having the conference online (Raby and Madden 2021, Yates et al 2022, Leochico et al 2021, Burtscher et al 2020, Jäckle 2021, Honavar 2021, Bozelos and Vogels 2021). Considering the long travel distances to an international conference, the online meetings unsurprisingly have a vastly lower carbon footprint than the physically held ones. However, all studies emphasized the lack of social interaction of virtual meetings.
This study compares the energy consumption of online and on-site lectures in the case of the TUM Garching campus. The data used in this work is collected by a survey, own evaluations and literature research. To the best of our knowledge, this is the first study of its kind. On-site lectures consume up to two orders of magnitude more energy than digital formats, making any combination of both always more energy intensive than purely online lectures. Transportation is responsible for the highest energy consumption. In scenarios with a decreased impact of transportation, e.g. regarding universities with dormitories on campus, hybrid or purely on-site lectures can become more favorable in terms of energy consumption, especially if several on-site lectures are attended in one day. Considering the large number of universities worldwide, data is needed in order for policy-makers to decide on more environmentally sustainable lecture formats in the future and take the respective actions. For the discussion on suitable lecture formats, it has to be mentioned that other factors, like the students' satisfaction and health, as well as learning outcome, have to be included to find a comprehensive and holistic solution. These aspects are however not considered in this work.
2. Methods
2.1. General considerations
The energy consumption of on-site and online lectures can be divided into different subgroups (figure 1). Physical lectures require the students to travel to the university, which can be done individually, e.g. by car, bike or foot, or using public transportation. During the lecture, the equipment of the lecture hall and the electronic devices of the students need to be considered. If lectures are attended online, the students' electronic devices, the equipment of the workroom and the action of streaming the lecture live or on demand have to be taken into account. The energy consumption is given in kWh and can subsequently be calculated in equivalents of CO2 emissions in kg using the conversion factor of the German power grid for 2020, 0.366 kg CO2/kWh. (Icha et al 2021) The study is assuming a moderate climate, neglecting the energy consumption of potential heating or air conditioning of lecture halls and student apartments in winter or summer, respectively, due to the lack of suitable data.
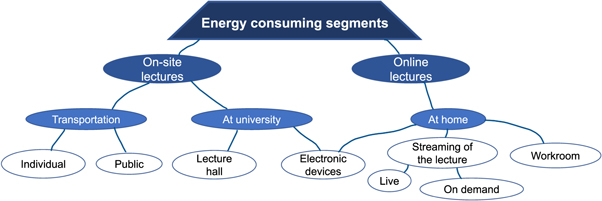
Figure 1. Categories of energy consumption of online and on-site lectures.
Download figure:
Standard image High-resolution image2.2. Data acquisition
As can be seen in figure 1, the calculation of the energy consumption involves many variables and values. Most of them are determined by literature research. The electricity consumption of a typical lecture hall is researched by an on-site evaluation of the consuming devices. The specific behavioral data of the students of the TUM regarding transportation and electronic devices is investigated using a survey (n = 224) and own measurements (see Supplementary Information, SI available online at stacks.iop.org/ERC/4/061002/mmedia).
2.2.1. Transportation
Means of individual transport that are considered are car, motorcycle, bike, and on foot. For public transport, regional train, subway (including municipal railway, tram), and bus are selected. For car, motorcycle and bus, the (greenhouse gas relevant) energy consumption needs to be converted from kg CO2 to kWh using the conversion factor from above [1/0.366 kWh/(kg CO2)] for the use in the calculator. The initially produced CO2 is estimated based on the respective emission factors. All values are listed in table 1 SI and table 2 SI. The students' travel time is based on the survey.
2.2.2. At university
During a presence lecture, the electricity consumption of the lecture hall and the electronic devices of the students and the lecturer are considered. Based on all lecture halls of the TUM (see table 3 SI), the 'Hörsaal 1, Interims II' (see figure 1 SI) was chosen as representative for a modern, medium-sized lecture hall with 449 seats, i.e. 450 participants including the lecturer. A list with the inventory and electricity uptake can be found in table 4 SI. Some students are expected to use electronic devices during the lecture. How many actually use them and what kind of device they use is queried in the survey. Electronic devices considered for attendance lectures are smartphones, tablets/iPads, and laptops. The electricity uptake of these devices is listed in table 5 SI.
2.2.3. At home
If the lecture is attended online, the electricity uptake of the used electronic device, the equipment of the student's workroom and the data transmission via the internet are considered. In this scenario, desktop PCs and additional screens are included in addition to the other devices. Based on a request to the student housing administration, a typical modern workroom has a LED lighting bulb with 13 W. For the internet connection and usage, a router, access and the infrastructure (core network; in the case of video on demand (VoD) additionally data centers) are electricity consuming segments (see table 6 SI).
2.3. Calculation
In this section, the general approach for the calculation of the consumption of lectures, both online and on-site, will be discussed in detail. This approach is implemented in the elecCalc toolkit 11 , which is under active development 12 . The discussion will be split into two parts, one for the calculation of on-site lectures and one for online lectures. Both of them combined constitute the hybrid scenario.
2.3.1. On-site lectures
The energy consumption of on-site lectures Won−site is given by

where WLH describes the consumption of the used lecture hall, WT the consumption caused by transportation to the lecture hall and WD,off the consumption of all electronic devices used during the on-site lecture. nS is the number of students participating in the lecture. These different contributions can then be split further:
The lecture hall consumption WLH consists of a base consumption and the user can optionally add beamers to the calculation, if relevant (see table 4 SI).
The consumption due to transportation WT is given by

where WMoT is the consumption of any given mean of transport (MoT, see 2.2.), which in turn is given by

depending on whether the energy consumption per km, PT or the produced amount of CO2 ( , which is converted into W/km by a conversion factor f, see 2.1) is known. Furthermore, ttravel is the travel time in minutes, which is converted by the factor dt
into kilometers traveled. Lastly, in (2), the consumption of the individual MoT is then multiplied by 2 to account for the travel to and from the university and scaled by the number of lectures per day nlpd to only account for the contribution to the specific lecture under investigation.
, which is converted into W/km by a conversion factor f, see 2.1) is known. Furthermore, ttravel is the travel time in minutes, which is converted by the factor dt
into kilometers traveled. Lastly, in (2), the consumption of the individual MoT is then multiplied by 2 to account for the travel to and from the university and scaled by the number of lectures per day nlpd to only account for the contribution to the specific lecture under investigation.
To establish which MoT is used by the students as well as the respective travel time, the survey data (see SI) is re-sampled to the number of students taking part in the lecture. The sampling is done using emcee, a pure-Python implementation of Goodman & Weare's Affine Invariant Markov chain Monte Carlo (MCMC) Ensemble sampler (Foreman-Mackey et al 2013), whereby every student is assigned one walker. Here, a multidimensional kernel density estimate (KDE) of the probability density function of the survey data is used as a likelihood function in the sampling procedure. The KDE is obtained using scipy (Virtanen et al 2020), where the bandwidth is selected using Scott's Rule (Scott 2015). After the sampling, the result is averaged over several samples.
The last term in (1), WD,off is given by

where tlec is the lecture duration and PD is the power draw of a given device, e.g. a laptop. Here, the number of students is modified by a percentage u which specifies the fraction of students using electronic devices during on-site lectures. Similarly to (2), the used devices for each student are sampled from a KDE using emcee.
2.3.2. Online lectures
Online lectures are calculated similarly to on-site lectures described in section 2.3.1: Their consumption is given by

Here, WLS describes the consumption of the lecture service (i.e. either a streaming or VoD service), WL the consumption of the accommodation of the students and WD,on the consumption of the devices used to join the online lecture. Again, these contributions can be split further:
The lecture service contribution WLS is composed of

containing access, router and core network power, and in case of VoD services also the data center power.
The energy consumption due to the accommodation of the students WL is described by

considering the number of lights nlight with a power draw of Plight at the study area of the students.
Last but not least, the power consumption of the used electronic devices WD,on is given analogously to (4):

the main difference being that the summation runs over all students.
2.3.3. Hybrid lectures
Hybrid lectures are calculated as a combination of an on-site and an online lecture, whereby the consumption of each sub-lecture is calculated as described in section 2.3.1 and 2.3.2, respectively. This means that the total consumption of a hybrid lecture is given by

with nonsite being the number of students joining the lecture on-site.
3. Results
In the following, the energy consumption of online and on-site lectures for the TUM Garching campus, as well as different case studies, are presented. The focus lies on the qualitative trends; these trends are expected to be transferable to other universities. Throughout this work, it is assumed that the duration of a lecture is 90 minutes. The subjective perception of the students of online lectures during the pandemic is presented in the SI. The absolute values of the energy consumption of the different scenarios are given in the SI as well.
3.1. Consumption of the TUM Garching campus
In this section, the results obtained with the data gathered for the TUM as described in section 2.2 are presented, using the calculator detailed in section 2.3. Here, only the Faculty of Mechanical Engineering is considered, since the most survey data is available for this faculty (see SI) and this example can thus rely on a better statistic for the sampling procedure. Using other faculties does not yield significantly different results. However, since the consideration of other faculties would yield results in significantly larger statistical uncertainties, this will not be further discussed. Figure 2 shows the results obtained for both a hybrid-streaming and a hybrid-VoD lecture, either with 450 students (i.e. in cases where the lecture hall is at full capacity) or 30 students. It should be noted that the CO2 equivalents given here are only for illustrative purposes as they do not necessarily reflect the actual amount of CO2 produced, e.g. due to electricity being produced from renewable sources. The CO2 equivalents have been calculated using the values from Icha et al 2021 as discussed in section 2.1. What immediately stands out is the fact that the total energy consumption is dominated by the transportation, and becomes negligible only in cases where very few students join on-site. This leads to an on-site lecture never being the favored lecture mode from an energy consumption perspective, as the consumption of the transportation surpasses all other factors by up to two orders of magnitude, based on the data collected in the survey. In contrast, when considering all categories except transportation, a purely on-site lecture is favored. This means that the on-site lecture is made unfavorable solely by the contribution of the transportation.
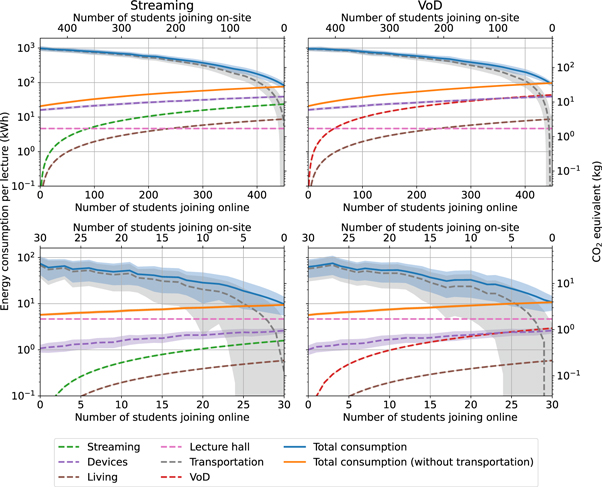
Figure 2. Energy consumption of online and on-site lectures for the TUM campus Garching. The upper row shows a hybrid-streaming and -VoD lecture with 450 students, the lower row the same scenarios with only 30 students. The shaded regions indicate the 1σ statistical uncertainty region originating from the sampling procedure described in section 2.3. The kinks in some of the curves are an artifact of the statistical sampling. Here, the CO2 equivalents are for illustrative purposes only.
Download figure:
Standard image High-resolution imageRegarding all other contributions, most of them behave as expected and scale linearly with the number of students (e.g. the living costs or streaming/VoD service) or are constant in case of the lecture hall. The only deviation from this behavior is in the case of the electronic devices, caused by the fact that students tend to use electronic devices in both online and on-site lectures, but to varying degrees (e.g. by connecting to a second monitor or using a desktop PC during online lectures). Nonetheless, the consumption caused by the device usage increases when more students join the lecture online and it becomes the dominating contribution for lectures where the majority joins online.
Furthermore, it should be pointed out that, in cases where the lecture hall is used (in a full on-site scenario), the consumption of the lecture hall is rather negligible and overshadowed by the consumption of the electronic devices. This drastically changes, if the lecture hall is severely under-used (see the lower row of figure 2). In such cases, the lecture hall is the driving factor of the on-site consumption, since it is designed for 450 students.
Last but not least, it should be highlighted that, the VoD online lecture consumes more energy than a streamed online lecture, due to the storage of the lecture records in data centers. Yet, since the difference does not change the overall tendencies of the result, the focus will be on the streaming mode for the remainder of this section. Additionally, the VoD lecture is less suited for a 'simultaneous hybrid lecture' and is further complicated by the fact that a VoD might be watched several times, adding other uncertainties.
3.2. Case studies
In this section, the effect of changes of the traveling behavior and device usage of students, as well as attended lectures per day are illustrated.
3.2.1. Individual transport versus public transport versus localized campus
The first case study focuses on the effect of different means of travel on the total energy consumption. Here, three different cases are compared to the original TUM data illustrated in figure 2: The 'Individual transport' scenario assumes that students would travel by car or motorcycle (equally split), whereby the travel time is randomly drawn from a normal distribution with a mean and standard deviation equal to the values of the car and motorcycle users from the survey. Similarly, in the 'Public transport' scenario, all students not already using the subway or bus (or arrive on foot/by bike), are now using the subway with their travel time randomly drawn from a normal distribution around the travel time of the subway users from the survey. Lastly, a scenario is considered where all students live within walking or cycling distance of the campus, and only 10% of students are using the bus ('Localized campus'). Their travel time is normally distributed with a mean of 15 minutes and a standard deviation of 5 minutes.
The results of this case study are illustrated in figure 3, together with the TUM data for comparison. It becomes immediately evident that individual transport by car or motorbike is in no way a desirable outcome as it increases the energy consumption by another order of magnitude. In contrast, when students use public transportation, the energy consumption is drastically reduced, but not yet to a degree where on-site lectures consume less energy than online lectures. This is due to the rather long travel times of around 50 min found at TUM Garching (see section 3.2.2 for more details). However, if a campus is considered where most students can go to their lectures on foot or by bike, the energy consumption caused by transportation becomes, as expected, small enough to be no longer a driving contribution, which results in on-site lectures becoming the less energy intensive option. In this case, the total consumption is again dominated by electronic devices.

Figure 3. Comparison of different means of transport scenarios. The shown scenarios are either the means of travel as established by the survey (TUM statistic), all students going by car or motorcycle (Individual transport), all students not arriving by bike or on foot using public transport (Public transport) or 90% of students arriving by bike or on foot with the remaining 10% traveling 15 minutes by bus on average (Localized campus). The individual contributions to the total consumption are identical to figure 2 and not shown for clarity. The shaded regions indicate the 1σ uncertainty region originating from the statistical sampling described in section 2.3. Here the CO2 equivalents are for illustrative purposes only.
Download figure:
Standard image High-resolution image3.2.2. Influence of travel time
Following the insights gained in section 3.2.1, the influence of different travel times on the total energy consumption is investigated. Here, the case study is based on the 'Public transportation' scenario from the previous section, i.e. all students using public transportation, in an effort to explore further options on how to make on-site lectures at TUM consume less energy. The travel time of all students using public transportation is systematically decreased by replacing their travel time by a random time drawn from a normal distribution around 5, 10 or 20 minutes, with a standard deviation of 5 minutes for the mean of 5 minutes or 10 minutes for the other two cases. For comparison: the average travel time in the 'Public transportation' scenario is around 49 minutes, which is roughly the same as the mean value from the survey, which is 53 minutes. The resulting energy consumption values are illustrated in figure 4.

Figure 4. Comparison of different travel distances scenarios. The shown scenarios are based on the 'Public transport' scenario shown in figure 3. Here, this scenario has been modified by varying the average travel time of students using public transportation, whereby the travel time is drawn from a normal distribution  with the indicated properties. The shaded regions indicate the 1σ uncertainty region originating from the statistical sampling described in section 2.3. Here, the CO2 equivalents are for illustrative purposes only.
Download figure:
Standard image High-resolution imageThe takeaway from this study is that, in an effort to significantly reduce the contribution of the transportation in a TUM-like means of travel distribution, the travel time has to be cut down significantly to make an on-site lecture consume less energy than an online lecture. This would mean that students need to travel on average at most 5 minutes—even if exclusively using public transport -, which effectively means that the campus should be located e.g. within only a few subway stations. Nonetheless, even for such reduced travel times and public transport only, the transportation consumption is still the dominating contribution for fully on-site lectures.
3.2.3. Device usage and lectures per day
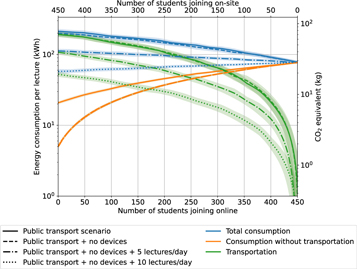
In the last case study, the influence of the device usage during on-site lectures and the effect of the number of lectures per day are investigated. Here, the 'Public transportation' scenario from section 3.2.1 is again taken as a baseline, but the device usage is modified during on-site lectures, i.e. set down to 0% from the original ∼75%. This scenario is then further modified by increasing the lectures per day from 2.7 (i.e. the value used in the previous sections) up to 5 or 10. The results can be seen in figure 5.
Figure 5. Investigation of different device usage configurations and lectures per day. Here, several scenarios are compared in which students do not use any electronic devices during on-site lectures with the 'Public transportation' scenario from figure 3. Additionally, in two scenarios, the lectures per day are increased compared to the value established in the survey. The shaded regions indicate the 1σ uncertainty region originating from the statistical sampling described in section 2.3. Here, the CO2 equivalents are for illustrative purposes only.
Download figure:
Standard image High-resolution image
Although not using devices in on-site lectures drastically reduces the energy consumption before considering transportation, it has little effect on the total consumption. If students do, however, attend more lectures (or e.g. tutorials for that matter) per day, the contribution of the transportation to a single lecture can be again reduced. In the presented model, students would need to travel for around 10 lectures (15 hours of lectures non-stop!) to the campus, to effectively make on-site lectures more favorable in terms of energy consumption than online lectures. In summary, while not using electronic devices in lectures has little effect on the total energy consumption, traveling to the campus for as many lectures as possible can have a much more beneficial effect on the total consumption.
4. Discussion
4.1. Discussion of the results
Transportation turns out to be the major contributing factor to the energy consumption of on-site lectures in the case of the TUM Garching campus, making on-site lectures in any case more energy intensive than online lectures. One reason for that can be found in the location of the campus: the TUM Garching campus is situated around 13 km away from the city center of Munich (see figure 2 SI). In addition, only a few dormitories are available in its proximity. The high living costs in Munich lead to some students not being able to live in the city but rather commute to the university from the suburbs. These factors combined result in long travel distances and around 50 min travel time for an average student. Furthermore, even though only 12% of transportation is done individually, its impact on the total energy consumption is vastly higher (car: ∼22 fold; motorbike: ∼13 fold compared to the consumption of public transport per person). If all students would travel individually, this would even raise the energy consumption by one order of magnitude (see section 3.2.1).
However, a campus located somewhere near the city center with a shorter travel time for the students still does not make a big difference—in fact, the travel time needs to be decreased down to 5 minutes with the students using exclusively public transport for the on-site lecture to be more favorable than the online lecture in terms of energy consumption. Alternatively, a 'localized campus' similar to American campuses with a vast majority of students arriving on foot or by bike, and the rest by bus, would be a scenario where the same result can be achieved.
With this in mind, a realistic, energy saving mode of a lecture suitable for the TUM Garching could involve a hybrid format where an online option is offered for students with a particularly long travel time, whereas students living in close proximity are incentivized to join on-site by using public transport, i.e. by further subsidizing public transportation. This hybrid solution is also suggested for academic conferences, even though the energy consumption cannot match that of purely online meetings (Jäckle 2021).
Another approach to minimize the energy consumption is to have more lectures scheduled per day and thus less days at university per week, to make the most use of the energy spent for transportation to the campus. While it is of course unrealistic to have 10 lectures a day (section 3.2.3), 5 to 6 lectures or tutorials should be possible to attend. In combination with a shorter travel time, this is also a reasonable way of reducing the consumed energy per on-site lecture.
Of course, both strategies require appropriate lecture hall sizes for each course at close to maximum capacity in order to make the most of the constant energy consumption of the facility. Additionally, the students can actively contribute to reduce the consumed energy per lecture. If they only have one lecture scheduled on a day, it makes sense to join the lecture online—if offered—to save energy.
In the long term, the construction of dormitories in proximity to the campus is one of the most effective ways of minimizing the energy consumption of academic teaching for cases similar to the TUM Garching campus.
While the data transmission and data centers are getting more energy efficient (Masanet et al 2020, Aslan et al 2018), individual transport will most likely also see increased energy efficiency (measured in miles per gallon equivalents), with more electric vehicles introduced in the future (Anderson et al 2011, EPA 2022a, 2022b). This will lower the impact of individual transport on the overall energy consumption, although online lectures will probably remain more energy efficient.
At first glance, the results are also somewhat applicable for telecommuting. However, a study from O'Brien and Aliabadi shows that the energy implications of telecommuting are complex due to so-called rebound effects, which do not allow to draw a clear conclusion as to whether telecommuting overall indeed saves energy, even though transportation to work, as a major energy-consuming factor, is eliminated (O'Brien and Yazdani Aliabadi 2020). These rebound effects are not included in this study. First, many of the described rebound effects, e.g. moving into a larger house in the suburbs far from office due to cheaper prices, are not relevant for students considering their living situation and financial power. Second, this would have exceeded the scope of this work.
4.2. Validity and transferability of the results
Even though thorough research was conducted to gather the necessary data to use in the developed calculator, it should be kept in mind that only 224 TUM students answered the conducted survey. Considering that the TUM had a total of 48 296 enrolled students in the semester during which the survey was conducted (TUM 2022), the number of answers might not be representative for the entirety of TUM students. However, since the energy consumption of transportation is up to two orders of magnitude higher than the energy consumption of other consumption sources (see section 3.1), small changes, for instance in the use of electronic devices, would not affect the shown tendency that on-site lectures consume more energy than online lectures.
The presented trends and discussed scenarios are well applicable for other universities, which e.g. have a 'localized campus' rather than a 'satellite' campus outside of the city similar to the TUM Garching campus. However, it should be noted that the use of electronic devices varies between the study programs, e.g. computer science (∼70%) versus physics (∼45%). In addition, the transportation energy is calculated based on the emission of CO2 equivalents per kWh (see section 2.1), which is specific for the German energy mix (0.366 kg CO2/kWh)(Icha et al 2021). In the case of Sweden (0.008kg CO2/kWh)(EEA 2022), for instance, the individual transport would have an even higher impact on the on-site lectures, as the electricity is nearly carbon-neutral.
5. Conclusion and outlook
In this study, the energy consumption of online and on-site lectures is compared. To the best of our knowledge, this is the first study of its kind.
The used data is based on a conducted survey, own evaluations and literature research. An online calculator is created for the estimations in this study but is usable for other universities as well. Uncertainties in the results remain due to assumptions based on the available data, hence only trends and no absolute numbers are discussed in the study.
The lecture site is the TUM Garching campus, which is located somewhat outside of the city. Thus, the results are valid for remote campuses, but the described scenarios are also applicable for local campuses.
On-site lectures consume up to two orders of magnitude more energy than digital formats, making any combination of both always more energy intensive than purely online lectures. Transportation is the most energy consuming factor. For more local campuses that come with a decreased impact of transportation, hybrid or purely on-site lectures can become more favorable in terms of energy consumption, especially if several on-site lectures are attended in one day.
Approaches towards more energy efficient lecture formats include incentivizing the use of public transportation or bike, operating the lecture halls at maximum capacity, providing student housing in the surroundings of the university in the long term, suggesting students to join their lectures online if they live particularly far away from the university and to concentrate the students' lectures on as few days as possible. However, in the discussion of energy efficient lecture formats, students' satisfaction and health, as well as learning outcome have to be considered.
The discussed trends in this study might give certain hints on the energy consumption in similar cases, e.g. when comparing online meetings versus on-site meetings or telecommuting.
In future studies, the energy consumption of online and on-site lectures should be compared with the focus on heating and air conditioning. It is unclear to what extent individual heating and air conditioning of the student apartments might increase the energy consumption of online lectures, making them unfavorable in cold or hot seasons.
Acknowledgments
The authors thank Sara D. Leonhardt and Peter Annighöfer for constructive discussions and Maryam Tatari and Sebastian Zäpfel for organizational support during the project. The financial and ideational support of the TUM: Junge Akademie is highly appreciated and made this research possible.
Data availability statement
The raw data collected on the lecture hall, means of transportation and living situations of students is available in the supplementary information, SI. The survey data, both in a raw and post-processed format will be made available upon reasonable request.
Author contributions
Alexander Holas: Conceptualization, Data curation, Formal Analysis, Methodology, Visualization, Writing—original draft, Writing—review & editing; Catherine Y. Koch: Conceptualization, Data curation, Investigation, Methodology, Writing—original draft, Writing—review & editing; Joachim Leibold: Conceptualization, Methodology, Writing—review & editing; Alesia Prendi: Conceptualization, Investigation, Methodology, Writing—original draft, Writing—review & editing; Tim P. Schlachta: Conceptualization, Data curation, Investigation, Methodology, Visualization, Writing—original draft, Writing—review & editing; Anna Sophia Schmid: Conceptualization, Data curation, Investigation, Methodology, Writing—original draft, Writing—review & editing; Leonard Schmitt: Conceptualization, Investigation, Methodology, Writing—original draft, Writing—review & editing.
Footnotes
- 11
Available under https://electum.ja.tum.de/
- 12