

Abstract
Using the data of input, output, and air pollutants from 17 cities in Shandong Province and employing the super-SBM model, the atmospheric environmental efficiency (AEE) of 17 cities in Shandong from 2008 to 2018 was calculated. Additionally, the spatial-temporal differences are analyzed by using the GML index and Theil index. The results show that the overall efficiency of the atmospheric environment in Shandong was relatively high (AEE = 0.827). The northwest region had the highest efficiency, while the southern region was the lowest. The improvement of the environmental efficiency was mainly contributed by technical progress, rather than efficiency promotion (TC < 1). The spatial difference in the efficiency showed an increasing trend, which can be mostly explained by the inter-group difference whose average contribution is 82.39%. Economic development, technological innovation, and population density had positive effects on the environmental efficiency. While, the effects of industrial structure and opening-up were negative.
Export citation and abstract BibTeX RIS

Original content from this work may be used under the terms of the Creative Commons Attribution 4.0 licence. Any further distribution of this work must maintain attribution to the author(s) and the title of the work, journal citation and DOI.
1. Introduction
Air pollution refers to the emission of harmful pollutants into the air including dust, soot, sulfur dioxide, carbon monoxide, etc Air pollution continues to increase at a stunning rate, and threatens the health of people globally. Statistics from WHO in 2018 reveal that nine out of ten people breathe air that exceeds the guidance limits for pollutants, of which those living in low-income countries suffer the most. Air pollution caused about 7 million deaths worldwide per year.
With the advancement of urbanization and industrialization in China, atmospheric environmental problems represented by haze have gradually emerged and become a major issue affecting people's health and high-quality development (Xu et al 2013; Huang et al., 2014). According to the statistics of the Chinese National Climate Center, the national average number of haze days in 2013 was 29.9 days, the highest since 1961 1 . The government has attached great importance to the prevention and control of air pollution. The State Council promulgated and implemented the 'law on the prevention and control of air pollution' in 1987 and revised it in 2016. The 'Air Pollution Action Plan' was announced and implemented in 2013. The '2018–20 Action Plan for winning the blue sky war' was put into practice in 2018. After great efforts on the treatment of air pollution, the air quality has been obviously improved in China. As shown in figure 1, from 2015 to 2019, the days of PM2.5 heavy pollution (daily average of PM2.5 is more than 150 μg m−3) in prefecture level cities showed a significant downward trend, from 3083 days in 2015 to 1813 days in 2019, with a decrease of 41.2%. The hours of PM2.5 exceeding 300 μg m−3 decreased by 58.8% compared with 2015. The statistics from Bulletin of Atmospheric Environment 2020 released by Ministry of Ecology and Environment shows that the national average number of haze days in 2020 was 24.2 days, 1.5 days less than that in 2019, and 8.1 days less than that in recent five years. 3
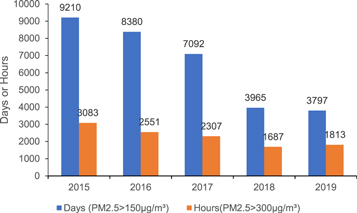
Figure 1. PM2.5 heavy pollution days of 337 cities in China from 2015 to 2019.Source: National Urban Ambient Air Quality Monitoring Network 2 .
Download figure:
Standard image High-resolution imagePutting nature first is a fundamental distinction between ecological civilization and the PRC's intense focus for the past 40 years on high gross domestic product (GDP) growth. Moreover, China announced that it would aim to achieve peak CO2 emissions before 2030 and carbon neutrality before 2060 in 2020. Meanwhile, it is an undeniable that China is the biggest developing country (Yu and Zhang, 2019). Economic development is and will be the most important task for government. Therefore, it is of great significance for central government to coordinate the improvement of environment with development of economy on the road to ecological civilization. In this context, assessing atmospheric environmental efficiency plays an important role in helping governments make effective measures, improve environmental governance, and address air pollution issues.
The increasingly serious air pollution problem attracts more attentions from researchers on the study of air pollution control and environmental efficiency. Environmental efficiency is a concept for evaluating the influence of economic development on environment, and was firstly introduced by the Global Governance and Sustainable Economic Development Forum in 1992. Its quintessence is to utilize less resources to produce more economic yield and mitigate atmospheric pollution.
What scholars are most concerned about is to measure environmental efficiency accurately and scientifically, because it can provide public policymakers with quantitative information to make decisions. The most frequently used environmental efficiency assessment methods by previous studies include the single ratio method (Yin et al 2014), life-cycle assessment (Beames et al 2015, Duan et al 2015), stochastic frontier analysis (Baráth and Fertő 2015; Choi and Qi, 2019), the ecological footprint method (Cerutti et al 2013), and data envelopment analysis (DEA) (Choi et al 2012; Zhou et al 2018; Deng et al 2016). Among the approaches, one great advantage of DEA is that it can measure environment efficiency and air pollution at the same time, and thus has been broadly utilized in multi-dimensional sustainability estimation ( Zhang et al 2019). However, the disadvantage of DEA method is that it doesn't take the output slacks into consideration, which produces a potential upward bias of desirable output (Charnes et al 1984). Slacks-based measure (SBM)-DEA method can overcome the restriction of traditional DEA by directly dealing with 'input excess' and 'output inefficiency' simultaneously and minimizing the objective function by adopting the maximum slacks (Zhou et al 2018). Therefore, several studies have employed the SBM-DEA method to assess environmental efficiency (Guo et al 2017; Mardani et al 2017; Lee et al 2020). Another strand of literature in this field paid attention to the Spatial-temporal patterns of air pollution (Alli et al 2021; Wang et al 2022).
The existing studies can be classified according to the spatial levels of research object. Some researchers have conducted country-level studies on environmental efficiency. Mavi and Mavi (2019) for OECD countries with Malmquist productivity index. Sun et al (2020) for 104 countries with Malmquist–Luenberger productivity index. Hermoso-Orzáez et al (2020) for 28 EU members with DEA. Some other studies investigated this issue at province level. Song et al (2019) found that provinces in the east were the most environmentally efficient while those in the central regions were the least. The rest belongs to city-level studies. Zhang et al (2019) found that the top three cities leading environmental efficiency were Shenzhen, Sanya, and Erdos in China. Sun et al (2020) claimed that the overall environmental efficiency of Chinese cities had increased gradually, which could possibly be explained by high–speed rail construction.
Although enormous studies on environmental efficiency, there are still gaps in the existing literature. First, very few studies have paid attention to air pollution-related environment efficiency, despite its noteworthiness to human wellbeing. Moreover, most researchers study the environment efficiency at country or province level. Country or province level study obviously fails to understand potential paths and spatial differences, as the emission standards is set at city level.
To fill the gaps of previous studies, this study aims to evaluate the atmospheric environmental efficiency (SO2, NOx, and PM2.5) of 17 cities in Shandong Province using the annual average data from 2008 to 2018. A super-SBM method that considers undesired output is employed to calculate the efficiency. Moreover, the spatial-temporal differences are analyzed by using the GML index and Theil index. The reason why we take Shandong province as the object is that the energy consumption of Shandong reached 405.8 million tons of standard coal in 2019, accounting for 9% of the country. Meanwhile, Shandong province has the largest emissions of sulfur dioxide, nitrogen oxides and chemical oxygen demand in 2019. The 2019 Bulletin of National Ecological Environment Quality issued by Ministry of Ecology and Environment shows that 5 of the 20 cities with poor ambient air quality come from Shandong. 4
This study may contribute to the literature in the following ways: First, some important policies had been executed in the study period, which supplies a better understanding of how atmospheric pollution governance evolved within a province. Second, investigating spatial-temporal differences in atmospheric environmental efficiency by using the GML index and Theil index is useful to suggest practical policies. Moreover, this study further investigates the influencing factors of atmospheric environmental efficiency by regression.
The rest of this paper is organized as follows. Section 2 introduces the methodology framework and the data, section 3 shows the empirical results, and section 4 concludes with policy implications.
2. Methods and data
2.1. Super-SBM method
Traditional DEA method fails to evaluate the efficiency of decision-making units (DMUs) with undesirable output. To overcome the problem of slack variables, the slacks-based measure (SBM) model was developed by Tone (2001). However, both DEA and SBM are unable to compare the efficiency between different DMUs, because multiple full efficiency would be obtained (efficiency value equal to 1). To modify the constraint for undesirable outputs, Tone (2003) extended the original SBM to super-efficiency SBM by adding the slacks. The efficiency value calculated by super-SBM can be greater than 1, which makes the efficiency comparable.
Assume there are  DMUs. Each of them utilizes an input vector
  to produce a desirable output vector
  and an undesirable output vector
  The production possibility set can be defined as follows:

Where  are defined as the matrices of input vector, desirable output vector, and undesirable output vector respectively.
  is the weight vector. The optimal solution by solving DEA-type model can be expressed by:
Subject to: 


Where  are the corresponding slacks of inputs, desirable outputs and undesirable outputs. The DMU is efficient if and only if the objective function value
  if
if  it indicates that DMU is inefficient.
2.2. Global-malmquist-luenberger (GML) index
Malmquist productivity index are often biased without considering the environmental effect (Lall et al 2002). To address this concern, the Malmquist-Luenberger productivity index (ML index) was developed by integrating the concepts of the Malmquist productivity index and a directional distance function to measure environmentally sensitive productivity growth (Chung et al 1997). However, the ML index has a circularity problem and a possible linear programming infeasibility problem in measuring cross-period directional distance functions (DDFs). The Global-Malmquist-Luenberger (GML) index proposed by Oh (2010) tried to solve these problems of the ML index by incorporating the notions of the global Malmquist productivity growth index and the DDF. The GML index is defined as follows:
Where  is the directional distance functions, which is defined on the global technology set
 suggests productivity gain (loss). The GML index can be decomposed into efficiency change (EC) and the best practice gap change (BPC) as follows.
Where  is efficiency change.
  indicates efficiency gain (loss).
  is the best practice gap, which measures the technical change as ML method.
  corresponds to technical progress (regress).
2.3. Theil index
The Theil index is used to measure inequality between regions. The index can be decomposed the overall differences into intra-group and inter-group differences, reflecting the size and source of differences (Theil, 1967). The equations are given by:


Where  is the sorted atmospheric environmental efficiency value of the
  city.
city.  is the average efficiency of all cities.
  is the number of groups.
  is the average value of atmospheric environmental efficiency of group
 is the number of cities in group
 is the Theil index of Group
 is the intra-group difference,
  is the inter-group difference. The value of Theil index is between 0 and 1. Larger value of Theil index indicates greater difference of environmental efficiency.
2.4. Data
To evaluate environmental efficiency, this paper collected input and output data of 17 cities of Shandong province from 2008 to 2018. Labor force, capital stock and energy consumption are used to measure inputs. GDP is used to measure the desirable output. SO2, NOx, and PM2.5 emissions are chosen as the undesirable outputs. The perpetual inventory method was used to calculate capital stocks measured the fixed asset investment, assuming a 10% depreciation rate as Oh (2010). GDP and capital stock were deflated by appropriate price indexes corresponding to 2008 purchasing power parities. Labor force was measured with urban employment at the end of the year. Data of labor force, the fixed asset investment, GDP, and energy consumption were extracted from the city statistical yearbook (Zhang et al 2020). Data of SO2, NOx emissions were collected from the national environmental statistical yearbook. Data on annual average concentration of PM2.5 were taken from the Atmospheric Composition Analysis Group of Dalhous University. 5 The raw data was collected from statistical yearbooks, and there were no missing values. Therefore, the data in this paper needed no curation. The statistical description of the data is reported in table 1.
Table 1. Descriptive statistics of inputs and outputs, 2008–2018.
| Variables | Observations | Mean | St Dev | Minimum | Maximum |
|---|---|---|---|---|---|
| Labor (104persons) | 187 | 115.23 | 66.84 | 22.53 | 325.47 |
| Capital (108 RMB) | 187 | 10457.12 | 6342.27 | 1666.49 | 36625.37 |
| Energy (104 Tons of SCE) | 187 | 2697.56 | 1049.54 | 923.35 | 5354.52 |
| GDP (108 RMB) | 187 | 2903.74 | 1807.64 | 456.38 | 12001.52 |
| SO2 (Tons) | 187 | 91408.70 | 88165.90 | 34586.00 | 211697.00 |
| NOx (Tons) | 187 | 77611.60 | 64585.30 | 1658.00 | 17468.00 |
| PM2.5 (μg m−3) | 187 | 66.47 | 13.92 | 24.73 | 116.76 |
3. Empirical results and discussion
3.1. Atmospheric environmental efficiency (AEE)
The AEE of 17 cities in Shandong province from 2008 to 2018 was estimated with super-SBM model as reported in table 2. Moreover, for the purpose of investigating the regional differences, the average AEE of 4 regions was calculated respectively, namely, northeast, center, northwest, and southwest. Northeast region includes Yantai, Qingdao, and Weihai. Central region includes Jinan, Laiwu, Zibo, Weifang, and Tai'an. Northwest includes Liaocheng, Dezhou, Binzhou and Dongying. Southwest includes Jining, Heze, Zaozhuang, Linyi, and Rizhao. Figure 2 presents the trend of AEEs of Shandong province and its four groups.
Table 2. AEE of the 17 cities in Shandong:2008–2018.
| City | 2008 | 2009 | 2010 | 2011 | 2012 | 2013 | 2014 | 2015 | 2016 | 2017 | 2018 | Average |
|---|---|---|---|---|---|---|---|---|---|---|---|---|
| Binzhou | 0.893 | 0.91 | 0.922 | 0.903 | 0.872 | 0.856 | 0.801 | 0.726 | 0.622 | 0.616 | 0.625 | 0.795 |
| Dezhou | 0.768 | 0.814 | 0.816 | 0.808 | 0.820 | 0.808 | 0.763 | 0.761 | 0.747 | 0.746 | 0.766 | 0.783 |
| Dongying | 0.959 | 1.010 | 1.018 | 1.009 | 1.010 | 1.021 | 1.011 | 1.003 | 0.982 | 0.989 | 1.054 | 1.006 |
| Heze | 1.031 | 1.023 | 0.957 | 0.878 | 0.825 | 0.834 | 0.812 | 0.811 | 0.799 | 0.797 | 0.800 | 0.870 |
| Jinan | 0.573 | 0.592 | 0.616 | 0.642 | 0.664 | 0.749 | 0.870 | 0.928 | 0.950 | 0.939 | 1.024 | 0.777 |
| Jining | 0.687 | 0.717 | 0.744 | 0.755 | 0.808 | 0.805 | 0.815 | 0.820 | 0.785 | 0.727 | 0.728 | 0.763 |
| Laiwu | 1.021 | 1.040 | 1.098 | 0.988 | 1.006 | 0.945 | 0.860 | 0.816 | 0.801 | 0.804 | 0.815 | 0.927 |
| Liaocheng | 0.870 | 0.901 | 0.905 | 0.893 | 0.867 | 0.859 | 0.793 | 0.760 | 0.734 | 0.724 | 0.719 | 0.820 |
| Linyi | 0.675 | 0.737 | 0.751 | 0.738 | 0.757 | 0.748 | 0.725 | 0.724 | 0.726 | 0.716 | 0.727 | 0.729 |
| Qingdao | 0.605 | 0.656 | 0.723 | 0.747 | 0.871 | 1.007 | 1.013 | 1.005 | 1.006 | 1.004 | 1.005 | 0.877 |
| Rizhao | 1.077 | 1.162 | 1.044 | 0.804 | 0.804 | 0.804 | 0.706 | 0.702 | 0.579 | 0.717 | 0.684 | 0.826 |
| Tai'an | 0.710 | 0.752 | 0.765 | 0.743 | 0.716 | 0.706 | 0.691 | 0.684 | 0.686 | 0.693 | 0.709 | 0.714 |
| Weihai | 1.010 | 1.018 | 1.036 | 0.984 | 0.958 | 0.996 | 1.010 | 1.000 | 1.007 | 1.004 | 1.016 | 1.004 |
| Weifang | 0.557 | 0.583 | 0.605 | 0.591 | 0.618 | 0.633 | 0.618 | 0.616 | 0.632 | 0.675 | 0.696 | 0.620 |
| Yantai | 0.636 | 0.685 | 0.732 | 0.735 | 0.795 | 0.851 | 0.856 | 0.907 | 0.982 | 1.004 | 1.040 | 0.838 |
| Zaozhuang | 0.780 | 0.813 | 0.807 | 0.799 | 0.785 | 0.781 | 0.741 | 0.726 | 0.717 | 0.704 | 0.708 | 0.760 |
| Zibo | 0.665 | 0.742 | 0.882 | 0.948 | 1.000 | 1.018 | 1.014 | 1.004 | 0.964 | 0.964 | 1.007 | 0.926 |
| Total | 0.795 | 0.833 | 0.848 | 0.821 | 0.833 | 0.830 | 0.829 | 0.823 | 0.807 | 0.813 | 0.831 | 0.827 |
| Northeast | 0.750 | 0.786 | 0.830 | 0.822 | 0.875 | 0.951 | 0.960 | 0.971 | 0.998 | 1.004 | 1.020 | 0.906 |
| Center | 0.705 | 0.742 | 0.793 | 0.782 | 0.796 | 0.810 | 0.810 | 0.810 | 0.807 | 0.815 | 0.850 | 0.793 |
| Northwest | 0.873 | 0.909 | 0.915 | 0.903 | 0.892 | 0.886 | 0.842 | 0.812 | 0.771 | 0.769 | 0.791 | 0.851 |
| South | 0.850 | 0.891 | 0.861 | 0.795 | 0.796 | 0.795 | 0.760 | 0.756 | 0.721 | 0.732 | 0.729 | 0.790 |
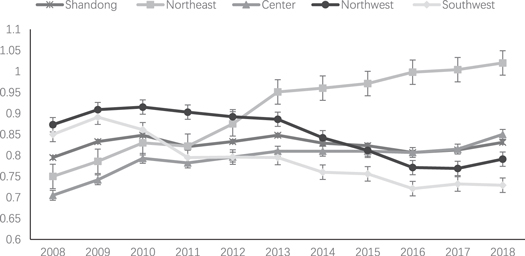
Figure 2. The evolution of AEE of the four regions in Shandong province.
Download figure:
Standard image High-resolution imageAs shown in table 2, the average value of AEE in Shandong was 0.827, which was at the medium level. It means that Shandong province still had potential to further improve its performance. Among the four regions, the northwest region had the highest efficiency, while the AEEs of southern region was the lowest. As displayed in figure 2, the environmental efficiency of Shandong experienced an improvement, increasing from 0.795 in 2008 to 0.831 in 2018, although it was slight. Moreover, the AEE of Shandong province showed a decline during 2012 and 2016, but turned to grow from 2017. This temporal characteristic of AEEs Shandong province had witnessed could be explained by the effect of stringent environmental regulation, as represented by the 'Air Pollution Action Plan' and '2018–20 Action Plan for winning the blue sky war'.
From 2008 to 2018, the four groups of cities in Shandong exhibited the following changes in AEEs. First, the AEEs in northeast region increased significantly, from 0.75 in 2008 to 1.02 in 2018. Meanwhile, the central region also achieved a progress, from 0.705 in 2008 to 0.85 in 2018. The increasing trend of AEEs in northeast region could be explained by the geographic location and development orientation. The governments of coastal cities in northeast region put more efforts on clean industries to develop their economy. The capital effect may explain the increase of AEEs in central region. However, Northwest, and Southwest regions showed a decrease in AEEs. Second, the AEEs of Dongying and Weihai were greater than 1, suggesting the local governments had put great emphasis on the AEE management. On the contrary, the average AEE of Weifang was lowest among all cities, indicating the local government should put more efforts on environment protection.
3.2. GML Index
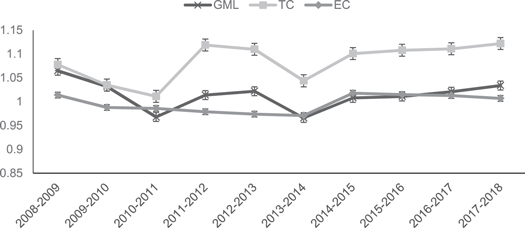
To further analyze the dynamic changes and driving factors of the atmospheric environmental efficiency in Shandong Province, this paper calculated the GML index of AEEs and decomposed their changes into technical efficiency and technical progress. The annual cumulative growth and geometric average of AEEs and its decomposed components are reported in table 3. The temporal trends of cumulative productivity growth, efficiency change and technical change of Shandong are depicted in figure 3.
Table 3. The growth of AEEs and its components in Shandong:2008–2018.
| City | Cumulative growth | Geometric average | ||||
|---|---|---|---|---|---|---|
| GML | EC | TC | GML | EC | TC | |
| Binzhou | 0.701 | 0.754 | 0.930 | 0.967 | 0.974 | 0.996 |
| Dezhou | 1.001 | 1.040 | 0.964 | 1.002 | 1.006 | 0.999 |
| Dongying | 1.102 | 0.978 | 1.128 | 1.012 | 1.000 | 1.015 |
| Heze | 0.778 | 1.036 | 0.752 | 0.977 | 1.005 | 0.975 |
| Jinan | 1.800 | 1.187 | 1.449 | 1.062 | 1.019 | 1.041 |
| Jining | 1.064 | 0.707 | 1.371 | 1.008 | 0.968 | 1.035 |
| Laiwu | 0.800 | 1.449 | 0.636 | 0.980 | 1.040 | 0.958 |
| Liaocheng | 0.828 | 0.792 | 1.046 | 0.983 | 0.979 | 1.007 |
| Linyi | 1.081 | 0.857 | 1.181 | 1.010 | 0.987 | 1.020 |
| Qingdao | 1.670 | 1.000 | 1.670 | 1.055 | 1.002 | 1.056 |
| Rizhao | 0.636 | 0.592 | 1.075 | 0.957 | 0.951 | 1.010 |
| Tai'an | 1.000 | 1.066 | 0.963 | 1.002 | 1.008 | 0.999 |
| Weihai | 1.009 | 1.001 | 1.009 | 1.003 | 1.002 | 1.004 |
| Weifang | 1.256 | 0.962 | 1.308 | 1.025 | 0.998 | 1.030 |
| Yantai | 1.646 | 0.971 | 1.697 | 1.053 | 0.999 | 1.057 |
| Zaozhuang | 0.910 | 1.422 | 0.934 | 0.992 | 1.038 | 0.996 |
| Zibo | 1.522 | 0.966 | 1.577 | 1.045 | 0.998 | 1.049 |
| Total | 1.071 | 0.986 | 1.134 | 1.009 | 1.001 | 1.015 |
| Northeast | 1.442 | 0.991 | 1.459 | 1.037 | 1.001 | 1.039 |
| Center | 1.276 | 1.126 | 1.187 | 1.023 | 1.013 | 1.016 |
| Northwest | 0.908 | 0.891 | 1.017 | 0.991 | 0.990 | 1.004 |
| South | 0.894 | 0.923 | 1.062 | 0.989 | 0.990 | 1.007 |
Note: The values of TC in this table are reported with the best practice gap change (BPC).
Figure 3. The trends of GML index, efficiency change and technical change in Shandong.
Download figure:
Standard image High-resolution image
As reported in table 3 and figure 3, the GML index of Shandong Province experienced a fluctuation from 2008 to 2018. Over the study period, the GML index increased by 7.15%, and the geometric average value was 1.009, suggesting an average annual increase of 0.93%. with respect to the decomposition results in Shandong province, the technical change (TC) was less than 1, which indicates that the improvement of AEE was mainly contributed by technical progress in Shandong Province rather than the efficiency change. Therefore, the local government should make better use of the input to improve the environment management.
Regarding with each region, the GML index of northeast and central regions increased during the study period, with a cumulative increase of 45.8% and 27.8%, respectively. However, the two regions were slightly different, the technical efficiency of northeast region was less than 1, and the technical change had increased by 47.2%, which means that the improvement of AEE was mainly contributed by the technological progress in northeast region. Furthermore, both efficiency change and technological change in central region were greater than 1, indicating both technical progress and administration ability contributed to the improvement of AEE. The GML indices of northwest and south region were less than 1 over the study period, which was caused by the outperformance of the inhibition effect of the technical efficiency to the stimulating effect of the technical progress in these two regions.
3.3. Theil Index
In order to further identify the regional differences of atmospheric environmental efficiency in Shandong Province, this paper used the Theil index to analyze the regional differences as shown in table 4.
Table 4. Theil index and decomposition results.
| Year | Overall difference | Intra-group difference | Inter-group difference | ||
|---|---|---|---|---|---|
| Value | Ratio (%) | Value | Ratio (%) | ||
| 2008 | 0.0252 | 0.0221 | 87.7000 | 0.0031 | 12.30 |
| 2009 | 0.0224 | 0.0196 | 87.5000 | 0.0028 | 12.50 |
| 2010 | 0.0170 | 0.0166 | 97.6500 | 0.0004 | 2.35 |
| 2011 | 0.0126 | 0.0120 | 95.2400 | 0.0006 | 4.76 |
| 2012 | 0.0107 | 0.0103 | 96.2600 | 0.0004 | 3.74 |
| 2013 | 0.0106 | 0.0092 | 86.7900 | 0.0014 | 13.21 |
| 2014 | 0.0125 | 0.0102 | 81.6000 | 0.0023 | 18.40 |
| 2015 | 0.0133 | 0.0106 | 79.7000 | 0.0027 | 20.30 |
| 2016 | 0.0175 | 0.0119 | 68.0000 | 0.0056 | 32.00 |
| 2017 | 0.0154 | 0.0099 | 64.2900 | 0.0055 | 35.71 |
| 2018 | 0.0180 | 0.0120 | 66.6700 | 0.0060 | 33.33 |
| Average | 0.0159 | 0.0131 | 82.3900 | 0.0028 | 17.61 |
This results in table 4 suggest several findings as follows. First, the AEE of Shandong reduced from 0.0252 in 2008 to 0.018 in 2018, implying the regional difference of environmental efficiency had been narrowing. Second, the contribution of the intra-group difference to the overall difference was much higher than the inter-group difference. Last, the contribution of the intra-group difference had decreased from 87.7% in 2008 to 66.67% in 2018, while the contribution of the inter-group difference had risen from 12.3% in 2008 to 33.33% in 2018.
3.4. Regression analysis
In this section, this paper investigates the factors influencing the atmospheric environmental efficiency. The factors include economic development, industrial structure, technical innovation, openness degree, population density and informatization. Table 5 presents the definitions of all variables.
Table 5. Variable definitions.
| Name | Abbreviation | Description | |
|---|---|---|---|
| Dependent Variable | Atmospheric Environmental Efficiency | AEE | The values of atmospheric environmental efficiency calculated with super-SBM method |
| Independent Variables | Economic Development | GDP | GDP per capital |
| Industry Structure | IS | The ratio of added value of manufacturing industry over GDP | |
| Technical Innovation | TI | Patent applications per 10 thousand people | |
| Opening-up | OP | The ratio of export and import value over GDP | |
| Population Density | PD | Urban population density/(person/square kilometer) | |
| Informatization | INFO | The number of internet users |
Note: all values of each variable are continuous.
The data of all controls were collected from the statistical yearbook of Shandong Province and the statistical yearbook of Chinese cities from 2008 to 2018.The per capita GDP, urban population density and the number of Internet users were logarithmically processed. The regression equation is specified as follows:


Where  represents city.
  denotes year.
6
denotes year.
6
 is the error term. Table 6 reports the estimation results of the pooled regression, random effects regression, and fixed effects regression. As shown in this table, the rejections of the null hypothesis in LM test and Huasman test suggest that the fixed effects model should be selected for empirical analysis.
  is the city dummy controlling the time-invariant effects.
  is the year dummy capturing the time-variant effects.
Table 6. The estimation results.
| Pooled | Random effects | Fixed effects | |
|---|---|---|---|
| lnGDP | 0.153* | 0.329*** | 0.546** |
| (0.109) | (0.168) | ||
| (0.019) | |||
| IS | 0.551 | −0.133 | −0.517*** |
| (0.227) | (0.209) | (0.524) | |
| lnTI | 0.025*** | 0.022*** | 0.011*** |
| (0.013) | (0.020) | (0.015) | |
| OP | 0.024 | −0.062 | −0.377*** (0.763) |
| (0.045) | |||
| (0.023) | |||
| lnPD | 0.044 | 0.081* | 0.152** |
| (0.023) | (0.047) | (0.038) | |
| lnINFO | −0.073*** | −0.116*** | −0.174 |
| (0.034) | (0.043) | (0.113) | |
| Year | YES | YES | YES |
| City | YES | YES | YES |
| constant | −0.356*** | −1.498*** | −2.616*** |
| (0.103) | (0.308) | (0.644) | |
| Adjust R2 | 0.441 | 0.426 | 0.309 |
| Tests | LM test:68.44 (0.000) | Hausman test:20.54 (0.013) | |
Note: *** p < 0.01, ** p <0.05, * p < 0.1. Robust standard deviations in parentheses.
It can be seen from table 6 that the coefficient of GDP was positive and significant at 5% confidence level, which suggests that economic development has a positive impact on atmospheric environment. The positive relationship between economic development and environment means that Shandong Province had crossed the turning point and stepped into the increasing stage of the environmental Kuznets curve (EKC). Moreover, the coefficient of TI was also positive and significant, indicating that the environmental efficiency was positively associated with technical innovation. It is easy to understand that innovations in the production, especially in pollution abatement, help reduce the pollutant emissions. Next, the coefficient of PD was found to be positive and significant, indicating that the denser the population is, the more efficient the atmospheric environment is. The reason to this finding is that the appropriate increase of population density is conducive to the make best use of public facilities, improve the utilization efficiency of resources and energy, and reduce the emission of pollutants.
The IS term carried a negative and significant coefficient, which can be interpreted as a negative relation between industry structure and environment efficiency, ascribing to the high concentration of heavy chemical industry and the high proportion of coal in energy consumption in Shandong province. The coefficient of OP was found to be negative and significant at 1% confidence level, meaning that the degree of opening-up negatively affects the environmental efficiency. This finding could possibly be explained by the well-known Pollution Haven Hypothesis (PHH), which suggests that the polluting industries from developed countries will relocate to developing countries with less stringent environmental regulations. The PHH has been tested to hold in the context of China by many studies (Xu et al 2021). As a coastal city, Shandong province is more likely to attract abroad investments from polluting industry due to its industry structure.
4. Conclusion
4.1. Discussion
The purpose of this study is to calculate the atmospheric environmental efficiency of 17 cities in Shandong from 2008 to 2018, using the annual average data of input, output, and emissions from 11 cities in Shandong Province and employing the super-SBM model that considers undesired output. Moreover, the spatial-temporal differences are analyzed by using the GML index and Theil index. Finally, the influencing factors of environmental efficiency are investigated.
The results show that (1) the overall efficiency of the atmospheric environment in Shandong was relatively high. The northwest region had the highest efficiency, while the southern region was the lowest; (2) The improvement of the environmental efficiency was mainly contributed by technical progress, rather than efficiency promotion; (3) The spatial difference in the efficiency showed an increasing trend, which can be mostly explained by the inter-group difference; (4) Economic development, technological innovation, and population density had positive effects on the environmental efficiency. However, the effects of industrial structure and opening-up are negative.
4.2. Implication
This study has rich policy implications. First, the government should make better use of the existing resources to ameliorate environment management as suggested by the low contribution of efficiency change (EC) to environmental efficiency. Second, the regional gaps of environmental efficiency should be reduced by putting more resources and efforts to the environment protection of the regions with low environmental efficiency, as it is the main source of overall differences. Third, the most critical measures the government should adopt are to encourage technical innovations and pollution abatement investment. Finally, the government should upgrade the industry structure to avoid over dependence on chemical industry and cultivate environment friendly industry.
Data availability statement
No new data were created or analysed in this study.
Footnotes
- 1
- 2
- 3
- 4
The 5 cities are Zibo, Jinan, Liaocheng, Linyi, Zaozhaung. (http://mee.gov.cn/xxgk2018/xxgk/xxgk15/202005/t20200507_777895.html)
- 5
- 6
The reason why we didn't use weekly data is that the data of all controls was reported yearly.