

Abstract
Tree planting has the potential to address a wide range of environmental and economic challenges. However, planting initiatives can also do more harm than good. Characteristics such as land tenure and land use before conversion to tree plantation are key to assessing the potential risks and benefits of tree planting initiatives. Here, we present a new remote sensing technique to distinguish tree plantations from natural forests, measure plantation expansion, and specify pre-conversion land use. Focusing on Northern Mozambique, we found that 70% of large-scale tree plantation expansion between 2001–2017 occurred on cropland, while the remainder occurred on natural forest and grasslands. We also compare our remote sensing-derived plantation data with government cadastral records. Over 40% of plantation expansion occurred on lands not legally designated for this land use. Where tree plantation expansion is intended to mitigate climate change mitigation and boost rural economies, improved land monitoring techniques are needed to support assessment of the climate- and socio-economic impacts of expansion. The remote sensing technique presented here can support such assessments, increase transparency and facilitate adaptive management.
Export citation and abstract BibTeX RIS

Original content from this work may be used under the terms of the Creative Commons Attribution 4.0 licence. Any further distribution of this work must maintain attribution to the author(s) and the title of the work, journal citation and DOI.
1. Introduction
Tree planting features heavily in strategies to restore ecological functioning of landscapes; mitigate climate change; conserve biodiversity; diversify rural livelihoods; and fulfill demands for wood, fuel, and fiber while relieving pressure on natural forests. Consequently, tree planting has become the intervention of choice for national governments, corporations, organizations, and funders. Although often presented as a panacea for a wide range of environmental and economic challenges, tree planting initiatives vary in significant ways and a large proportion end in failure (Duguma et al 2020). Poorly planned initiatives can exacerbate climate change, degrade habitats, and jeopardize livelihoods (Fleischman et al 2020). Key questions to assessing the potential risks and benefits of tree planting initiatives are (1) who owns the land trees are planted upon (local communities, government, or corporations); (2) what species are planted (slow or fast growth, exotic or native); and (3) where does planting occur (on land previously used for natural forest, grassland, or agriculture).
To reduce the risks of adverse impacts of tree planting initiatives, numerous entities have provided guidance, clarified definitions of natural versus planted forest, and recommended best practices in landscape restoration interventions (Chazdon et al (2020)). However, widely used land monitoring practices have not kept apace. Remote sensing-based assessments typically do not distinguish between planted trees and natural tree cover (Brancalion and Chazdon 2017). Quantifying all tree cover collectively obfuscates metrics of natural forest dynamics and frustrates efforts to verify progress toward specific planting goals (Chazdon 2008). As countries and organizations strive to plant trillions of trees and restore millions of hectares under the Bonn Challenge and other initiatives (Supplementary Information – SI 2 (available online at stacks.iop.org/ERC/3/115009/mmedia)), improved land monitoring techniques are needed to facilitate transparency, accountability, and adaptive management of tree planting initiatives.
Here we focus on large-scale tree plantations, a planting approach used by a large proportion of projects (Brancalion and Holl 2020). Using Northern Mozambique as a study area, we introduce a new remote sensing technique to distinguish tree plantations from natural forests, measure plantation expansion, and disaggregate tree plantations based on pre-conversion land use. Lastly, we compared our remote sensing-derived tree plantation data with government cadastral records.
2. Background
2.1. Northern Mozambique
Northern Mozambique (382,000 km2) is a relevant study area, with all of the major identified risks and benefits of tree plantation expansion. One of sixty-one signatories of the Bonn Challenge, Mozambique aims to increase its commercial tree plantation area to 1 million hectares by 2030 (Serzedelo de Almeida and Delgado 2019, The Bonn Challenge 2021). Current efforts focus on the northern provinces, which have been characterized both as a bastion of available land and a hotspot of large-scale land acquisitions (Di Matteo and Schoneveld 2016, Kronenburg García et al 2021). With the average farm size in Mozambique measuring less than two hectares (Smart and Hanlon 2014), and land titles for tree plantations averaging over 100,000 hectares, massive plantation expansion could threaten rural livelihoods and displace tens of thousands of smallholder family farms. However, tree plantation expansion can also benefit local communities, especially when communities successfully negotiate equitable compensation packages with private companies wishing to acquire usage rights of community lands. Such packages can include creating employment opportunities; building essential infrastructure; offering employee benefits such as housing, medical care, education; paying royalties; supporting small scale plantations; and establishing community development funds. When the (legally non-binding) compensation agreements are respected, tree plantation expansion can be a significant boost to local development (Bleyer et al 2016).
Most of the study area lies within Miombo ecoregions. Often subject to natural and anthropogenic disturbance, Miombo woody and herbaceous vegetation are characterized by their high natural recovery capacity after disturbance due to agriculture, charcoal production, logging, and fire (Jew et al 2016). Tree plantation expansion onto natural forest and grassland presents a risk of increasing net carbon emissions (Lewis et al 2019). Emissions from clearing natural forest might not be counteracted by an equal or larger amount of greenhouse gas emissions sequestered by tree plantations established on the same area of land. Given the high recovery rate of Miombo woody and herbaceous vegetation, it may be more efficient to increase tree cover through natural regeneration than by converting Miombo grasslands to tree plantations (Fleischman et al 2020). However, wood from tree plantations established on cropland and severely degraded woodlands could relieve pressure on more pristine areas as 86%–100% of households in the study area rely upon fuelwood – typically gathered from natural woodlands – for cooking (Woollen et al 2016).
Understanding the actual social, environmental and economic impacts of tree plantation expansion requires (among other things) comprehensive land monitoring that includes assessment of the type and location of new tree plantations and the use of the land prior to conversion to tree plantation. However, such information is lacking in Mozambique (Food and Agriculture Organization 2015). Past remote sensing assessments of land use have focused on miombo forests attributes and changes due to shifting cultivation, fire, and natural regeneration (Sá et al 2003, Sedano et al 2005, Marzoli 2007, Ribeiro et al 2008, Mitchard et al 2013, Ryan et al 2014). In the absence of precise information on tree plantation expansion, government estimates have been based on statistics derived from annual production plans and 'expert judgement' (Food and Agriculture Organization 2015). This is important in Mozambique as it aims to drastically increase its commercial tree plantation area from 75,000 hectares (the estimated area reported in Mozambique's 2015 Forest Resources Assessment report) to 1 million hectares by 2030. Current efforts focus on the northern provinces, our study area, where the government has identified millions of hectares of land suitable for tree plantations (Republic of Mozambique 2013). The land monitoring technique presented in this study help address this gap in knowledge of tree plantation extent and location.
2.2. Remote sensing of tree plantations
Numerous remote sensing assessments have succeeded in mapping tree plantation extent and disaggregating it from natural forests (table 1). Yet, very few studies have also assessed the land use and cover before conversion to tree plantation (Echeverría et al 2006, Zamorano-Elgueta et al 2015, Heilmayr et al 2016, Poortinga et al 2019). This widely under-documented variable is critical to understanding the social, economic and environmental risks and potential benefits of plantation expansion. Remote sensing assessments of tree plantations in Africa area rare and none thus far have addressed land use prior to conversion to tree plantation.
Table 1. Previous studies that used remote sensing to map tree plantations.
| Study | Country or region | Plantations mapped | Method | Imagery | Accuracy (class, overall) | Multi-temporal |
|---|---|---|---|---|---|---|
| Africa | ||||||
| Jansen et al 2008 | Southern Africa (Mozambique) | Multi | Visual interpretation | VHR (<1 m) | NA, NA | Yes |
| Kimambo et al 2020 | East Africa (Tanzania) | Multi (pine, eucalypt, etc) | Visual interpretation | VHR (<1 m) | NA, NA | No |
| Asia | ||||||
| Dong et al 2012 | East Asia (China) | Rubber | Neural network, phenological metrics | PALSAR (50 m), MODIS (250–500 m) | 85%, 89 | No |
| Dong et al 2013 | East-Asia (China) | Rubber | Neural network, phenological metrics | Landsat (30 m), MODIS (250–500 m) | 96%, 92% | No |
| Chen et al 2016 | East Asia (China) | Rubber | Decision tree classification, Phenology-based algorithm | PALSAR (25 m), Landsat (30 m) | 88%, 95% | No |
| Chen et al 2018 | East Asia (China) | Rubber | Decision tree classification, phenological metrics | PALSAR (25 m), Landsat (30 m) | 92%, 97% a | Yes |
| Hua et al 2018 | East Asia (China) | Multi (eucalypt, cedar, etc) | Random forest classification | Landsat (30 m) | 70%, 85% ** | Yes |
| Kumar et al 2008 | South Asia (India) | Apple | Isodata (unsupervised) classification, manual class assigned | LISS III (23.5) | NA, 91% | No |
| Li and Fox 2012 | Southeast Asia (multi country) | Rubber | Mahalanobis typicality classification | MODIS 250 m | 94%, - ** | Yes |
| Li et al 2015 | East Asia (China) | Rubber | Phenology-based algorithm | Landsat (30 m) | 98%, 89% | No |
| Miettinen et al 2012 | Southeast Asia (multi) | Multi (palm, pine etc) | Visual interpretation | Landsat (30 m), SPOT (10–20 m) | 94%, 89% | Yes |
| Poortinga et al 2019 | Southeast Asia (Myanmar) | Rubber, oil palm | Decision tree classification, Monte-Carlo simulations | Landsat (30 m), Sentinel 1 (10 m), Sentinel 2 (10 m) | 84%, 84% | No |
| Shevade et al 2017 | Malaysia | Rubber, oil palm | Median likelihood classification | Landsat (30 m) | 89%, 97% | Yes |
| Sun et al 2017 | East Asia (China) | Rubber | Decision tree classification | Landsat (30 m) | 90%, 86% | Yes |
| Xu et al 2018 | East Asia (China) | Multi (citrus) | Random forest classification | Landsat (30 m), ASTER (30 m) | 91%, 94% | Yes |
| North America | ||||||
| Fagan et al 2015 | Central America (Costa Rica) | Multi | Random forest classification | HyMap (14–16 m), Landsat (30 m) | 84%, 86% | No |
| Fagan et al 2018 | North America (USA) | Pine | CART decision tree classification | Landsat (30 m), G-LiHT (15 m) | 84%, 92% | No |
| South America | ||||||
| Echeverría et al 2006 | South America (Chile) | Multi | Maximum likelihood classification | Landsat (30 m) | 89%, 85% | Yes |
| Heilmayr et al 2016 | South America (Chile) | Multi | Maximum likelihood classification | Landsat (30 m) | 85%, 86% | Yes |
| Zamorano-Elgueta et al (2015) | Chile | Multi (pine, eucalypt, etc) | Maximum likelihood classification | Landsat (30 m) | 80%, 84% | Yes |
| Global | ||||||
| Curtis et al 2018 | Global | Multiple | Visual interpretation | VHR (<1m) | 89%, 89% | Yes |
| Le Maire et al 2014 | South America (Brazil) | Eucalyptus | Time series matching algorithm, OBIA (growth) | MODIS 250 m | 86%, 87% | Yes |
| Petersen et al 2016 | Multi region (Brazil, Cambodia, Colombia, Liberia, Malaysia, Peru) | Multi | Visual interpretation, supervised classification | Landsat (30 m) | 84%, 87% | No |
a Partially adapted from Petersen et al 2016.
Past remote sensing assessments of tree plantations can be divided into four groups of approaches (table 1). The first relies upon visual interpretation of very high resolution imagery to distinguish tree plantations from natural vegetation (Miettinen et al 2012, Petersen et al 2016, Curtis et al 2018, Kimambo et al 2020). This approach is effective but time consuming to implement and more susceptible to human error than other techniques. The second group uses traditional classifiers on multispectral imagery to interpret the spectral signatures of tree plantations relative to other features in the landscape (Li et al 2015). This approach has been successfully applied in Asia (Sun et al 2017, Xu et al 2018, Poortinga et al 2019), Central America (Fagan et al 2015) and South America (Zamorano-Elgueta et al 2015, Heilmayr et al 2016). The third group of studies utilizes intra-annual phenology-based algorithms, sometimes in conjunction with supervised classification algorithms, to identify tree plantations. Most of these studies focus on rubber plantations in East Asia where the plantation phenology differs greatly from that of agriculture and natural vegetation during the foliation and defoliation seasons (Dong et al 2012, Dong et al 2013, , Chen et al 2018). The final group also uses phenology, but places greater emphasis on inter-annual growth metrics and change events (Le Maire et al 2014).
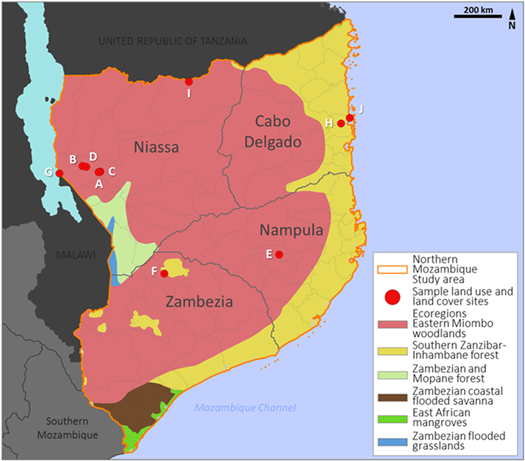
Techniques that can detect plantations in one geography may not necessarily be effective in another. The main challenge to applying these approaches to Northern Mozambique is the landscape's diversity and intra-class spectral variability. Our study area spans six different ecoregions and includes a variety of natural evergreen and deciduous forest types that can appear similar to tree plantations (figures 1(E)–(J)). Furthermore, the spectral signature of tree plantations changes drastically with age, as newly established plantations resemble bare land, cropland or wooded grasslands, and mature plantation are easily confused with natural forests (figure 1, A-D) (Li and Fox 2012). Even across tree plantations of the same age, spectral signatures can vary widely with different species, soil types, nutrition, disease status, and levels of disturbance.
Download figure:
Standard image High-resolution image
Figure 1. Map of the Northern Mozambique study site with ecoregions and a selection of sub-sites with tree cover featuring land use and land cover classes with tree cover.
Download figure:
Standard image High-resolution imageA. Young eucalyptus, (−13.4468°, 35.6288°); B. Mature eucalyptus (−13.3270°, 35.3158); C. Young pine (−13.4360°, 35.6599°); D. Mature pine (−13.3431°, 35.3877°); E. Mango (−15.0475°, 39.14509°); F. Macadamia, (−15.4167°, 36.9095°); G. Eastern Miombo deciduous woodland (−13.4694°, 34.8642°); H. Southern-Zanzibar Inhambane Coastal semi-evergreen forest (−12.5013°, 40.3508°); I. Riparian evergreen forest (−11.691°, 37.3878°); J. Mangrove (−12.3931°, 40.5205°).
The locations mapped in the first panel of figure 1 are the same locations shown in ground-based photographs and satellite imagery in the second panel of figure 1. The rectangular ground-based photographs were acquired by the co-authors during field visits in 2017, while the circular satellite images are very high resolution satellite images from Google Earth centered around the (lat, long, WGS84) coordinates provided above with a radius of 100 meters. Google Earth attribute information and image acquisition dates are provided for each site.
3. Methods
We defined tree plantations as lands with trees planted primarily for wood, food, and raw material production that do not resemble natural or semi-natural forests in structure, species composition or age structure. We identified various types of tree plantations based on literature and field visits, including fast growth pine and eucalyptus trees, as well as macadamia, mango and citrus trees (figure 1) and we generated training data that represented this diversity of tree plantations. Our tree plantation detection algorithm ultimately aimed to identify tree plantations regardless of sub-type. The other (non-tree plantation) land use classes that we assessed with a Random Forests supervised classification algorithm are identical to the IPCC (Intergovernmental Panel on Climate Change) land use categories: cropland (field crops exclusively), forest (natural), grassland, settlement, wetland and other land. These classes are described in more detail in Supplementary Information 3 (Penman et al 2003). The assessment of prior land use focused on the cropland, forest and grassland classes, as settlement, wetland and other land conversions to tree plantation were virtually non-existent in our study area. Although forest and grassland were mapped separately in the four time periods, we merged these classes into a single natural vegetation class for the trajectory analysis to improve accuracy and to reflect the dynamic and cyclical relationship between these two classes in the predominantly Miombo study area. An overview of our remote sensing workflow is provided in figure 2, with more details in the Extended Methods Section.
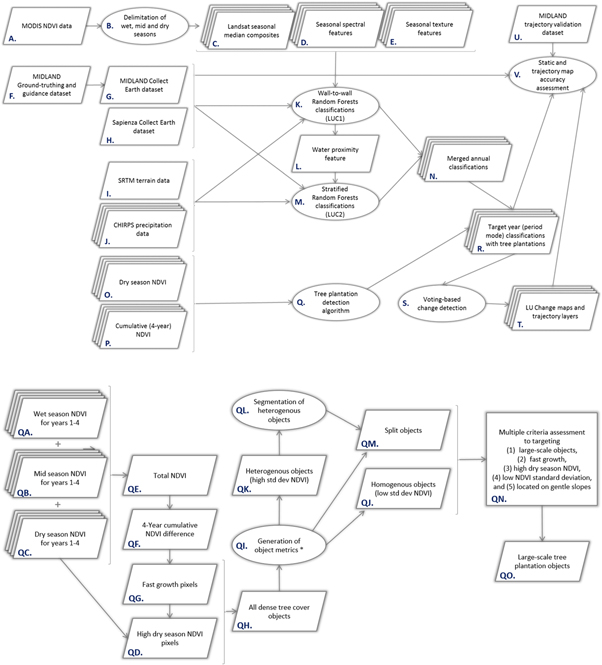
Figure 2. Workflow diagram.
Download figure:
Standard image High-resolution imageGiven the order of magnitude in the difference between the average smallholder farm measuring less than two hectares (Smart and Hanlon 2014) and the average land title for tree plantations, which may be up to 100,000 hectares (Di Matteo and Schoneveld 2016), we applied a threshold of five hectares to exclude smallholder woodlots from our assessment of large-scale tree plantations. This five-hectare threshold is consistent with local and global research on field size (Smart and Hanlon 2014, Samberg et al 2016, Food and Agriculture Organization of the United Nations (2014)).
We mapped land use and land use change in Northern Mozambique from 2001 to 2017, including tree plantation expansion and pre-conversion land use. Our methods drew upon four different remote sensing approaches that are typically used independently: visual interpretation, supervised classification, phenology and growth-based algorithms, and object-oriented image analysis (section 2.2, figure 2). We generated training and testing data through visual interpretation of very high resolution satellite imagery with Collect Earth and Google Earth software. We used supervised classification algorithms to identify the main land use classes within the study area. To identify tree plantations and disaggregate this class from natural forests, we developed a phenology- and growth-based algorithm. We used object-based image analysis to refine and improve the results of the tree plantation detection algorithm.
3.1. Image processing
Northern Mozambique is a large and varied landscape, approximately 382,000 km2 in size. To assess land use changes throughout this vast area over a 17-year reference period, this study used all available USGS Landsat 7 and Landsat 8 imagery from the years 2000–2018, but focused its analysis on four points in time - i.e., 2001, 2006, 2012 and 2017 - that bookend the wave of foreign direct investments that began around 2008 and peaked in 2012. We accessed and processed the Landsat imagery in Google Earth Engine following steps, including cloud masking and median pixel composting, described in more detail by Bey et al 2020 and Flood 2013.
3.2. Training and testing data
To train and test our classification algorithms, we contributed to and used a national dataset created for the SECOSUD project in collaboration with Sapienza University, Universidade Eduardo Mondlane (UEM), and Université catholique de Louvain (UCLouvain) (SECOSUD 2020). As several classes and time periods were under-represented in this dataset, we complemented it with our own land use and land cover (LULC) dataset produced by a joint UCLouvain-UEM team (Meyfroidt 2015). Both datasets used Collect Earth software, a free tool developed by the Food and Agriculture Organization of the United Nations to facilitate land assessment with freely accessible satellite imagery within Google Earth (Bey et al 2016). In Mozambique, this imagery included scenes acquired by Digital Globe (e.g. WorldView 3 and WorldView 4 satellites which have a 0.31 m spatial resolution, and QuickBird, which has a 0.65 m spatial resolution) and SPOT (e.g. SPOT 6 and 7 of 1.5 m resolution).
3.3. Supervised classifications and temporal filtering
Certain classes in the study area, e.g. mangrove, other land, settlement and wetland have more consistent spectral signatures across the different ecoregions within the study area. Consequently, these classes were assessed with a single, nation-wide classification of each year of the reference period. In contrast, the cropland, forest, and grassland classes vary drastically within and between ecoregions. To optimize classification results for these classes, we conducted a series of supervised classifications using a spatially constrained subset of our training samples (Graesser and Ramankutty 2017). We divided the study area into water availability zones based on total annual precipitation and distance to wetland pixels derived from the national classifications. Eight classes were generated based on half quartiles of the total annual precipitation and the range of distance to water values. The supervised classification of each zone used training data from the target zone and the preceding and subsequent zones. The spatially overlapping results were resolved through a pixel voting technique in the which each pixel was assigned to the land use class with the highest number of 'votes' or occurrence within the pixel stack (Bruggeman et al 2016). Where an equal number of votes occurred for multiple land use class, we used a class hierarchy to determine the pixel land use class (Martínez and Mollicone 2012). In this manner, highland areas with high annual rainfall were assessed with floodplain areas where water availability for vegetation is similarly high. This is particularly important to minimizing misclassifications because Mozambique is characterized by a long dry season, during which foliation is largely controlled by water availability.
3.4. Tree plantation detection algorithm
The tree plantation detection algorithm builds upon the work of Dong et al 2012 and Le Maire et al 2014 by exploiting the phenological and growth-based time series attributes that distinguish plantations from most other features within the Northern Mozambique landscape. We deviate from these two works by also using Object-based Image Analysis techniques that render our approach more accurate for our particular study site, and also more robust, flexible and adaptable to other regions of the world.
These previous works, on rubber plantations in East Asia (Dong et al 2012) and eucalyptus in Brazil (Le Maire et al 2014), have focused on the defoliation and foliation phase to distinguish deciduous rubber plantations from – usually evergreen or semi-evergreen - natural forests. In most parts of our study site, the situation is inversed, as miombo and mopane forests loose more foliage during the dry season than pine, eucalyptus and other tree plantations. We therefore applied a threshold to identify pixels with high dry season NDVI that may have a land cover of semi-evergreen or evergreen tree plantations. Tree plantations can potentially be distinguished from natural forests using only phenology in some areas; however, additional measures are needed when working over a vast and heterogeneous region. Other LULC classes in Northern Mozambique, such as coastal, riparian, mangrove, and montane forests are also evergreen and can have spectral and textural signatures identical to some tree plantations at any given point throughout the year. Thus, we used time series data over multiple years to better disaggregate tree plantations from natural, non-deciduous vegetation types. Prior to planting trees, commercial enterprises often clear the land of pre-existing vegetation, and for the first year or two after planting, the spectral and textural signature of tree plantations resemble that of cropland. In the subsequent years as exotic tree species grow and their canopy coverage approaches 100%, their NDVI and other vegetation index values grow steadily, unlike lands used for field crop, where index values rise and fall with each planting and harvesting cycle. The intra-annual NDVI values for nearly all vegetation types undulate through the wet and dry seasons each year, but for young tree plantations, subsequent wet, mid and dry season NDVI values are marginally higher than those of the preceding year. Therefore, we use the total NDVI – a sum of the mean value over all three seasons – as our second main feature for identifying tree plantations.
After delineating potential tree plantation objects using high NDVI and fast growth pixels, we applied a multiple criteria assessment to remove the remaining non-plantation patches based on object-level metrics. This step removed objects (1) smaller than 5 hectares, (2) with steep slopes, (3) with a low percentage of fast growth pixels, (4) containing a disproportionate amount of mangrove or (5) water pixels; and (6) with a high standard deviation. We also excluded objects in the province of Cabo Delgado. Although the province contains lands that are ecologically optimal for tree plantation, multiple sources indicate that there are no large-scale tree plantations in this province (Food and Agriculture Organization 2015, Di Matteo and Schoneveld 2016). The resulting tree plantation layers were superimposed on to the classifications for their respective years, replacing whichever class was determined by the classification algorithms.
This final step involving object-based image analysis is key to the flexibility of this plantation identification algorithm. Parameters targeting plantation surface area, gradual slopes, fast growth rates, and high dry season NDVI can be broadly applicable to other assessments of large-scale fast-growth tree plantations in Miombo or other semi-dry and sub-humid ecoregions. To apply this algorithm in other ecoregions or to target different types of plantations, the criteria can be adjusted to better reflect the local context.
3.5. Comparison with cadastral records
Lastly, we made a spatial and quantitative comparison of our tree plantation data with corresponding information from government cadastral records. We obtained the spatial data associated with tree plantation land titles by submitting formal, written requests to the provincial governments of Nampula, Niassa and Zambezia. All through provided the records in Shapefile format. We processed the data in Google Earth Engine and compared it to our own remote sensing data generated in the same platform.
A description of the change detection, trajectory analysis, and accuracy assessment methods are provided in Supplementary Information 1.
4. Results
4.1. Overview of land use change in Northern Mozambique
An overview of the main land use dynamics in Northern Mozambique between 2001 and 2017 is presented in figures 3 and 4, while classification maps for the years 2001, 2006, 2012 and 2017 are provided in SI 4 along with a link to the accompanying interactive map. Over the 2001–2017 reference period, tree plantation area expanded by 175 ± 26 km2. Our approach proved effective to map tree plantations and other land use classes with overall accuracies of ranging from 84% to 97.6% and the highest class accuracy for plantation was achieved with the 2017 classification, 95.9% (SI 5). Older maps achieved lower overall accuracies and lower tree plantation class accuracy due to higher commission error with forest, grassland and cropland.

Figure 3. Overview of land use and land use change in Northern Mozambique between 2001 and 2017, including (A) the proportion of land use classes in each time period and (B) the area of trajectories in descending order with 95% confidence intervals.
Download figure:
Standard image High-resolution image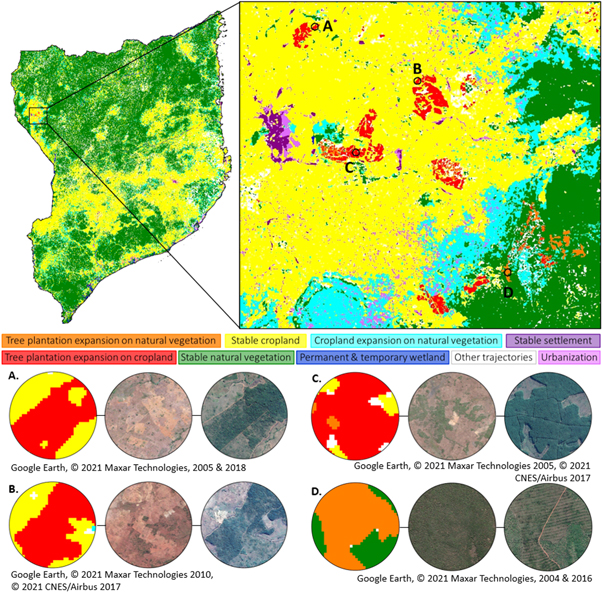
Figure 4. 2001–2017 Land use trajectories for Northern Mozambique and the Lichinga area with four examples of tree plantation expansion on cropland (A–C) and on forest (D) in the Lichinga area. In each row, the middle circle is a pre-conversion imagery and the last circle is the post-conversion tree plantation. The latitudes, longitudes, and years of VHR imagery in Google Earth are (A) −13.166°, 35.306°, 2005, 2018; (B) −13.238°, 35.446°, 2010, 2017; (C) −13.333°, 35.362°, 2005, 2017; and (D) −13.492°, 35.569°, 2004, 2016 respectively.
Download figure:
Standard image High-resolution image4.2. Tree plantation trajectories
Most new tree plantation land, 70%, was previously used for agriculture, while 30% was previously forest or grassland. The inset map of figure 4 provides a closer view of land use change in the Lichinga area, where the largest proportion of tree plantation expansion occurred.
4.3. Discrepancies between cadastral records and land use change data
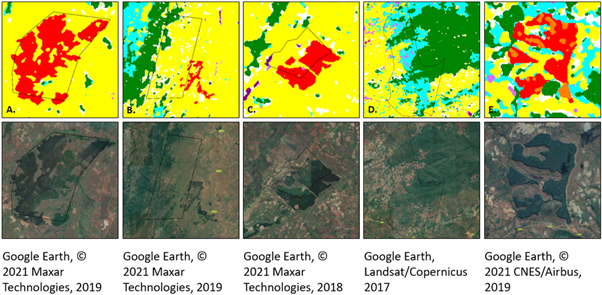
We found major discrepancies between the spatial boundaries of tree plantation land titles and plantation expansion observed through remote sensing. Our results show that cadastral records can be inaccurate, imprecise, out of date, or simply nonexistent (figure 5). Only 59% of the 17,500 hectares of tree plantations identified in 2017 fall within land title boundaries, while 41% are on lands not currently designated for this land use.
Figure 5. Tree plantation parcels with nearby land title boundaries that are (A) relatively accurate and precise, (B) neither accurate nor precise, (C) precise but not accurate, (D) either totally inaccurate or not currently active, and (E) absent or not up to date in the provinces cadastral registry. Legend of the land use / cover classes is the same as in figure 4.
Download figure:
Standard image High-resolution image
The total area covered by Northern Mozambique's tree plantation land titles is 831,000 hectares. The tree plantations identified within cadastral boundaries account for only 2.1% of the land allocated for plantations.
5. Discussion
Although tree plantation expansion covers a very small proportion, only 0.5%, of Northern Mozambique's land area, its socio-economic and ecological impacts may not be directly commensurate with their actual extent. The predominance of tree plantation expansion on cropland versus natural forests suggests that trade-offs might be more important with food security and livelihoods rather than with nature conservation. This is contrary to trends observed in other continents (Meyfroidt et al 2014, Zamorano-Elgueta et al 2015, Heilmayr et al 2016). Identifying where plantation expansion displaces croplands and replaces natural vegetation can be a critical component of a more comprehensive monitoring framework geared toward understanding local impacts on food security, livelihoods, biodiversity and other outcomes.
The scale of the discrepancy we found between the spatial boundaries of tree plantation land titles and plantation expansion observed through remote sensing is significant: slightly over 40% of plantation expansion has occurred on lands not currently designated for this land use. Small discrepancies between cadastral and actual boundaries can be expected due to adherence with national policies prohibiting plantation establishment on waterways, steep lands, and patches of natural vegetation, but these factors are unlikely explain such a large gap. The gap is significant for two main reasons. Firstly, because it presents a risk of adverse socio-economic and ecological impacts. Due to the size of the plantation blocks we accessed (5 hectares of more) and land use trends within Mozambique (see description of farm and plantation titles in the Methods section above), the tree plantation expansion identified here is more likely corporate- rather than community-driven. The land titling process in Mozambique requires (a) government-observed corporate and community consultations, (b) agreement on a compensation packages, and (c) government review of potential environmental impacts of the proposed use of the land to be titled (German et al 2016). This system is designed to safeguard national and local social, economic and environmental interests. Thus, the potential omission of this process for 41% of observed plantation expansion, for which there is no land title in the cadastral records, presents a risk that procedures to safeguard the social, economic and ecological interests were not pursued for these lands.
The second reason this discrepancy is significant is related to monitoring, management and reporting needs. Several prominent studies have used cadastral records as a proxy for land use data (Glover et al 2016, Davis et al 2020). But our results show that such data is an inadequate replacement for remote sensing information in some contexts. Beyond the inaccuracies of cadastral records in Mozambique, such data are not publically available, and are thus poorly suited to increase transparency in reporting. Furthermore, assessing tree plantation expansion through cadastral records without also considering prior land use does not enable land managers and decision makers to assess net progress toward climate change mitigation or job creation goals. As Mozambique and many other countries ramp up efforts to achieve ambitious Bonn Challenge commitments, climate change mitigation targets and rural development objectives through strategies that rely heavily on tree plantation expansion (Lewis et al 2019), it is important to monitor progress toward these goals in a robust manner that can support transparency and adaptive management.
6. Conclusion
This study underscores the importance of improved land monitoring that distinguishes planted trees from natural forests and identifies land use prior to conversion to tree plantation. This is essential to measuring and mitigating risks and also quantifying positive impacts of plantation expansion. Using remote sensing approaches, like the one featured in this study, governments and other entities can track progress of tree planting (and growing) while remaining vigilant of natural forest dynamics that could jeopardize the environmental benefits of planting initiatives, or expansion on cropland potentially entailing livelihoods tradeoffs. Although generating this data through remote sensing is challenging, we show that it is possible to design algorithms for monitoring the most pervasive type of planting with high accuracy over large areas and distinct ecoregions. The remote sensing technique we have presented draws upon freely accessible cloud-based software and satellite imagery and it could be used for widespread, methodologically consistent, timely and transparent monitoring of tree plantation expansion.
Acknowledgments
The co-authors wish to thank Dr Jordan Graesser and Dr Jinwei Dong for their technical and strategic advice during the image classification and algorithm development stages of this research project. The co-authors also wish to thank the Universidade Eduardo Mondlane and UCLouvain MIDLAND team for their assistance with field research (Julieta Jetimane, Sa Nogueira Lisboa) and collaboration to develop an interdisciplinary understanding of land use dynamics and drivers in Mozambique (Dr Dilini Vathsala Abeygunawardane, Dr Angela Kronenburg, Virginia Rodriguez Garcia, Dr Eduardo Henrique Da Silva Oliveira, Dr Natasha Ribeiro, and Dr Almeida Sitoe). The corresponding author also thanks Marcin Walter for his tireless support over many months while this research was conducted. This work was supported by the European Research Council (ERC) under the European Union's Horizon 2020 research and innovation program (Grant agreement No 677140 MIDLAND) and it contributes to the Global Land Programme (https://glp.earth).
Data availability statement
The data that support the findings of this study are available upon reasonable request from the authors.