

Abstract
Pre-breakdown phenomena in HFO1234ze-(E) gas, considered as a potential replacement of SF6 for medium voltage insulation, are studied in needle-plane electrode systems versus pressure (0.01 to 0.3 MPa) under positive impulse voltage. Measurements are also carried out in air and SF6 in the same conditions for comparison. At the lowest pressure in HFO, the propagation of fast streamers is observed. Above 0.03 MPa, breakdown is the consequence of the propagation of stepped leaders, with shapes and velocities nearly identical to those observed in SF6. Several leader features (minimum inception voltage, propagation length) show that leader formation and propagation is easier in HFO compared to SF6. In turn, this allow explaining why breakdown voltages in HFO are slightly lower than in SF6.
Export citation and abstract BibTeX RIS

Original content from this work may be used under the terms of the Creative Commons Attribution 4.0 licence. Any further distribution of this work must maintain attribution to the author(s) and the title of the work, journal citation and DOI.
1. Introduction
Sulphur hexa-fluoride (SF6) has been widely used since the 60' as insulation and arc quenching gas in Medium Voltage (MV) and High Voltage (HV) apparatus. SF6 shows excellent dielectric properties, with a three times higher dielectric strength in homogeneous fields compared to air. It also provides good dielectric performance in non-uniform fields, and in the presence of solid dielectric barriers. Unfortunately, SF6 is a greenhouse gas with high GWP (Global Warming Potential) close to 24 000, and atmospheric lifetime about 3200 years [1]. This triggered research to find replacement gases. Several promising candidates belong to the group of poly-fluorinated molecules: CF3I, fluoroketones, hydrofluoroolefins (HFO's), and fluoronitriles [2].
The present work is devoted to the study of pre-breakdown and breakdown properties of HFO1234-ze(E) (formula: C3H2F4), simply called 'HFO' in the following text. Its toxicity is quite well documented, since it has been used for several years as refrigerating fluid. It is non-toxic, non carcinogenic, non reprotoxic, and non-mutagenic [3]. Its toxicity indicators are at the same range as SF6 [4]. Previous dielectric measurements under uniform and divergent fields under impulse voltage showed slightly lower breakdown voltages compared to SF6 at atmospheric pressure [4–6]. It was also reported that discharges induce a marked degradation of HFO, producing fine black soot deposited on electrodes after breakdown. In divergent field the degradation of HFO induces almost no change of breakdown voltage, whereas a large drop occurs in quasi-uniform field [6, 7], attributable to greatly facilitated discharge inception with soot. Measurements carried out under dc in uniform field led to breakdown voltages equal to 83% of those measured in SF6 in the same conditions, and 250% of those measured in Air [5]. Other studies focused on models to predict the breakdown probability of HFO1234ze-(E) [8].
Today, few data concerning pre-breakdown processes in HFO are available, compared to other widely studied gases such as air or SF6. In such gases, rather different pre-breakdown phenomena occur in conditions relevant to medium voltage applications (several cm gap distances, pressure above 0.1 MPa). In air, breakdown results from the inception and propagation or 'streamers', made up of numerous luminous filaments constituted by a cold and moderately conducting plasma [9]. When streamers reach the opposite electrode, breakdown does not always immediately follows, e.g. in divergent electric fields (point-plane gaps). Several successive secondary streamers are required to induce the transition from the initial streamer to a breakdown arc. In SF6, breakdown results from the propagation of 'leaders', made up of few luminous channels constituted by a hot and conducting plasma [10]. Breakdown immediately follows when leaders reach the opposite electrode.
In SF6, the transition from a streamer breakdown mode to a leader breakdown mode occurs when the product of pressure (P) by distance (d) typically exceeds Pxd ≈ 0.1 MPa.cm [10]. In air, such transition occurs in very different conditions (Pxd ≈ 10 MPa.cm), i.e. no leader can be expected in conditions relevant to medium voltage systems. In HFO, no previous study was dedicated to prebreakdown phenomena, although the available breakdown data suggest that leaders could be involved in this gas with conditions relevant to applications (pressure above 0.1 MPa) [5]. In a similar way, swarm parameters of this gas are not yet known.
This experimental study was done in order to better characterize pre-breakdown processes in HFO: type of pre-breakdown processes involved, velocity, typical current and light signals, conditions required for inception and development. Experiments are done in divergent field (point-plane gap) with positive impulses applied to the point, since positive polarity constitutes the most critical condition for applications. Compared to previous breakdown studies [4–7], the investigated pressure range was extended toward low pressure down to 0.01 MPa. Although such pressure is not relevant to medium voltage applications, it is however helpful to better characterize the transition from streamer to leader process, and better highlight differences between gases.
2. Experimental methods
Measurements were done in needle-plane electrode geometry, with a tip radius of curvature Rc = 0.2 mm, a gap distance fixed to d = 50 mm, and a 10 cm diameter plane electrode. The corresponding field amplification factor β (maximum field/mean field) is 90.
Such point-plane gap allows obtaining a stable and reproducible discharge inception, with low statistical jitter. This was favourable for the study of propagation. Although this strongly inhomogeneous field is not directly representative of practical applications, the data obtained allow to better characterize and compare discharge propagation in different gases. Data were mainly obtained in HFO, but also in SF6 and air for comparison. The gas pressure P relevant for applications is in the range 0.1–0.3 MPa, and several experiments were also done at reduced pressure (0.01–0.1 MPa), in order to observe the transition from streamers to leaders in HFO and SF6.
A high voltage impulse of (0.8/1400 μs) shape and maximum amplitude Ua was used (0.8 μs: risetime to 0.9 × Ua ; 1400 μs: decay time to 0.5 × Ua ). Measurements were done with positive high voltage applied to the point. The measurement of pre-breakdown currents under impulse voltage is usually difficult, because of the large disturbance induced by the electrode charging current (i.e. capacitive current) flowing during voltage rise. In this study, pre-breakdown currents were measured on the point side connected to high voltage, using a 5 Ω series resistor connected to a 100 MHz analog fibre optic link (figure 1). With the shielded point holder used here, only the current passing through the point extremity is measured. With this arrangement, the electrode charging current seen on measurements during voltage rise is reduced down to a few mA. This small disturbance allows the easy measurement of pre-breakdown currents superimposed on it. Pre-breakdown currents related to streamer or leader inception, several 10 mA in amplitude, can be measured even when inception occurs during the voltage rise.
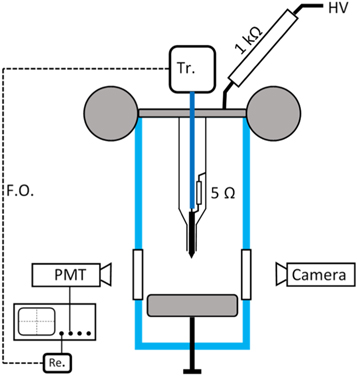
Figure 1. Experimental system used to characterize pre-breakdown phenomena in HFO, SF6, and air. Tr:100 MHz analog fiber optic transmitter, Re: receiver, F.O.: optical fiber.
Download figure:
Standard image High-resolution imageHowever, since currents are not measured through the complete high voltage electrode (i.e. including the point holder), only a fraction of the total pre-breakdown current is recorded, according to the Shockley–Ramo theorem [11]. Charges moving in the vicinity of the point extremity are strongly 'coupled' to the measurement electrode and induce a maximum current, whereas those moving farther in the gap are less 'seen' by the electrode extremity [11]. The system is thus very efficient to detect discharge inception, but underestimates the actual current of long discharges.
A photomultiplier (PM, Phillips™ 56AVP, spectral response 300–600 nm) records light emission with ns time resolution. Fast time-resolved images of emitted light are obtained with a gated image intensifier (Hamamatsu™ C9546-03, spectral response from 150 to 800 nm). Alternatively, streak images were obtained with a camera built with a Hamamatsu™ 2803 intensifier tube.
In oscilloscope recordings presented, all delays introduced by the experimental system (PM delay, cables, fiber optic) were carefully compensated, in such a way to obtaining properly synchronized measurements of voltage, current, light, intensifier gate opening, with a maximum timing error about 1 ns. Due to the optical fiber link system and PM, currents and light intensity appear as negative signals on oscilloscope recordings.
3. Pre-breakdown phenomena
3.1. Leaders in HFO and SF6
Pre-breakdown phenomena in SF6 were already widely studied: 'stepped leaders' propagate, composed by conductive and bright channels [10]. Figure 2 shows typical image, light intensity and transient current of a leader in SF6, recorded slightly below the breakdown voltage. Propagation stopped while voltage was applied (the leader did not reach the plane electrode), and no breakdown (i.e. electric arc) occurred. This is due to the divergent electric field used here, with a large amplification factor β = 90. Leaders can be initiated at low applied voltage since a large electric field exists close to the point, but this voltage is not high enough to allow leader propagation up to the opposite electrode. At higher voltage, breakdown occurred immediately when leaders reached the plane electrode. Leaders touching the plane without inducing breakdown were never seen.
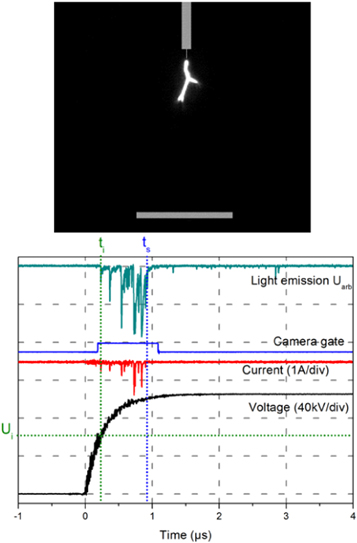
Figure 2. Stopped leader in SF6 (Ua = 105 kV, Rc = 0.2 mm, d = 50 mm, P = 0.1 MPa).
Download figure:
Standard image High-resolution imageDuring leader propagation, fast current pulses of increasing intensity, synchronized with light pulses, are recorded. They correspond to successive steps. In figure 2 the leader started at time ti during voltage rise, at an instantaneous voltage Ui (inception voltage) lower than the maximum applied voltage Ua . It propagated until stopping at time ts at the 'stopping length' ls . An average propagation velocity v = ls /(ts – ti ) can be calculated. When breakdown at higher voltage occurred at time tb , the velocity can be estimated as v = d/(tb – ti ).
In HFO (figure 3), pre-breakdown phenomena look nearly identical as in SF6, with only one bright channel propagating, and numerous synchronized light and current pulses.
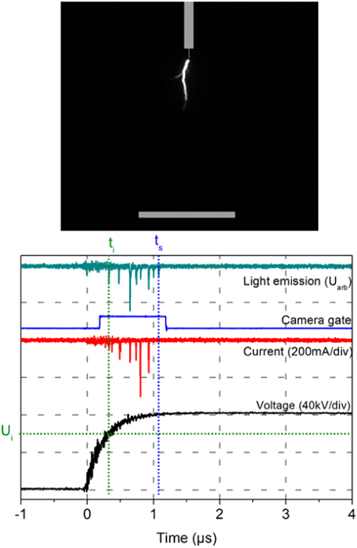
Figure 3. Stopped leader in HFO (Ua = 85 kV, Rc = 0.2 mm, d = 50 mm, P = 0.1 MPa).
Download figure:
Standard image High-resolution image3.2. Streamers in air, HFO and SF6
In air at atmospheric pressure (figure 4), the first propagating channels observed are composed of streamers, previously reported since a long time in a number of papers [9]. Streamers are made up of numerous ramified channels, much less luminous than leaders. Streamer transient currents also show marked differences with leader currents. At low voltage, a single fast current and light pulse is first recorded, while the streamer propagates up to the opposite electrode (figure 4). Contrary to leaders in SF6 and HFO, breakdown does not follows when the streamer in air reach the plane. After the initial streamer, several subsequent current and light pulses are seen, corresponding to 'secondary' streamers. In conditions of figure 4, it is necessary to raise the voltage up to Ua ≈ 58 kV in order to induce breakdown from secondary streamers. When pressure of air is raised above 0.1 MPa up to 0.3 MPa, all events described above remain qualitatively unchanged.
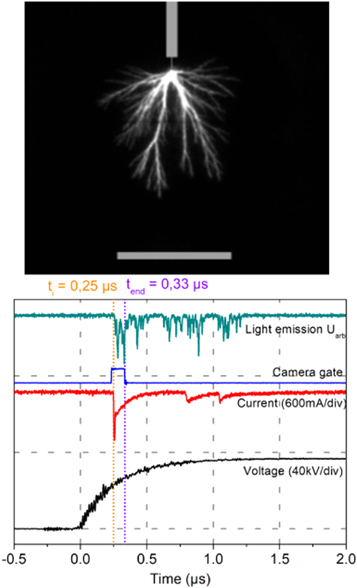
Figure 4. Streamer in air at atmospheric pressure (Rc = 0.2 mm, d = 50 mm, P = 0.1 MPa, Ua = 47 kV).
Download figure:
Standard image High-resolution imageFrom current measurements and fast images (figure 4), the propagation velocity of streamers can be measured. The onset of streamer propagation at ti
corresponds to the very steep current increase (first current pulse). When the camera gate is closed at tend
before the streamer reaches the plane, the corresponding streamer length l on the image allows calculating the velocity: 
When the pressure is decreased down to 0.01 MPa in SF6 and HFO, a change of pre-breakdown mode occurs, from the leader pre-discharge to the streamer.
Figures 5 and 6 show streamer phenomena in HFO and SF6 at 0.01 MPa. The structure of current and light pulses becomes similar to streamers in air, with a single fast initial current pulse correlated to the propagation of branched, and weakly luminous channels. As in air, no breakdown occurs when streamers reach the plane electrode. It is difficult to know precisely at which pressure the streamer-leader transition occurs: within some pressure range (0.02—0.05 MPa in SF6, 0.02-0.03 in HFO), streamers and leaders randomly appear. Streamers are not any more seen above 0.05 MPa in SF6, and above 0.03 MPa in HFO.
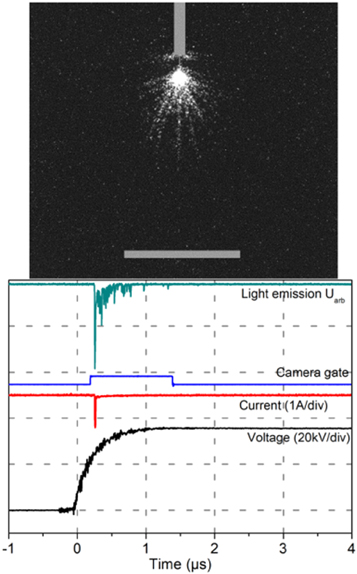
Figure 5. Streamer in SF6 (Ua = 37 kV, Rc = 0.2 mm, d = 50 mm, P = 0.01 MPa).
Download figure:
Standard image High-resolution image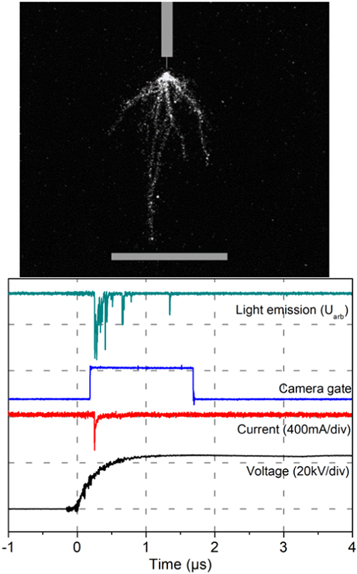
Figure 6. Streamer in HFO (Ua = 24 kV, Rc = 0.2 mm, d = 50 mm, P = 0.01 MPa).
Download figure:
Standard image High-resolution image3.3. Propagation velocities
From images, light emission and current measurements, it is possible to calculate the average propagation velocity v of streamers and leaders in different conditions of pressure and voltage (figures 7–9).
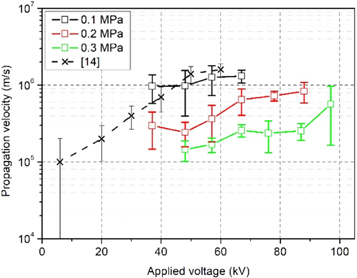
Figure 7. Velocity of positive streamers in air versus applied voltage and pressure (Rc = 0.2 mm, d = 50 mm, error bar: standard deviation), and comparison with [14].
Download figure:
Standard image High-resolution image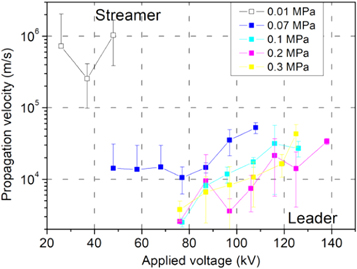
Figure 8. Propagation velocity in positive polarity in SF6 versus applied voltage and pressure (Rc = 0.2 mm, d = 50 mm, error bar: standard deviation).
Download figure:
Standard image High-resolution image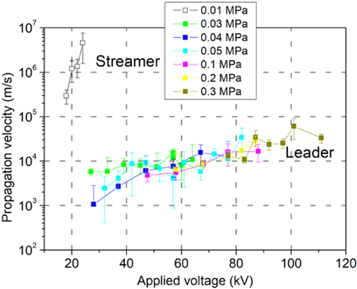
Figure 9. Propagation velocity in positive polarity in HFO versus applied voltage and pressure (Rc = 0.2 mm, d = 50 mm, error bar: standard deviation).
Download figure:
Standard image High-resolution imageFor streamers observed in air at 0.1 MPa, and HFO and SF6 at 0.01 MPa, v is about 106 m s−1, in agreement with previous measurements in air [12]. In air, the streamer propagation velocity increases with voltage, and decreases when pressure increases.
For SF6 and HFO, the propagation velocities of leaders observed at higher pressure and voltage is comparable, and much lower than for streamers, from 103 to 105 m s−1 [13]. In HFO, the leader velocity increases with voltage, and remains almost unchanged when pressure is increased by a factor of 10 (from 0.03 to 0.3 MPa). In SF6, measurements are more scattered, and some decrease of velocity can be observed when pressure is increased.
3.4. Leader stopping length in HFO and SF6
Images such as figures 2 and 3 allow to determine the leader stopping length ls versus voltage and pressure. In plots, quoted stopping length ls correspond to the distance between the point and the observed extremity of the luminous leader, irrespective of the leader channel shape. When the shape is tortuous, this distance ls may be slightly lower than the actual leader length. Measurements were made in HFO and SF6 at 0.1, 0.2 and 0.3 MPa. In such measurements, the inception of leaders occurs during the voltage rise as shown in figures 2, 3. Since leader velocity is not very high, the propagation stopped in most cases while the applied voltage reached the maximum value Ua . Therefore, the stopping length ls is plotted on figure 10 versus the applied voltage Ua . The length ls = 5 cm corresponds to cases where leaders reached the plane electrode and induced breakdown. With the highly non-uniform field used here, the measured breakdown voltage UBD therefore represents the voltage required to induce leader propagation up to the plane ('propagation-controlled' breakdown mode).
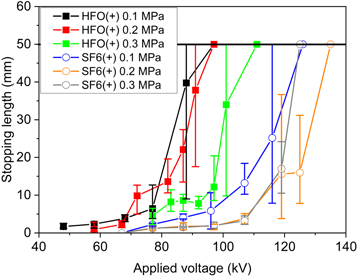
Figure 10. Stopping length of leaders versus applied voltage Ua in SF6 and HFO (Rc = 0.2 mm, d = 50 mm).
Download figure:
Standard image High-resolution imageAt low voltage, the leader stopping length ls increases gradually versus voltage. Above ls ≈ 2 cm, the scatter increases considerably, with many leaders propagating to breakdown. In HFO, the stopping length at fixed voltage decreases when pressure is increased. In turn, a moderate increase of breakdown voltage versus pressure is recorded.
In SF6 at atmospheric pressure, the plot is shifted by about 30 kV as compared to HFO. The rate of increase of stopping length ls versus voltage is also slower in SF6 at 0.1 MPa. In SF6, the minimum applied voltage Ua to observe leaders is ≈67 kV, and it is necessary to raise the voltage by about ΔUa = 50kV to observe the first breakdown (at 117 kV). In HFO at 0.1 MPa, the minimum voltage is lower (48 kV), and the first breakdown are recorded when voltage is raised by ΔUa = 40 kV. This shows that the lower breakdown voltage recorded in HFO is due to two main factors:
- A lower leader inception voltage;
- A greater ability of leaders to propagate and reach the plane.
4. Stepped leader propagation
Streak images allow obtaining a more precise description of leader propagation. In the figures presented below, the size and positions of both streak images and oscilloscope recordings were precisely adjusted in order to obtain synchronized horizontal time scales. The correlation between current and light pulses with leader steps on streak images is indicated by broken lines.
In SF6 (figure 11), we observed the same features of leaders already described in previous studies [10]. The leader propagates in steps: each step is correlated to a bright 're-illumination' of the leader channel, and to a fast current pulse recorded in the external circuit. The first current pulse is associated with the development of a weakly luminous and comparatively cold corona discharge, restricted to the area around the point. Then, the second current and light pulse corresponds to the development of the first leader step, followed by successive re-illuminations which bear a one-to-one correspondence with current pulses. This process continues until the leader either crosses the gap and induce breakdown (figures 11–13), or stops in the mid-gap (figure 14). In figures 11–13, the streak camera shutter was closed after a pre-selected time before the leader reaches the plane, in order to avoid image saturation by the very luminous electric arc. The spatial development of leader steps, although generally in the direction of the field, is often tortuous, resulting in an irregular spark path when breakdown takes place. As a result of the scattered time to breakdown and erratic leader shape, many streak images were rather difficult to interpret. Images presented here result from a selection of the most understandable streak recordings, obtained when the leader path is roughly linear.
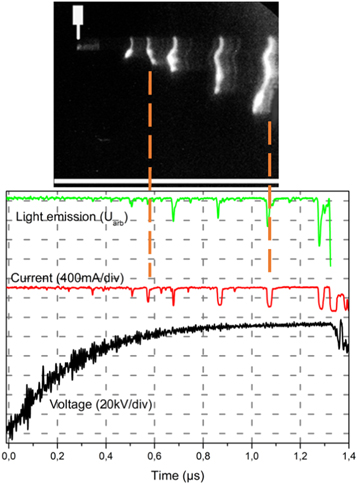
Figure 11. SF6 leader streak image, with current, voltage and light emission measurement (P = 0.1 MPa, Rc = 0.2 mm, d = 50 mm, Ua = 112 kV).
Download figure:
Standard image High-resolution image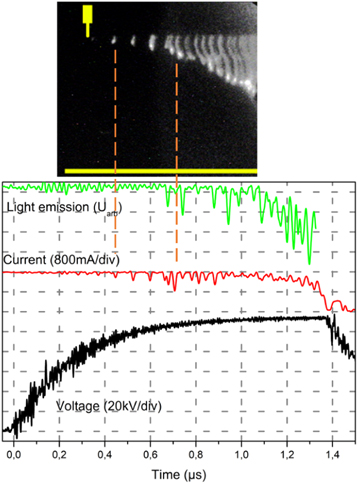
Figure 12. SF6 leader streak image, with current, voltage and light emission measurement (P = 0.3 MPa, Rc = 0.2 mm, d = 50 mm, Ua = 112 kV).
Download figure:
Standard image High-resolution image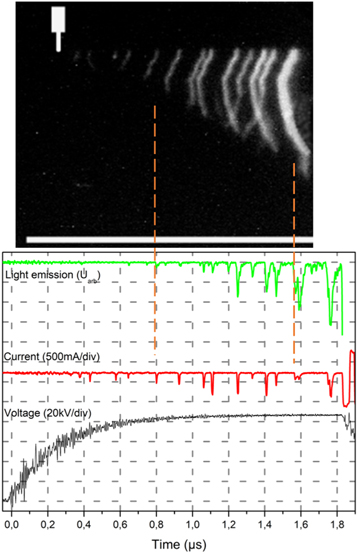
Figure 13. HFO leader streak image with current, voltage and light emission measurement (P = 0.1 MPa, Rc = 0.2 mm, d = 50 mm, Ua = 88 kV).
Download figure:
Standard image High-resolution image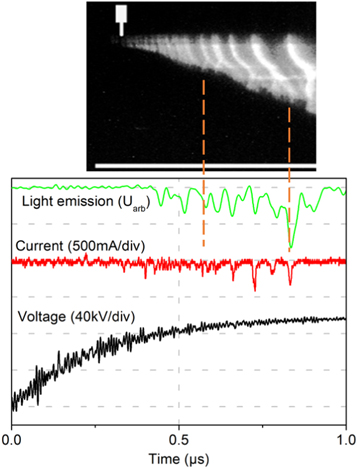
Figure 14. HFO leader streak image with current, voltage and light emission measurement (P = 0.3 MPa, Rc = 0.2 mm, d = 50 mm, Ua = 101 kV).
Download figure:
Standard image High-resolution imageAs pressure is increased, the leader steps become smaller, and the time interval between steps becomes shorter, making phenomena more and more difficult to resolve in space and time. At 3 bar in SF6 (figure 12), the first corona is fairly small and almost unobservable, and the subsequent leader steps are quite short. The synchronization of light and current pulses is not clearly seen, mainly due to the noise present on recordings.
Similar observations were made in HFO, further evidencing that the leader process in this gas can be fairly well compared to that occurring in SF6.
The average time between steps was calculated from the number of re-illuminations observed on streak recordings, and the corresponding duration. The increase in pressure increases the number of steps and therefore decreases the time between re-illuminations (figure 15). Niemeyer et al [15] have shown that the time between re-illuminations varies according to 1/(Ua xP) (figure 15), and also that the inception time varies as 1/P2. This delay could not be measured due to the high speed of phenomena. A similar variation for step time was already reported in SF6 in [15, 16], and the comparison with our results in HFO shows a similar trend.
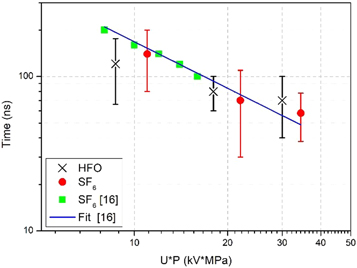
Figure 15. Leader propagation step time versus gas pressure in point-to-plane gaps in SF6 and HFO (Rc = 0.2 mm, d = 50 mm). Fit according to A/(U*P) [16] with A = 1680.
Download figure:
Standard image High-resolution image5. Breakdown voltage measurements
Breakdown voltages UBD were measured using the 'up and down' statistical method [5]. The applied voltage Ua was raised by 2 kV steps until recording the first breakdown. Then, the subsequent UBD value was measured, starting from a voltage 10 kV lower than the previous UBD . This process was repeated until reaching 15 breakdowns without changing the gas. Previous measurements in HFO with point-plane gap (i.e. in 'propagation-controlled' breakdown mode) showed that no evolution of UBD occurred during such sequence, although some evidence of HFO degradation (production of black soot) existed. This shows that HFO degradation by discharges does not modify leader propagation. A different conclusion was obtained under uniform field (i.e. with 'inception-controlled' breakdown mode): the presence of soot on electrodes facilitates leader inception under uniform field, and reduces UBD [6, 7].
The results of breakdown voltage measurements carried out with point-plane gap in HFO, SF6 and air are presented on figure 16. Depending on the gas nature and pressure, breakdown in divergent field involves different underlying physical mechanisms.
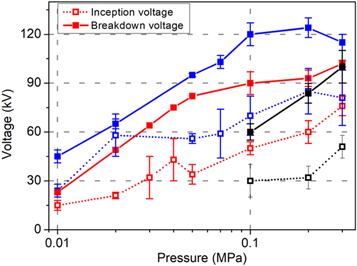
Figure 16. Breakdown voltage and inception voltage versus pressure in HFO (red), SF6 (blue) and air (black) in positive polarity.
Download figure:
Standard image High-resolution image
In air, streamers propagating to the plane are seen at voltage much lower than breakdown voltage UBD . Above 0.2 MPa, the breakdown voltage UBD is twice higher than the streamer inception voltage Ui . UBD neither represents the streamer inception voltage, nor the conditions required for its propagation to the plane. Instead, UBD represents the voltage required for the transition from a single streamer to a breakdown arc, involving secondary discharges following the initial streamer. Figure 16 shows that this transition is strongly affected by pressure: UBD is nearly doubled between 0.1 and 0.3 MPa.
In SF6, the breakdown plot shows two main parts: at low pressure (<0.5 MPa) breakdown is due to streamers, and UBD increases rapidly with pressure as in air. At pressures >0.5 MPa, breakdown is controlled by leader propagation. UBD then represents the voltage required for total leader propagation to the plane, that does not much depends on pressure (figure 10).
A similar variation of UBD is recorded in HFO. The pressure has a large impact on UBD at pressures <0.4 MPa, and much lower at higher pressures.
Regarding the values of the inception voltages in HFO and SF6, also plotted in figure 16, the same trend is observed in these gases, namely an increase in the inception voltage when the pressure increases. Over the whole pressure range, values of the inception voltages Ui in SF6 are higher compared to HFO.
6. Conclusions
Measurements of breakdown voltages in HFO1234ze(E), and study of pre-breakdown phenomena in point-plane electrode system versus pressure under impulse voltage provide data allowing to better characterize their properties under non-uniform field.
The behaviour of HFO is very close to that of SF6, with stepped leaders propagating at pressures of practical interest (above 0.1 MPa), and comparable variations of propagation velocities.
Several measurements allows explaining why recorded breakdown voltages are slightly lower in HFO compared to SF6 in identical conditions:
- A higher ability to form leader discharges (leaders are observed above 0.3 MPa compared to 0.5MPa in SF6);
- Slightly lower leader inception voltages in HFO;
- A larger ability of leaders to propagate in HFO, evidenced by a longer propagation length at fixed voltage compared to SF6.
Acknowledgments
The Schneider Electric company is acknowledged for providing a grant for this study. Authors also wish to thank J L Palenzuela for setting up various systems used in this study.
Data availability statement
All data that support the findings of this study are included within the article (and any supplementary files).