
Abstract
The WEST tokamak is currently equipped with a set of horizontal bolometers to estimate the radiation level of plasma scenarios. The exact relation between bolometer signal and radiating power is derived, highlighting the approximations required to express a proportionality between bolometer signal and radiation level. Further approximations are needed to correct for overlapping lines of sights. They are done via a truncated trapeze approximation. To test the robustness of all these approximations and uncertainties, a synthetic diagnostic basis is constructed coupled to a Monte Carlo ray-tracing tool, and applied to a large set of emissivity phantoms representative of WEST plasma geometries and radiation distributions. It results that the approximations are valid, with uncertainty levels bounded by 5% to 10% depending on the plasma geometry. Application to WEST plasmas shows that the radiated power fraction (related to total power) is about 50% in the first experimental campaigns. A finite radiation level originates from the divertor together with finite radiations from the core. It suggests a detrimental mixture of light impurities and tungsten in the plasma, possibly caused by poor chamber conditioning.
Export citation and abstract BibTeX RIS

Original content from this work may be used under the terms of the Creative Commons Attribution 4.0 licence. Any further distribution of this work must maintain attribution to the author(s) and the title of the work, journal citation and DOI.
1. Introduction
The radiated power is one of the most important parameters of a tokamak plasma. Radiations emitted at the plasma center by heavy impurities is highly detrimental to confinement performances and discharge stability. The amount of radiation within the magnetic separatrix is also critical for confinement, since the onset of edge transport barriers characteristics of high confinement modes is found to be related to the level of kinetic power crossing the separatrix, i.e. the total input power absorbed inside the separatrix minus the power radiated inside the separatrix. This kinetic power crossing the separatrix will eventually reach the divertor area, moderated by divertor radiations. To limit this particle heat flux at a tolerable level, divertor radiation need to be controlled by light impurity injection and therefore to be measured in current experiments.
In fusion machines, different types of bolometers are in use to evaluate the radiated power in the discharge. The two main ones are the IR bolometers [1–7] and the metallic resistive bolometers. The first one uses a foil exposed to the plasma heated by the radiation coming from it. An infrared camera placed at the back of the foil takes images of the foil. The images must be processed to de-convolute them from diffusion of the heat in the plane of the foil. This technique has some advantages (simplicity, possibility to monitor the full plasma, robustness of the foil relative to the heating) but also some disadvantages (response time very slow not allowing the measurement of fast events, difficulty to calibrate absolutely the diagnostic and give a reliable value of the radiated power [8, 9]). The other technique is the one that is preferentially used in today's tokamaks. It is the resistive metallic bolometer [10–14]. It is composed of an absorber (gold or platinum foil) placed on a ceramics. At the back of the ceramics, lies a Wheatstone bridge. The heat absorbed by the foil in front of the plasma is transmitted to a branch resistor of the Wheatstone bridge through the ceramics creating an imbalance of the bridge. This imbalance can be simply related to the radiated power absorbed by the foil exposed to the plasma. An individual bolometer is exposed to a small solid angle of the plasma by the use of a collimator and a slit or pinhole. In order to cover the whole plasma section, it is necessary to use several of them. One of the advantages of this system is that an absolute and accurate calibration of the bolometers can be done. This allows recovering a good value of the radiated power if the geometry of the lines of sight (LOS) is taken into account correctly. This is precisely where the difficulty lies as the geometry of the LOS of these bolometers sometimes complicates the evaluation of the radiated power. We deal with this problem in the WEST tokamak, which is equipped with this type of bolometers, and present a method to evaluate the radiated power with a set of bolometers by taking into account the fan shape distribution of the LOS. We start the paper with a brief description of the WEST tokamak. In section 2, we describe the bolometry system currently in operation in WEST. In section 3, we give some information about the Radon transform that is sometimes used to estimate the radiated power level from bolometry, but shows limitations in the toroidal geometry of tokamaks. In section 4, the relation between radiation level and bolometer signal is derived, and the inevitable approximations discussed. Section 5 discusses the application of this model to the case of overlapping bolometer lines of sights of WEST. Section 6 presents the construction of a synthetic diagnostic basis for the bolometry system of WEST, and section 7 discusses the uncertainty quantification related to the estimation of radiated power from bolometry signals, based on a large set of synthetic cases. Section 8 presents experimental evidence on the values obtained for the radiated power in a database of WEST discharges.
2. The WEST tokamak
WEST is a superconducting and actively cooled tokamak with all plasma facing components presenting tungsten layers. Its program aims at testing divertor plasma facing component technologies foreseen in future reactors like ITER, and demonstrate high performance integrated long pulse scenarios in metallic environment. Global properties of WEST are [15] R = 2.5 m, a = 0.5 m, Bt = 3.7 T, plasma current up to 1MA and up to 15 MW of heating power consisting in 9 MW of Ion Cyclotron Resonance Heating (ICRH) and 7 MW of Lower Hybrid Current Drive (LHCD). For its first operating phase, the WEST plasma facing components are entirely covered with tungsten layers: the main lower divertor is composed of a mixture of actively cooled ITER grade monoblocs and uncooled tungsten coated graphite tiles. The upper divertor is composed of actively cooled copper elements coated with tungsten, and all inner and outer limiters and made of graphite tiles coated with tungsten. Actively cooled Inconel protection plates protect the remaining portion of the vacuum chamber not directly exposed to plasma bombardment. This metallic tokamak environment aims at mimicking reactor conditions, and the first experimental phase showed operational difficulty related to core radiation from tungsten, but also edge radiation from light impurity. Long pulses of more than 50s where nevertheless achieved on the upper divertor, providing important data to close the power balance on different wall elements combining cooling water calorimetry, bolometry and other power exhaust diagnostics.
3. The bolometer diagnostic in WEST
The sixteen LOS of the bolometry installed in WEST in two horizontal ports are plotted in figure 1. All the bolometers are located at the same toroidal location, and all lines of sights cover the same poloidal plane. The two cameras of eight LOS each are placed symmetrically above and below the mid-plane axis far outside the vacuum plasma chamber, and are passively cooled by mechanical contact with the external structure of the tokamak. Each camera consists in a rectangular slit aperture of dimension 9 × 3.4 mm (toroidal-vertical), positioned at the vertical position  m & major radius
  m. Ten centimeters behind the slit, 8 bolometers of dimension 3.8 × 1.3 mm are positioned vertically every 5 mm to produce the LOS shown in figure 1. Rather than simple lines of sight, the detector geometry described above results in collection volumes that have the shape of cones in the poloidal cross-section. This geometry will be detailed in the following sections for linking the bolometer signals to the radiated power. Although the observation cones cover the entire poloidal cross section, eight of them are overlapping in the central part of the machine and we will have to consider this in the calculation of the radiated power. Three LOS each covers the bottom and top divertor. With this current arrangement of almost horizontal LOS, full tomography of the radiated volume emissivity distribution is not possible, especially if the poloidal distribution of radiation emissivity features in-out asymmetries [16]. We will show however that total radiation levels can be estimated with good precision.

Figure 1. The sixteen observation cones of the horizontal bolometry diagnostic in WEST.
Download figure:
Standard image High-resolution image4. The technique of the radon transform to calculate the radiated power
Common techniques used to evaluate the total radiated power from a set of bolometers signal refer to the Radon transform [17]. This method allows reconstruction of the total radiated power using parallel LOS traversing the plasma at any angle, as illustrated in figure 2. It makes use of an impact parameter for the different LOS that can be calculated relative to an arbitrary position within the plasma. Using it, the total radiated power is calculated using a discrete summation of the signals of the different LOS weighted by the difference of the neighboring impact parameters. The radon transform is in fact analogous to the relation given by equation (8), simply by generalizing the geometry to parallel lines of sight. The difference of impact parameter  is equivalent to the poloidal extent of the observation volume
  Because the lines of sights are parallel, the choice of the reference
  is in principle arbitrary.

Figure 2. Schematic geometry of parallel lines of sight as used for the radon transform.
Download figure:
Standard image High-resolution imageAlthough the Radon method gave good results, it has some drawbacks and its use requires some modifications for implementation in tokamaks. The difficulty comes from the fact that in tokamaks, the LOS of the bolometry are in general not parallel. They are very often distributed in fan shape as several bolometers share a common aperture within a camera. This is the case in WEST as was shown in figure 1. Consequently, the result of the summation of the weighted signals will depend on the choice of the reference point used to calculate the impact parameters. In general, the reference point is chosen as the barycenter of the radiation pattern which most of the time coincides with the center of the plasma discharge. It is also necessary to project the real LOS on a set of parallel axes before calculating the impact parameters. The situation becomes much more complicated when a second closed radiative chamber is located within the tokamak: the divertor region. In that case, the weights obtained with the impact parameters must be modified to take into account the divertor radiation. This is what is done in JET [18–21]. Eventually, computer simulations are needed to validate the modification of the weights. In the following, we propose to a take better account of the real geometry of the integration volume of the LOS.
5. Relating bolometer measurement to radiated power
To start with, the relation between bolometer measurement and radiated power is derived, highlighting some common approximations. These approximations will be checked against synthetic data. Let us consider an arbitrary toroidal chamber of volume  filled with a radiating plasma, toroidal symmetric. The local volume emissivity at position
  is noted
  in unit of [
 ]. The total radiated power in the toroidal chamber is simply:

We then divide the total chamber volume into a set of distinct and consecutive observation volumes as shown in figure 3. The set of observation volumes  is defined relative to a single observation circle
  extending toroidally, and each volume
  features a poloidal angle of observation
  and a poloidal opening
  The set of volumes is dense by construction, such that
  We define
  the total radiated power within the volume
  such that
  The radiated power within a given volume is:

Considering the geometry of each observation volume, each volume integral reduces to a linear summation along the line of sight 

where the coordinate  stands for the linear coordinate along the line of sight
  starting from the observation point. The term
  stands for the toroidal summation and
  for the summation across the poloidal opening.
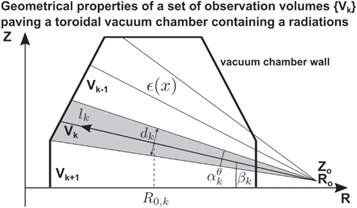
Figure 3. Schematic of the decomposition of the vacuum chamber into a set of observation volumes, featuring a single observation point at a finite distance from the chamber.
Download figure:
Standard image High-resolution imageSecondly, let us assume that the aperture of a bolometer stands at an arbitrary toroidal location along the observation circle  collecting radiation along the line of sight
  lying on a poloidal plane, with a poloidal opening identical to the volume
  We also introduce a toroidal opening
  for the radiation collection of the bolometer, and a collection surface
  of the bolometer aperture. The power in [W] received by the bolometer, noted
  is defined by an integral over the volume of collection of the bolometer. Assuming small poloidal and toroidal extents of this volume, the volume integral reduces to a linear summation along the line of sight

where both terms  and
and  stand respectively for the poloidal and toroidal summation, and
  accounts for the collecting solid angle of the aperture for radiation emitted at a distance
  from the aperture. The power received by the bolometer simply reduces to a linear integral of the local emissivity, weighted by a scalar term referred to as the LOS etendue

with  in units of
 ![$\left[{m}^{2}.sr\right].$](https://content.cld.iop.org/journals/2399-6528/5/9/095008/revision2/jpcoac2370ieqn37.gif)
Now, comparing equation (3) of  the power radiated in the observation volume
  and equation (5) of
  the power collected by the bolometer associated to this volume, it appears that the linear integrals of the local emissivity differ by different weight functions:
  and
and  It results that the power collected by a bolometer is not strictly proportional to the power radiated within the observation volume. Nevertheless, some approximations can be made to derive a proportionality relation between the two.
To do this, we define a reference major radius position  for instance at the middle of the LOS within the vacuum chamber (see figure 3). The major radius along the line of sight is then expressed as
  with
with  the major radius increment relative to the reference position. Therefore,
  is bounded in absolute value by the minor radius of the vacuum chamber,
  or less if the LOS is not horizontal. The linear coordinate
  along the line of sight
  is related to the major radius by
  Equation (3) can be rewritten as an exact expression of the radiated power, but with a normalized weight function in the linear integral:

In common bolometer configurations, we will see that the normalized weight function 
 can be weakly sensitive to the position
  inside the vacuum chamber. For the horizontal bolometers of the WEST tokamak (
 m,
m,  m and
m and  m) the weight function is found to vary from about 0.85 at the low field side wall up to 1.04 at a position between the high field side wall and the reference center, as shown in figure 4. Across the region where the radiation usually takes place (R < 3m or r < 0.5m), the normalized weight function can be approximated to
  with less than 10% error. For comparison, the case of horizontal bolometers in JET (JET
  m,
m,  m and
m and  m) is also reported in figure 4. The error related to
  is slightly larger (less than 20%) toward the outer wall, principally because bolometers are relatively closer to the vacuum chamber than in WEST. It has to be noted that the sensitivity study of the weight function can be generalized to any geometry of the LOS, from horizontal to vertical bolometers.

Figure 4. Normalized weight function for an horizontal bolometer at midplane, function of the distance to the reference location, here defined as the center of the vacuum chamber. Cases for WEST (thick curve) and JET (dashed curve) are illustrated.
Download figure:
Standard image High-resolution imageIf we now apply the approximation  the radiated power within the observation volume
  can be written as proportional to the bolometer signal

where  stands for the approximation of the radiated power within the observation volume {k} estimated from bolometer. Related to the previous discussion on the weight function, this relation comes with an error (less than 10% for WEST) depending on the precise geometry of the system, which is detailed in the following sections.
We made the hypothesis at the beginning of this section that the bolometer volume of integration had the same poloidal extend than the observation volume. To generalize the model to more realistic situations, we can rather suppose that the poloidal extend of a bolometer view is less than the associated observation volume. We can suppose that the emissivity distribution observed by the bolometer is representative of the emissivity distribution within the observation volume. It turns out that equation (7) is then still valid, because the poloidal extent of the bolometer view is embedded in the etendue term  that normalizes the bolometer signal. For the following we introduce the bolometer radiance
  in units of
 ![$\left[W.{m}^{-2}.s{r}^{-1}\right].$](https://content.cld.iop.org/journals/2399-6528/5/9/095008/revision2/jpcoac2370ieqn68.gif) To further simply the expression of equation (7), we also introduce a length parameter
To further simply the expression of equation (7), we also introduce a length parameter  defining the poloidal extent of the observation volume at the reference middle position of the LOS, as illustrated in figure 4:
  so that the radiated power within the observation volume simply relates to the radiance measured by the associated bolometer as:

As discussed previously, this estimate of radiated power comes with an uncertainty related to the approximation of the weight function, specific to each LOS. For the horizontal bolometer system of WEST, we showed that this uncertainty is less than 10% for local contributions, and probably less for integrated contributions, which is detailed in the following. It is important to note that the choice of  is a-priori arbitrary: we considered the geometrical center of the portion of the LOS within the vacuum chamber, as a generic proxy for the center of the emissivity distribution. A refinement could lead to consider for
  the barycenter of the emissivity along the LOS, although a-priori unknown. Doing so is equivalent to modify the parameters of the weight function
  so that the error between
  (radiated power estimated from bolometer) and
  (true radiated power) is in fact described by the spatial variation of
  as pictured in figure 4: an uncertainty bounded by 10% is expected for WEST. Application of this model to the interpretation of bolometer data is described in the following sections. The sensitivity of the model with the geometrical approximations of is also addressed.
6. The trapeze method to calculate the radiated power
The set of observation volumes associated to a single bolometer camera (composed of a set of bolometers), as shown in figure 5, can also be conveniently visualized as a set of adjacent trapezes mapping the poloidal section. For each trapeze, the small parallel sides are in principle defined at the intersection of the line of sight with the contour of the vacuum chamber. That said, in conventional diverted geometries a volume with negligible radiated power will take place between the inner wall and the inner separatrix of WEST. It leads to the definition of a reduced trapeze representation as shown in figure 5 right. Note that this reduced trapeze representation is the one used for analyzing WEST bolometry data. Geometrical properties of each trapeze are in fact represented by the length parameters of equation (8) :  is the geometrical center of the trapeze and
  is the width of the trapeze at this center, or equivalently the average of the length of the two parallel sides of the trapeze. In the case where the setup of the set of cameras is such that all collection trapezes are adjacent and not overlapping, the total radiated power will simply be given by the direct summation of the radiated power estimated in each trapeze as given by equation (8):

In the case of WEST, this is unfortunately not the case, as clarified in figure 5: the view of the two horizontal cameras overlap around the outer midplane of the chamber. If one would simply add the power measured by the two cameras, the result would overestimate the experimental radiated power.

Figure 5. Trapeze representation of WEST horizontal bolometry. Each line of sight has a poloidal cross section represented by a trapeze. Left: full trapezes extending up to the inner wall. Right: reduced trapezes extending up to inner SOL. The two cameras overlap. For the camera #2, some trapezes are split into two sub-trapezes: one overlapping with the camera #1 and one covering an area of interest.
Download figure:
Standard image High-resolution imageTo tackle this issue, we consider a master camera, for instance the camera looking at the lower part of the vacuum chamber. For the second camera looking at the upper part of the vacuum chamber, the trapezes overlapping with the views of the camera 1 are split into two sub-trapezes: one defined as the overlapping trapeze, and one defined as the region of interest, as shown in figure 5. For such a line of sight, the radiated power within the observation volume is split into two components, indexed as (1) for the trapeze of interest and (2) for the overlapped trapeze:  The expression of each component can be deduced from equations (4) & (6), but now splitting the linear integral into two contributions from each sub-trapeze. Since the contribution
  from the overlapped trapeze is already accounted by the power measured by the master camera, one only needs to express the estimated contribution
  from the trapeze of interest:

where  stands for the central position of the sub-trapeze of interest,
  is the width of the sub-trapeze at its center, and
  would represent the contribution to the bolometer radiance coming from this sub-trapeze. Since we do not know a-priori the spatial distribution of radiation emissivity over the two sub-trapezes, the most conservative approach to approximate this contribution is by geometrical considerations. The bolometer radiance is the linear integral of the emissivity along the line of sight, so that the contribution
  can be approximated as a fraction of the bolometer radiance
  with a weight proportional to the fraction of the line of sight passing through the region of interest:

where  is the total length of the trapeze
  and
and  the length of the sub-trapeze of interest. It results that the radiated power from the trapeze of interest can be related to the bolometer radiance:

The total radiated power can now be estimated as the summation over all trapezes of interests, defining the trapezes from the master camera as such:  In order to keep a convenient expression of the link between radiated power and bolometer radiance, the choice is made to keep the parameters of the main trapezes as appearing in equation (8). To do so, weight coefficients
  are added:

We can readily see that each weight coefficient is in fact the fraction of the trapeze volume within the region of interest, which is understandable.
All parameters appearing in equation (13) for estimating the total radiated power from bolometer power measurements are illustrated in figure 6. In particular, the weights are shown to vary significantly for four channels of the second camera, varying from about 0.2 to 1. Note that the full and reduced trapeze representations mainly differ by the geometrical coefficients  with differences in the range of 5 to 10%.

Figure 6. Parameters for WEST horizontal bolometry. Channels from 1 to 8 correspond to the camera looking at the bottom of the vacuum chamber, and channels from 9 to 16 looking at the top of the vacuum chamber. (a) Geometrical etendues of each bolometer, (b) integral coefficients relating radiated power to bolometer radiance for the full and reduced trapeze representations, (c) weights taking into account the partial overlap of lines of sights.
Download figure:
Standard image High-resolution image7. Construction of a synthetic bolometer diagnostic with SYNDI
In order to validate the approximations made for estimating the radiated power calculation, a synthetic bolometer diagnostic is built using a generic synthetic diagnostic tool for light collection, named SYNDI. Before going to the detail of the validation procedure, a brief description of the SYNDI tool is proposed.
SYNDI is a generic matlab tool devoted to the production of synthetic signals produced by simple radiation diagnostics. A schematic representation of the geometry as treated by SYNDI is shown in figure 7. These diagnostics can be composed of photon detectors like pixels or bolometers, each of these detectors being associated to a single diaphragm defining the aperture of the collector (here referring to a pair detector-diaphragm). Both detectors and diaphragms are modelled as planar surfaces, shaped as either rectangles or disks, with arbitrary sizes, positions and orientations. The geometrical etendue of each collector is calculated from its exact geometry. The complete bolometer diagnostic ( the two cameras) is implemented in SYNDI with all its channels. Secondly, a poloidal contour of the inside of the vacuum chamber is set as an input, assuming that the vacuum chamber is toroidally symmetric. It means that small details of the wall geometry are not considered in SYNDI, like tiles shape, bumpers, antennas, etc. This wall contour is used to define a closed volume where plasma radiation is allowed to take place. Thirdly, an arbitrary 3D distribution of radiation emissivity is considered. In general, we assume toroidal symmetry also for the radiated power, so that a 2D emissivity map can be used as input. To calculate the power received by the collector, we use a Monte Carlo ray tracing method. A set of light rays are generated at the detector and followed backward towards the vacuum chamber. Each ray starts at a random location on the detector, and is orientated towards a random location on the diaphragm. The ray is then extended towards the vacuum chamber. Along the path, a simple linear integral of the local emissivity is done, up to the location where the ray encounters the wall. There, random reflections can occur providing probabilities and properties for diffusive and specular reflections, and the process repeats up to complete absorption by the wall. The resulting linear integral of emissivity (eventually weighted by reflections) is added to the detector signal. When a sufficient number of rays have been processed, the calculation is stopped: the resulting signal summation is divided by the number of rays, and multiplied by the geometrical etendue of the collector. It produces a signal with a unit of [W] for a bolometer, or [Ph/s] for a photon detector, depending on the unit of the emissivity map. The main rational for using such a Monte Carlo ray tracing is to tackle precisely the effective opening of the collector view. It also offers an easy way to include reflections in the emissivity integral over the observation volume.

Figure 7. Schematic of the geometry considered in SYNDI: The diagnostic is described as a set of planar detectors, each associated to a planar diaphragm. Light strays are generated from a random point on the detector, and pass by a random point on the diaphragm.
Download figure:
Standard image High-resolution imageFinally, SYNDI can also be used to construct a projection basis [16] associated to a given pair diagnostic/emissivity mesh. The ray tracing method exposed above is meant to produce a set of synthetic signals associated to a given emissivity map, and will be reproduced for any new map. If the common set of emissivity maps to process are defined on the same input mesh, it is more convenient to define the projection basis of the diagnostic on this mesh. To produce it, the same Monte Carlo ray tracing algorithm is used. But instead of summing the linear integral of local emissivity, the algorithm defines, for each mesh point, the weight contribution to each collector. Let us define as  the projection basis associated to the mesh point
  and collector
  For an arbitrary emissivity map
  sampled on this mesh, the synthetic signal of the collector
 simply reads:

This projection basis offers an easy way to process synthetic signals from a large set of emissivity maps, without reprocessing the Monte Carlo algorithm. Additionally, it offers a convenient background to perform tomography inversion. Illustration of such a projection basis is given in figure 8 for the bolometer camera looking at the bottom of the WEST chamber. A similar basis is produced for the second camera, but absent from the figure because of overlap.
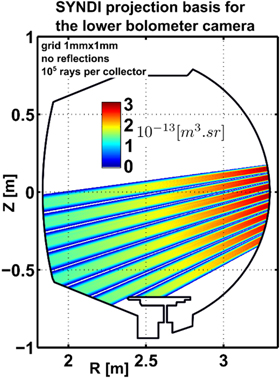
Figure 8. Projection basis for the lower bolometer camera of WEST, for a mesh of 1mmx1mm resolution. This basis is processed with 105 rays for each collector, without reflections.
Download figure:
Standard image High-resolution image8. Verification of radiated power estimate on phantoms
A set of synthetic signals are created with the projection basis described above on a large set of phantoms representative of possible experimental conditions. Each phantom is built as follow: a geometry is selected among the four geometries shown in figure 9. Then random shape and amplitude parameters are defined for the different areas of the phantom:
- a uniform amplitude for the bulk region,
- a scrape off layer exponential decay up to the wall
- a core peaking amplitude and width
- a mid-radius belt amplitude, position, width and horizontal asymmetry
- an X-point area amplitude and width
- a private flux region amplitude
- for each divertor leg: the scrape off layer decay length, an amplitude and poloidal extent

Figure 9. Geometries considered for the construction of emissivity phantoms, extracted from representative experimental magnetic equilibria in WEST: two lower single null geometries with far and close X-point, high field side limited geometries as produced for the current ramp up, and an upper single null geometry. Colors represent different plasma areas where emissivity is parametrized by shape and amplitude parameters.
Download figure:
Standard image High-resolution imageEach parameter is selected within a broad interval, with an additional constrain on the fraction of power radiated outside the separatrix: this fraction is chosen to be in the range of 30% (5% to 50%) as representative of WEST scenarios. Finally, each emissivity map is rescaled to produce a total radiated power of 1MW. The current database consists of a set of 600 phantoms randomly distributed over the set of magnetic geometries and parameters. For each phantom, synthetic signals are produced via the projection basis. They are then transposed into estimates of radiated powers within each single trapeze  which can be directly compared to the volume integral of radiation emissivity inside the geometrical volume of observation
  This comparison is shown in figure 10 for selected observations volumes and total radiated power. An error is defined as
  the difference between estimated power
  and true power
  normalized to the later. This error is found to be effectively bounded by 10% for power estimates in individual observation volumes as expected from the geometrical approximations discussed earlier. In particular, figure 10 illustrates that the errors associated to a divertor or core observation volume are in average in the range of a few percent with a deviation in the same range. Note also that both full trapeze and reduced trapeze representations give errors in the same order, noting that the reduced representation underestimates in average the true radiated power by about 5% whereas the full trapeze overestimates in average by 2%. This difference is solely explained by the fact that reduced trapezes consider smaller effective integration volumes (figure 6).

Figure 10. Probability distribution function of relative error between estimated radiated powers and true radiated powers calculated on the set of phantoms. (a) Error for the power radiated within a central observation volume (bolometer channel 8) for the full (blue) and reduced (red) trapeze representation. (b) Same for an observation volume passing by the lower divertor region (bolometer channel 3). (c) Error on the total radiated power from the reduced trapeze representation, for all and individual geometries. (d) Same for the full trapeze representation.
Download figure:
Standard image High-resolution imageConcerning the estimate of total radiated power, errors are similar. The reduced trapeze representation slightly underestimate true radiated power by a few percent, whereas the full trapeze representation overestimates it by a few percent. Note that the inner limited phantom geometry gives the largest errors for both representations coming from the fact that radiation distributions in that case are not centered in the chamber as for diverted geometries. For these inner-limited geometries, the reduced (full) trapeze representation underestimates the radiated power by about 15% (8%).
To summarize this section, the geometrical approximations made to estimate the radiate power from bolometer signals were checked on a large set of synthetic cases. The errors are indeed bounded by the conservative level of 10% expected from geometrical consideration, and it is rather found that the average error is in the range of 5% for diverted geometries and 10% for inner limited geometries.
9. Experimental results from estimated radiated power in WEST
An example of radiation measurement in a WEST discharge is shown in figure 11 for an L-mode lower single null plasma heated with 5MW of lower hybrid current drive. The bolometry data are analyzed using the reduced trapeze representation detailed above. During the stable discharge plateau (6.5 to 11s), the total radiated power is estimated around 3MW corresponding to 60% of radiating level. The vertical profile of bolometer power shows a relatively flat radiation profile in the core part suggesting the absence of strong radiation peaking caused by a tungsten accumulation. On the other hand, the bolometers looking at the lower divertor give a strong signal, indicating a finite contribution of divertor radiation to the total level.

Figure 11. Top: time traces of input power, line integrated density and total radiated power for the lower single null pulse 55107. Bottom left: magnetic equilibrium at t = 8 s with the bolometer basis. Bottom right: vertical profile of bolometer signal (power) from 7 to 9s (grey band shows the min-max amplitude and black squares the mean).
Download figure:
Standard image High-resolution imageA database of 140 discharges in lower single null configurations is now investigated. Except for a few ohmic discharges, the additional heating power (LH waves) varies from 0.3 MW up to 3.5 MW. In this database, the central density varies from 1019 to 4.0 1019 m−2 and the discharges remain in L mode confinement regimes. Figure 12 shows the variation of total radiated power function of total input power (LHCD and ohmic) on stable plasma phases of each discharge. The radiated power is observed to increase linearly with the total input power, independently of the density and plasma current values. Such a linear dependence was also observed in Tore Supra, the predecessor of WEST with a carbon limiter, as shown in figure 12 right, extracted from [22]. The two dependences are similar but differ mainly by the proportionality factor:  [MW] for WEST and
  [MW] for Tore Supra.

Figure 12. Total radiated power function of total input power for WEST lower single null diverted plasmas in metallic environment (left) and former Tore Supra circular plasmas in carbon environment (right) (extracted from [22]).
Download figure:
Standard image High-resolution image
The proportionality factor in WEST (0.49) is about twice that of Tore Supra (0.23). We also observe in WEST (figure 12 left) data points above the linear fit. These data points correspond to degraded discharge conditions with very high radiated fractions and bad additional power coupling. These discharges are not stable and end up most of the time by disruptions. In Tore Supra discharges, the plasmas were mainly polluted by light impurities with a large fraction of carbon. The level of total radiated power in Tore supra [22] was found to be in agreement with the Matthews scaling [23] which characterizes machines polluted by light radiating impurities. An analysis both experimental and with an analytical model from Ref. 24 showed that in Tore Supra the linear dependence of the radiated power with total power had to be attributed to the release of impurities by the limiter (source term) and was not an effect of the change of the transport [22].
In the case of WEST, the bottom divertor is in Carbon covered with a layer of Tungsten. The same type of layer also covers the protection of the antenna. The composition of the mixture of light impurities is under investigation but it is known that for the discharges conditions shown in figure 12, the background vacuum pressure was larger than in TS and polluted by oxygen and nitrogen. The estimates of Zeff in WEST were also found to be comparable to those in Tore Supra at least in the beginning of plasma operation. This suggest a finite level of light impurities in the WEST discharges, possibly explaining the finite level of radiation occurring in the divertor region (figure 11). The first interpretative simulations performed with SolEdge2D-EIRENE against WEST experimental conditions [25] indeed show that oxygen levels as high as 2% are needed to recover divertor bolometry levels. The presence of tungsten ions in the core plasma is observed by UV spectroscopy [26]. This causes a finite radiation level from the core region that was not present in Tore Supra discharges. The presence of light impurities in the divertor is also expected to increase the sputtering of the divertor tungsten surface, in turn increasing the core pollution by tungsten ions. The relatively strong radiation level of WEST, although partially caused by tungsten radiation, is in fact probably the result of a degraded conditioning state of the vacuum chamber.
10. Conclusion & discussion
We present in this paper the status of WEST horizontal bolometry, composed of 16 bolometers located at an outer equatorial port. They collect radiations over a fane-shape distribution of mostly horizontal lines of sight. A careful derivation of the relation between bolometer signal and radiated power is done, enlightening the geometrical approximation needed to derive a proportionality between the two. To verify and quantify error biases, a synthetic bolometer diagnostic is then constructed and is coupled to a Monte Carlo ray-tracing tool. The related projection basis is applied to a large set of 600 emissivity phantoms covering various plasma shapes produced in WEST. The synthetic diagnostic data are then used to calculate the radiated power following the above-mentioned approximations, and the results are found to lie within a few percent from the original radiation levels. For WEST diverted discharges, the uncertainty quantification associated to the estimation of radiated power from bolometer is found to be in the range of 5% maximum, whereas is in the range of 10% for inner limited plasmas configurations. Finally, WEST experimental observations are discussed. It is found that the total radiation level estimated with the horizontal bolometry diagnostic is in the range of about 50% of the total input power. A linear relation between radiated power and input power is observed over a large set of lower single null L-mode discharges, covering large intervals of plasma density and current levels. The proportionality factor is found to be about twice the one found in the former carbon wall machine Tore Supra. In the case of Tore Supra, most of the radiation could be attributed to light impurities (dominated by carbon). In the case of WEST, there are clear indications that the level of light impurities is still relatively large (strong bolometer signals from divertor area) and that tungsten radiates in the core region. The presence of light impurities is detrimental for tungsten sputtering, suggesting that wall conditioning should be improved to offer a better control of radiation levels.
In the present situation, the horizontal bolometry system does not allow to perform real tomography inversions. Nevertheless, a simplified and constrained tomography tool is under development in order to provide a rapid estimate of core versus divertor radiations, plus some information on the profile of radiation in the core. This will be the subject of a coming publication. Finally, a vertical bolometer is in preparation that will greatly complement the existing system for improving the analysis capabilities.
Data availability statement
The data that support the findings of this study are available upon reasonable request from the authors.