
Abstract
Most studies on electrowetting (EW) involve the use of AC electric fields, which cause droplets to oscillate in response to the sinusoidal waveform. Oscillation-driven mixing in droplets is the basis for multiple microfluidic applications. Presently, we study the voltage and AC frequency-dependent oscillations of electrowetted water droplets on a smooth, hydrophobic surface. We introduce a new approach towards analyzing droplet oscillations, which involves characterization of the oscillation amplitude of the contact angle (CA). An experimentally validated, fundamentals-based model to predict voltage and frequency-dependent CA oscillations is developed, which is analogous to the Lippmann's equation for predicting voltage-dependent CAs. It is seen that this approach can help estimate the threshold voltage more accurately, than from experimental measurements of CA change. Additionally, we use a coplanar electrode configuration with high voltage and ground electrodes arranged on the substrate. This configuration eliminates measurement artefacts in the classical EW configuration associated with a wire electrode protruding into the droplet. An interesting consequence of this configuration is that the system capacitance is reduced substantially, compared to the classical configuration. The coplanar electrode configuration shows a reduced rate of CA change with voltage, thereby increasing the voltage range over which the CA can be modulated.
Export citation and abstract BibTeX RIS
1. Introduction
Control and alteration of wettability is a powerful tool to influence a wide range of phenomena that involve fluid-solid interactions. Electrowetting (EW) is a powerful technique for dynamically controlling the wettability of droplets of water and organic solvents. EW results in the increase in wettability upon the application of an electrical potential difference across a dielectric layer underlying the droplet [1]. EW-induced modulation of the contact angle (CA) is described by the Young-Lippmann equation [2, 3] as:

where  is the equilibrium CA in the absence of an applied voltage,
  is the capacitance of the dielectric layer per unit area,
  is the liquid-vapor surface tension and
  is the applied voltage. Both DC and AC electric fields can be used for EW (under AC electric fields,
  is the root mean square voltage of the sinusoidal waveform). However, AC EW has several advantages over DC EW such as reduced CA hysteresis and delayed CA saturation [2–4]. All the experiments and analysis in this study involve AC EW.
The frequency of the sinusoidal waveform used for AC EW influences the wettability to a significant extent. This can be best understood by considering the expression for the complex permittivity of the liquid  [2], where
  is the electrical permittivity,
  is the electrical conductivity of the liquid, and ω is the frequency of the AC waveform. The first term represents the capacitance of the droplet, while the second term represents the resistance. As the frequency increases the second term reduces in significance, implying that the droplet behaves more like a dielectric material than a conductor. Effectively, the electric field lines penetrate the droplet, which can no longer be assumed equipotential. The reduced magnitude of the electric field correspondingly reduces electrowettability above the relaxation frequency (
 ) of the liquid [5].
AC and DC voltages also result in very different sessile droplet dynamics. Under AC fields, droplets oscillate in response to the sinusoidal waveform, which is determined by the interplay of inertia and interfacial energies [1]. The frequency of the oscillating force is twice the input electrical force [1, 5, 6]; therefore the droplet oscillates at twice the AC frequency. At low AC frequencies, oscillations induce hydrodynamic flow within a droplet resulting in mixing [5]. However, droplet oscillations decrease at higher frequencies [7, 8]. At very high frequencies fluid flow and mixing is induced by electrothermally driven flows due to gradients in temperature arising from Joule heating within the droplet, which results in gradients in conductivity and permittivity [9].
This study introduces a novel methodology for analyzing droplet oscillations under AC electric fields. There do exist previous studies [5, 10–12] which have analyzed the influence of AC electric fields on droplet oscillations. In most such studies, transient droplet oscillations were quantified by measuring the transient CA or contact radius [1, 13]. Additionally, many of these studies used the traditional EW configuration, which consists of a wire electrode (or plate) in contact the droplet resting on a dielectric surface. The electric field is established using an electrode under the dielectric and the top wire (which is usually electrically grounded). This traditional EW configuration is widely used for studies on various microfluidic operations such as pumping, merging and splitting [4, 14, 15]. One significant disadvantage of this configuration is that the wire/plate will influence the hydrodynamic response of the liquid to an electric field, and also distort the droplet shape.
Electrowetting experiments on droplets not having a physical electrode protruding into them are possible if the active and the ground electrodes are both located on the bottom plate; this configuration is known as the coplanar electrode arrangement [16]. While an overwhelming number of studies utilize the traditional EW configuration, there do exist studies which utilize the coplanar electrode arrangement. Since this study uses the coplanar electrode arrangement to study droplet oscillation dynamics under AC EW, key previous studies using this arrangement are briefly summarized ahead.
Malk et al [5] used coplanar electrode geometry to observe rotating flow within an oscillating droplet. Increasing the frequency reduced the amplitude of droplet oscillations and reduced the change in CA during oscillations. However, there was no reported relation or model to predict the amplitude of CA change as a function of the applied voltage and frequency. Another study [1] using the coplanar electrode geometry involved a ground electrode placed between two high voltage electrodes. Droplet dynamics under the influence of AC EW was quantified by measuring the transient CA and contact radius under various frequencies and voltages. Hong et al [8] used coplanar geometry in experiments to measure droplet oscillations and contact line dynamics. At low frequencies periodic oscillations in the droplet shape were observed; at high frequencies no shape change was recorded. Yamada [6] took a different approach and used a tangential electric field to oscillate droplets to understand the influence of resonance frequency on the change in droplet shape. It was seen that resonance vibration of the droplet occurred when the frequency of the AC field was half the natural frequency of the droplet. Furthermore, the resonance frequency was seen to depend on droplet volume, the surface energy and the electrostatic force profile [6].
In addition to the above four studies, other studies on droplet oscillations under AC EW have used the traditional EW configuration. Oh et al [10] studied the influence of AC frequency on oscillation behavior (changes in shape modes and resonance frequencies), and derived a shape mode equation for droplet oscillation under AC EW. Dash et al [13] measured the transient response of droplets under DC and AC fields and reported that the time taken by a droplet to attain a steady shape is approximately 35 ms (although there is a dependence on the applied voltage). By measuring and comparing the CA under AC and DC electric fields, Li et al [17] showed the benefits of AC EW in overcoming pinning forces at the contact line.
Presently, we study AC voltage and frequency dependent oscillations of an electrowetted water droplet on a macroscopically smooth hydrophobic surface. We introduce a new technique to analyze droplet oscillations, which involves characterization of the contact angle oscillation amplitude (CAOA), instead of tracking transient CAs. It is shown that this methodology can be used to develop an experimentally validated, fundamentals-based equation to predict voltage and frequency-dependent CAOA, which is analogous to the Lippmann's equation for predicting voltage-dependent CA. Importantly, we use a coplanar electrode configuration with high voltage and ground electrodes arranged in an interdigitated pattern on the substrate; this allows us to study oscillating droplets without any interference from the top electrode (in the traditional configuration). It is noted that this configuration substantially reduces the capacitance under the droplet compared to the traditional configuration; all such complexities are accounted for in our analysis. The presently developed model can be used as a predictive tool in several microfluidic systems that rely on droplet oscillations [18–20].
2. Procedure for experiments and analysis
Coplanar electrode-based EW devices were fabricated using photolithographic methods on a ITO (Indium Tin Oxide) coated glass slide [18]. A schematic of the arrangement of interdigitated electrodes is shown in figure 1(a). The electrode width and the spacing between the electrodes (electrode gap) were 50 μm, each. Electrodes were coated with a 2 μm layer of Parylene C (EW dielectric layer), via room temperature vapor deposition. The devices were then spin coated with a thin (∼100 nm) layer of Teflon AF to increase the initial CA of the droplet and reduce friction at the triple-phase contact line.
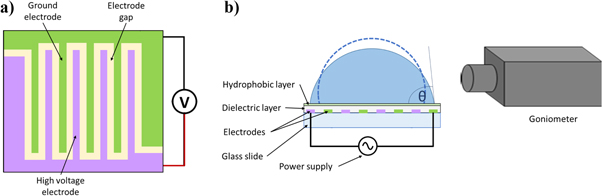
Figure 1. (a) Schematic showing the arrangement of interdigitated electrodes (high voltage in purple and ground in green). (b) Cross section of EW device.
Download figure:
Standard image High-resolution imageDroplet oscillation experiments were conducted by placing a 5 μl droplet of deionized water on the substrate. It is noted that a droplet of this volume covered between 17–20 sets of electrodes (set of electrodes includes two electrodes and two electrode gaps, i.e. a total of 200 μm). CA measurements were conducted via side view visualization at upto 210 FPS using a goniometer (Biolin Scientific Theta).
Experiments involved visualization of droplet oscillations under the influence of AC electric fields, with the electric field lines directed from the high voltage electrode to the ground electrode. CAs during oscillation were measured as a function of the applied voltage and frequency. For a specified AC frequency, the voltage was changed incrementally, with each voltage level held for 10 s during which the CA was recorded. The final reported CAs are an average of four experiments.
When studying the influence of AC frequency on EW, existing studies analyze the transient CA and transient contact radius to quantify droplet oscillation. Alternatively, in this study we quantify droplet oscillation dynamics under an AC electric field by measuring the contact angle oscillation amplitude (CAOA). The CAOA is defined as the difference between the cosine of the minimum ( ) and maximum (
 ) contact angle as the droplet oscillates under a specified voltage and frequency. Mathematically, CAOA is:

The minimum and maximum contact angle is obtained from the transient oscillatory cycle, as shown in figure 2(c). The minimum angle corresponds to maximum droplet spreading as seen in figure 2(a). The maximum angle corresponds to the droplets attempts to revert back to its no-voltage CA, as seen in figure 2(b). Droplets cycle between these two states, at a frequency twice of the applied AC frequency (noting that the EW force does not depend on polarity of the electrodes). The magnitude of the CAOA determines the extent of droplet oscillations and its response to the voltage and frequency of the applied AC waveform. It should be noted that the CAOA is a measure of droplet oscillations and is not directly related to CA hysteresis.
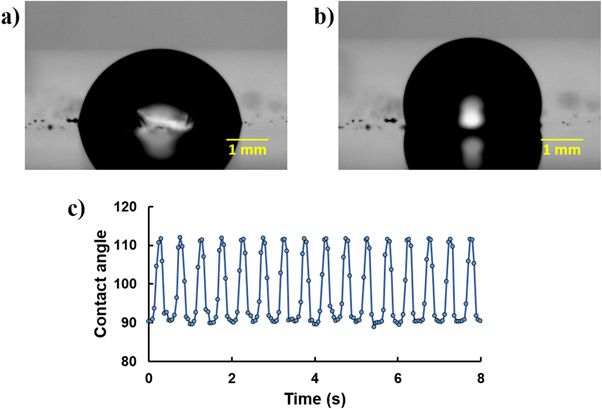
Figure 2. (a) Minimum, and (b) maximum contact angles of water droplets during oscillations under a 200 Vrms, 1 Hz applied AC waveform. (c) Shows the transient variation in contact angles.
Download figure:
Standard image High-resolution image3. Modeling droplet oscillation dynamics and results
This section details the physics-based model developed to predict the response of a droplet to AC electric fields. Firstly, it is noted that capacitance term in Lippmann's equation should be modified to account for the non-traditional electrode geometry. In the traditional EW configuration [2, 3, 7, 19], the electric field lines inside the dielectric layer are oriented normal to the plane of the layer, and the dielectric can be considered as a parallel plate capacitor. The capacitance in such cases is accurately estimated as  where
where  is the electrical permittivity of free space,
  is the dielectric constant and
  is the thickness of the dielectric layer [2, 3]. In the present configuration, the field lines follow curved paths from the high voltage electrode to the ground electrode, which are on the same plane; the electric field is thus markedly different from that in the traditional configuration.
The qualitative difference in the nature of the electric field lines implies that the capacitance will be very different for the two configurations. Presently, we use an analytical estimate of the capacitance [20–22] for our co-planar electrode geometry  which is:

where  is the electrode width,
  is half the electrode gap width,
  is the length of the electrodes and
  is the wetted area of the droplet. This capacitance model accounts for the relative width of electrodes in relation to the width of the electrode gap. Interestingly, for the same thickness of the dielectric layer, the capacitance of traditional configuration is significantly higher than that of the present co-planar configuration, with
  Additionally, based on the present geometry (50 μm electrode and gap width) the electric field line penetration height will be ∼70 μm above the surface [20].
The importance of using equation (3) to estimate the capacitance is highlighted in figure 3, which shows the match between the predictions and measurements of CAs in the traditional and coplanar electrode configuration (with the same thickness of the dielectric layer). Predictions of CA are based on the Lippmann's equation (equation (1)) with the capacitance in the traditional and coplanar electrode configurations estimated using the equation provided earlier. It is seen that the CA measurements match the predictions for the traditional configuration very well (as expected) till the onset of CA saturation (after which the CA does not decrease significantly with voltage). However, Lippmann's equation with the traditional estimate for the capacitance would drastically over predict the CA change, if used for the coplanar electrode configuration. Lippmann's equation with the capacitance defined by equation (3) shows a good match with the experimental results. It is noted that the measured CAs are the average of transient CA measurements taken for 10 s.
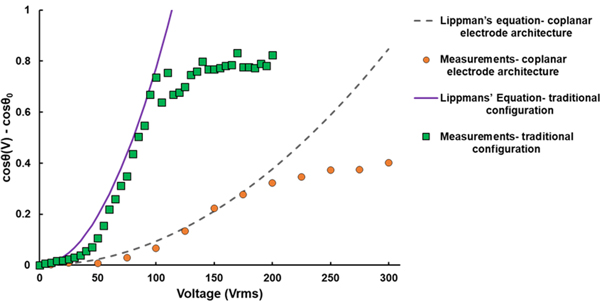
Figure 3. Measured and predicted change in contact angles versus voltage for the traditional and coplanar electrode architectures. Contact angle modulation with voltage differs significantly in the two configurations for the same dielectric layer thickness.
Download figure:
Standard image High-resolution imageFigure 3 can also be used to estimate the threshold and saturation electric fields for the two configurations. For the coplanar electrode configuration, the threshold field and saturation electric fields are 50 V μm−1, and 100 V μm−1, respectively. The saturation voltage is higher than that for the traditional configuration (45 V μm−1). The coplanar electrode configuration shows a reduced rate of CA change with voltage, thereby increasing the range of applied voltage over which the CA can be modulated. All of this is a consequence of the reduced capacitance in the coplanar electrode configuration. Similar results can be obtained in a traditional configuration with the use of thicker dielectric layers. Figure 3 shows that the coplanar electrode configuration can enable more precise control of the CA via voltage modulation, than the traditional configuration.
We now discuss the characterization of droplet oscillations in terms of CAOA, and highlight the benefits of analyzing the voltage and frequency-dependent CAOA. Physically, CAOA captures the change in CA as the droplet oscillates, which also conveys the magnitude of the change in the shape of the droplet (using the spherical cap approximation). At low frequencies the droplet shape is significantly distorted which results in a large change in the CAOA. At high frequencies, the CAOA reduces as a direct consequence of the reduced change in the shape of the droplet. Effectively, high AC frequencies serve to negate the influence of the electric field on shape change. Figure 4 shows that the CAOA is higher by 10X at a 1 Hz frequency as compared to a 1 kHz frequency. The influence of frequency on wettability and oscillations is thus captured strongly using the CAOA approach. Another advantage of the CAOA approach is its use in evaluating the threshold voltage, especially at low frequencies. The increase in CAOA defines the threshold voltage,  at which the droplet begins responding to the applied electric field (
 ). Figure 4 shows a threshold voltage of ∼90 V. CAOA measurements can thus be a useful tool to quantify the threshold voltage and complement the determination of threshold voltages by tracking the change in CA versus voltage.
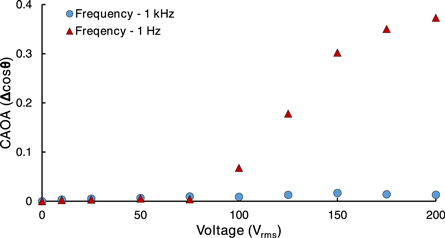
Figure 4. Voltage-dependent contact angle oscillation amplitude (CAOA) for two AC frequencies (1 kHz and 1 Hz). The strong influence of frequency is clearly observed with high frequencies cancelling out the influence of the applied electric field on the CAOA.
Download figure:
Standard image High-resolution imageWhile there have been many studies on AC EW, most of them are experimental in nature. There do exist studies, which have numerically modeled the shape of oscillating droplet at various frequencies or at resonance frequencies [16, 23–25]. However, there are no studies which model the combined influence of voltage and frequency on contact angle oscillations. Presently, we develop a fundamentals-based and experimentally validated model to predict CAOA as a function of both voltage and frequency. The model draws from Lippmann's equation in terms of the relationship between the applied voltage and CA change; additionally, a frequency-dependent term is included, as described ahead.
Firstly, the relationship between CAOA and voltage is considered to be analogous to that between the contact angle and voltage in Lippmann's equation. In a manner analogous to the Lippmann's equation, CAOA is assumed to take the form  where
where  is a function of the applied AC frequency. From previous studies and present experimental data, we know that increasing the frequency will reduce the CAOA. To identify
  we turn to experimental measurements of CAOA for voltages in the range of 0–250 V and frequencies ranging from 1–1000 Hz. Knowing that
 ![$\left[{\rm{\Delta }}\,\cos \,\theta \left(V\right)\right]=M\,* \,\left[\tfrac{C}{{\gamma }_{lv}}{V}^{2}\right],$](https://content.cld.iop.org/journals/2399-6528/4/6/065016/revision2/jpcoab9ea1ieqn27.gif) we use the gradient of the curve,
we use the gradient of the curve,  to identify the functional relationship between
  and
and  The experimental data strongly suggests an exponential relationship between
  and
and  resulting in an expression of the form
  Finally, the voltage and frequency-dependent CAOA can be expressed as:

where the angular frequency of the AC electric field is  and other terms have been previously defined. It is noted that the frequency in the exponential term is non-dimensionalized using the relaxation time. This model does involve two fitting parameters Z1 and Z2. These can be estimated as
 for water, based on fitting the model with experimental data for the given range of voltages and frequencies. In this analysis, the electrical conductivity and dielectric constant of water are
  and
and  respectively, and the permittivity of the dielectric layer is
  The droplet is electrically conducting for these properties and within the frequency range of the current experiment.
The above model shows good agreement with experimental data (figure 5) in the voltage range spanning from the threshold voltage  to the voltage corresponding to contact angle saturation. Below 100 V (threshold voltage) the model over predicts the CAOA; this should be expected since the model does not account for hysteresis-related effects which are important before the threshold voltage is reached. Above 200 V, the predictions diverge from experimental data; this is a direct consequence of entering the CA saturation regime. Between these two voltages, the model predicts the voltage and frequency dependent CAOA reasonably well. It is noted that this model will be accurate only for electrically conducting droplets.

Figure 5. Comparison of predicted contact angle oscillation amplitudes (CAOA) with measurements (for various voltages and AC frequencies). The solid lines denote predictions and the symbols denote measurements.
Download figure:
Standard image High-resolution imageAt high frequencies (ω → ∞), the frequency-dependent term in equation (4) becomes negligible, which leads to  (within error). This aligns with the theory that an electrically conducting droplet will behave like a dielectric at frequencies much higher than the relaxation frequency, which will eliminate electrowettability and the resulting oscillations. At very low frequencies (ω → 0) the model shows that the influence of frequency on CAOA will reduce as the rate of oscillations reduces. The droplet has sufficient time to respond to sinusoidal waveform, and will effectively behave as a droplet under the influence of DC EW. In general, while the CAOA increases with a reduction in frequency, the increase in CAOA plateaus at low frequencies when the response time of the droplet (on the order of milli seconds) is less than the AC frequency. This can be observed through a comparison of the difference in CAOA between 1 Hz and 10 Hz, and between 1 Hz and 100 Hz, as seen in figure 5.
It is noted that the model cannot be used with DC electric fields (ω = 0), since there are no oscillations in the CA and the model simplifies into a form similar to the Lippmann's equation (which only accounts for a voltage dependence). Also, the model tends to under-predict CAOA at resonance frequencies [10] (especially at node n = 2), where the largest shape oscillations are expected [10]. For the presently studied droplets the node n = 2 corresponds to a resonance frequency of ∼40 Hz, where the modeled CAOA is expected to be less than what would be observed.
While the model shows a reasonable match with experiments, it does involve two fitting parameters (Z1 and Z2). These are obtained by minimizing the error between the experimental data and the model, between threshold voltage and saturation voltage, i.e. between 100 V–200 V. CAOA predictions obtained from the fitting parameters show a good agreement with measurements for all combinations of voltage and frequency in this study. These fitting parameters should not be considered universal, and will need to be estimated for other fluids [26] with different surface tension and electrical properties. Conveniently, both these parameters can be obtained by fitting the model to a single set of experimental data, such as CAOA measurements for a range of voltages range at a particular frequency.
Finally, the sensitivity of the predictions of CAOA to four parameters is quantified and discussed. The parameters considered include the permittivity of the droplet (εD) and the dielectric layer (εd), the electrical conductivity of the droplet (σ) and surface tension (γLV). The % change in the CAOA as a function of the % change in the above parameters is shown in figures 6(a) and (b) for 1 Hz and 1 kHz frequencies, respectively. It is seen that the influence of surface tension and permittivity of the dielectric layer on CAOA is independent of frequency. An increase in surface tension will reduce droplet oscillations as higher surface tension forces will increase the resistance to changing the shape. Conversely, any increase in the permittivity of the dielectric layer will increase droplet oscillations, resulting from larger actuation forces.

Figure 6. Sensitivity analysis showing the influence of various parameters on contact angle oscillation amplitude (CAOA), (a) at 1 Hz and (b) at 1 kHz.
Download figure:
Standard image High-resolution image
At 1 Hz, the CAOA is seen to be most sensitive to the surface tension of the liquid. However, at 1 kHz, the CAOA is most sensitive to the permittivity and the electrical conductivity of the droplet. Both these parameters relate to the electrical properties of the fluid, and determine the charge relaxation time. Increasing the electrical conductivity of the fluid will reduce the relaxation time, thereby allowing oscillations at higher frequencies; this explains the positive slope in the CAOA versus electrical conductivity curve in figure 6(b). Analogously, reducing the permittivity of the fluid will reduce the relaxation time, resulting in larger oscillations (larger CAOA). Understanding the impact of individual parameters on contact angle oscillations is helpful in the design and operation of any microfluidic system that relies upon droplet oscillations.
4. Conclusions
Presently, a novel approach to study droplet oscillations (and shapes) under AC EW is developed which analyzes the oscillation amplitude in CAs instead of the transient variation in CAs. An experimentally validated analytical model is developed to predict the voltage and frequency-dependent CAOA for water droplets; the same approach can be applied for other liquids. Future studies can relate the CAOA to hydrodynamics and mixing patterns within droplets, being used as a microreactor for biology and chemistry applications. This would enable the identification of voltage and frequency regimes required to induce the desired extent of mixing through hydrodynamic or electrothermal flows.
Acknowledgments
The authors acknowledge National Science Foundation grants CBET- 1805179 and CBET-1605789 for supporting this work.