

Abstract
As the size of satellites scales down, low-power and compact propulsion systems such as the pulsed plasma thruster (PPT) are needed for stabilizing these miniature satellites in orbit. Most PPT systems are operated at 2 J or more of discharge energy. In this work, the performance of a PPT with a side-fed, tongue-flared electrode configuration operated within a lower discharge energy range of 0.5‒2.5 J has been investigated. Ablation and charring of the polytetrafluoroethylene propellant surface were analyzed through field-effect scanning electron microscopy imaging and energy-dispersive X-ray spectroscopy. When the discharge energy fell below 2 J, inconsistencies occurred in the specific impulse and the thrust efficiency due to the measurement of the low mass bit. At energy  2 J, the performance parameters are compared with other PPT systems of similar configuration and discussed in depth.
Export citation and abstract BibTeX RIS
1. Introduction
In 2018, two CubeSats, MarCO-A and B, were deployed by NASA to aid in the Mars landing mission, demonstrating that the CubeSat architecture is a viable technology for interplanetary missions [1]. The reduced cost of launching small satellites has made it affordable for many companies, research institutes and universities to develop them. For example, countries such as Singapore and China [2, 3] have developed several successful pulsed plasma thrusters (PPTs) that have been deployed in the CubeSats. The advantages of PPTs include low-power operation and their robust, simple and compact design [4]. In pulsed mode operation, the PPT is excellent for precise control of the attitude and position of a CubeSat. One of the main improvements in PPTs is the use of polytetrafluoroethylene (PTFE) as the solid propellant fuel, which allows scaling down of the PPT – albeit at the cost of decreased performance. Since 2011, the number of small satellite launches has increased at an approximate annual rate of 40% and the demand for these spacecrafts will continue to show strong growth [5]. A review by Molina-Cabrera et al in 2011 found that most PPTs were typically operated in the mid-energy range of tens of joules; very few were under 2.5 J or above 103 J [6]. As the size of satellites is scaled down, it is necessary to study the performance of PPTs at the lower energy range (2 J and below) and determine their consistency and reliability.
Significant research has been done on optimizing the performance of PPTs through altering various factors that influence their performance [7]. These factors are listed in figure 1, which are categorized by geometrical, electrical and propellant parameters. Also included in figure 1 are parameters that characterize the thruster's performance. For the geometrical factor, different electrode configurations for PPT have been tested, such as the traditional parallel plate electrode [8], the coaxial electrode [9], the tongue-flared electrode [10], a Z-pinch adaptation [11] and the segmented electrode [12]. In terms of thrust efficiency, Antropov et al [13] reported up to a 10% increase for a tongue-shaped electrode as compared to a rectangular electrode. By incorporating a flare angle of 20° for the tongue-shaped electrode, Schönherr et al [14] obtained an increase in impulse bit and thrust efficiency of 35%.
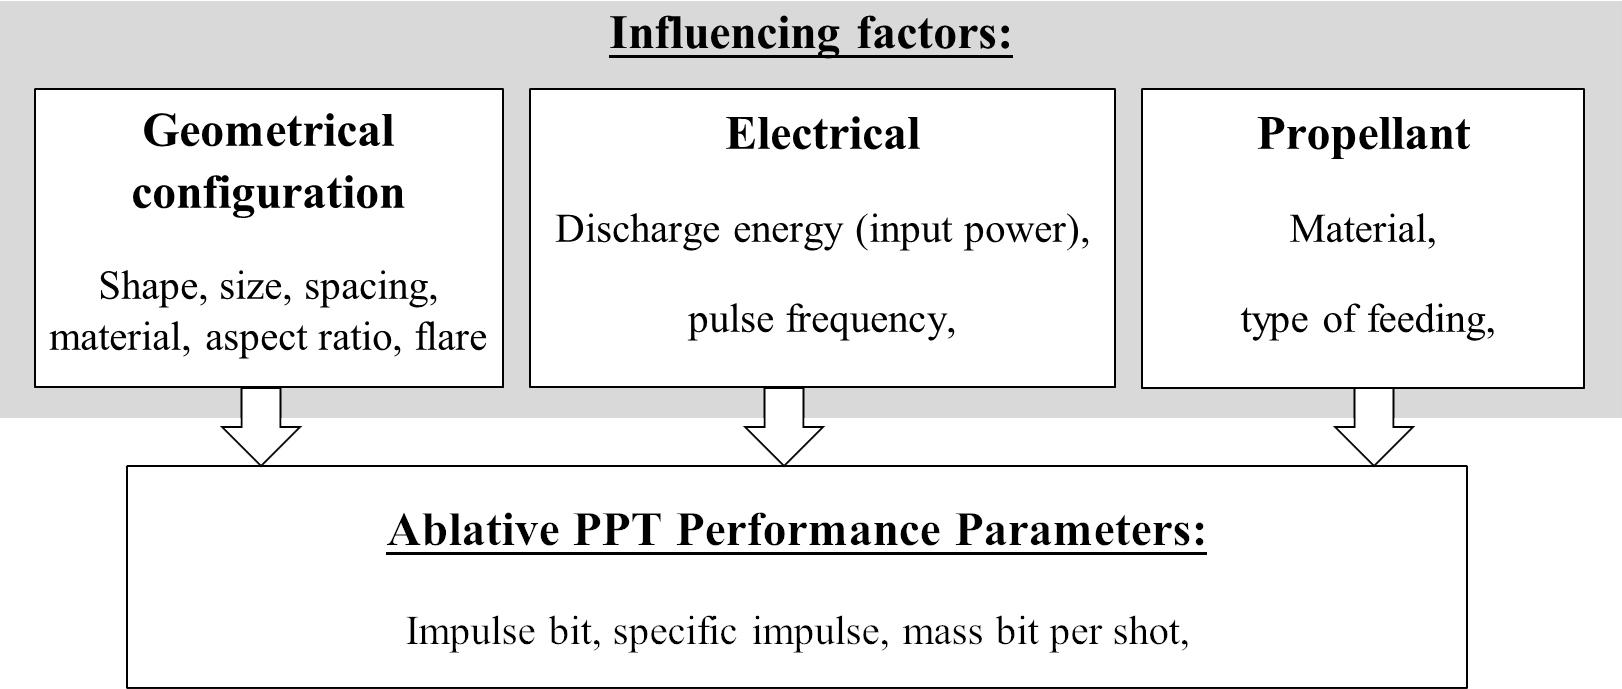
Fig. 1 Factors that influence and parameters that characterize the performance of PPTs.
Download figure:
Standard imageFor the propellant factor, the review by Ling et al in 2020[15] highlighted several prior studies on PTFE propellants that were composited with other materials. For example, Palumbo and Guman [10] blended PTFE with 10%–30% of LiOH and InBr, Ou Yang et al [16] blended PTFE with Si, Al and Al2O3, and Kamhawi and Pencil [17] improved the impregnated PTFE with 2% carbon by weight. All these PTFE composites improved the ablation rate and thrust efficiency. Other than solid materials, liquid propellants such as perfluoropolyether have also been studied as alternative propellant fuels because they leave no carbon deposits, which can cause failure of the PPT [18]. Generally, liquid propellants require a feeding system, which makes them less compact than their solid counterparts.
The impulse bit (Ibit), specific impulse (Isp) and thrust efficiency (η) are key parameters for characterizing the performance of a PPTs. Ibit is the impulse produced by a single firing of the thruster. A high Ibit is usually an important selection criterion for PPTs. However, in some applications, a small change in momentum is required to pinpoint the location of a satellite to a sub-millimeter scale. In this case the minimum impulse bit capability can be a deciding factor. On the other hand, Isp is a measure of propellant utilization and is determined by how much impulse is produced per unit of ablated mass of propellant. A higher specific impulse means less mass of propellant being expelled to produce a given amount of thrust. The thrust efficiency (η) is calculated from the conversion of the electrical energy stored in the capacitor into the kinetic energy.
In this work, the performance of a PPT with its electrical discharge energy (or storage energy in the capacitor) in the low range of 0.5‒2.5 J is studied. Tongue-flared electrode geometry and a side-fed PTFE solid propellant are used as these have been known to produce excellent thrust efficiency. The impulse bit (Ibit), specific impulse (Isp), mass bit (mbit) and thrust efficiency (η) are measured by a torsional thrust stand and the performance is compared to other PPTs with similar discharge energy. The degradation of the solid PTFE propellant is evaluated via field-effect scanning electron microscopy (FESEM) imaging and energy dispersive X-ray (EDX) analysis of the PTFE surface after 1000 discharges or shots.
2. Experimental methods
2.1. Thruster design
Figure 2(a) shows a schematic of the PPT discharge circuit and the thruster propulsion by
J
 B
force. The arrangement of the side-fed, tongue-flared electrode is shown in figure 2(b), in which a trigger pin is inserted into the cathode. The electrical discharge produces the plasma at the PTFE surface that is expulsed by the
J
B
force. The arrangement of the side-fed, tongue-flared electrode is shown in figure 2(b), in which a trigger pin is inserted into the cathode. The electrical discharge produces the plasma at the PTFE surface that is expulsed by the
J
 B
force and creates a thrust in the opposite direction. The design parameters of our PPT system have been described in reference [19] and summarized in table 1. The discharge energy,
B
force and creates a thrust in the opposite direction. The design parameters of our PPT system have been described in reference [19] and summarized in table 1. The discharge energy,  where C is the capacitance and V0 the charging voltage is increased from 0.5 to 2.5 J at incremental steps of 0.5 J. The PPT system is housed inside a 127 L cylindrical chamber (internal diameter 48 cm, length 70 cm) that is evacuated using a turbo molecular pump (Balzers TPH-190) backed by a rotary vane mechanical pump (Edwards E2M18). The lowest base pressure is 5×10⁻⁵ mbar for the PPT operation.
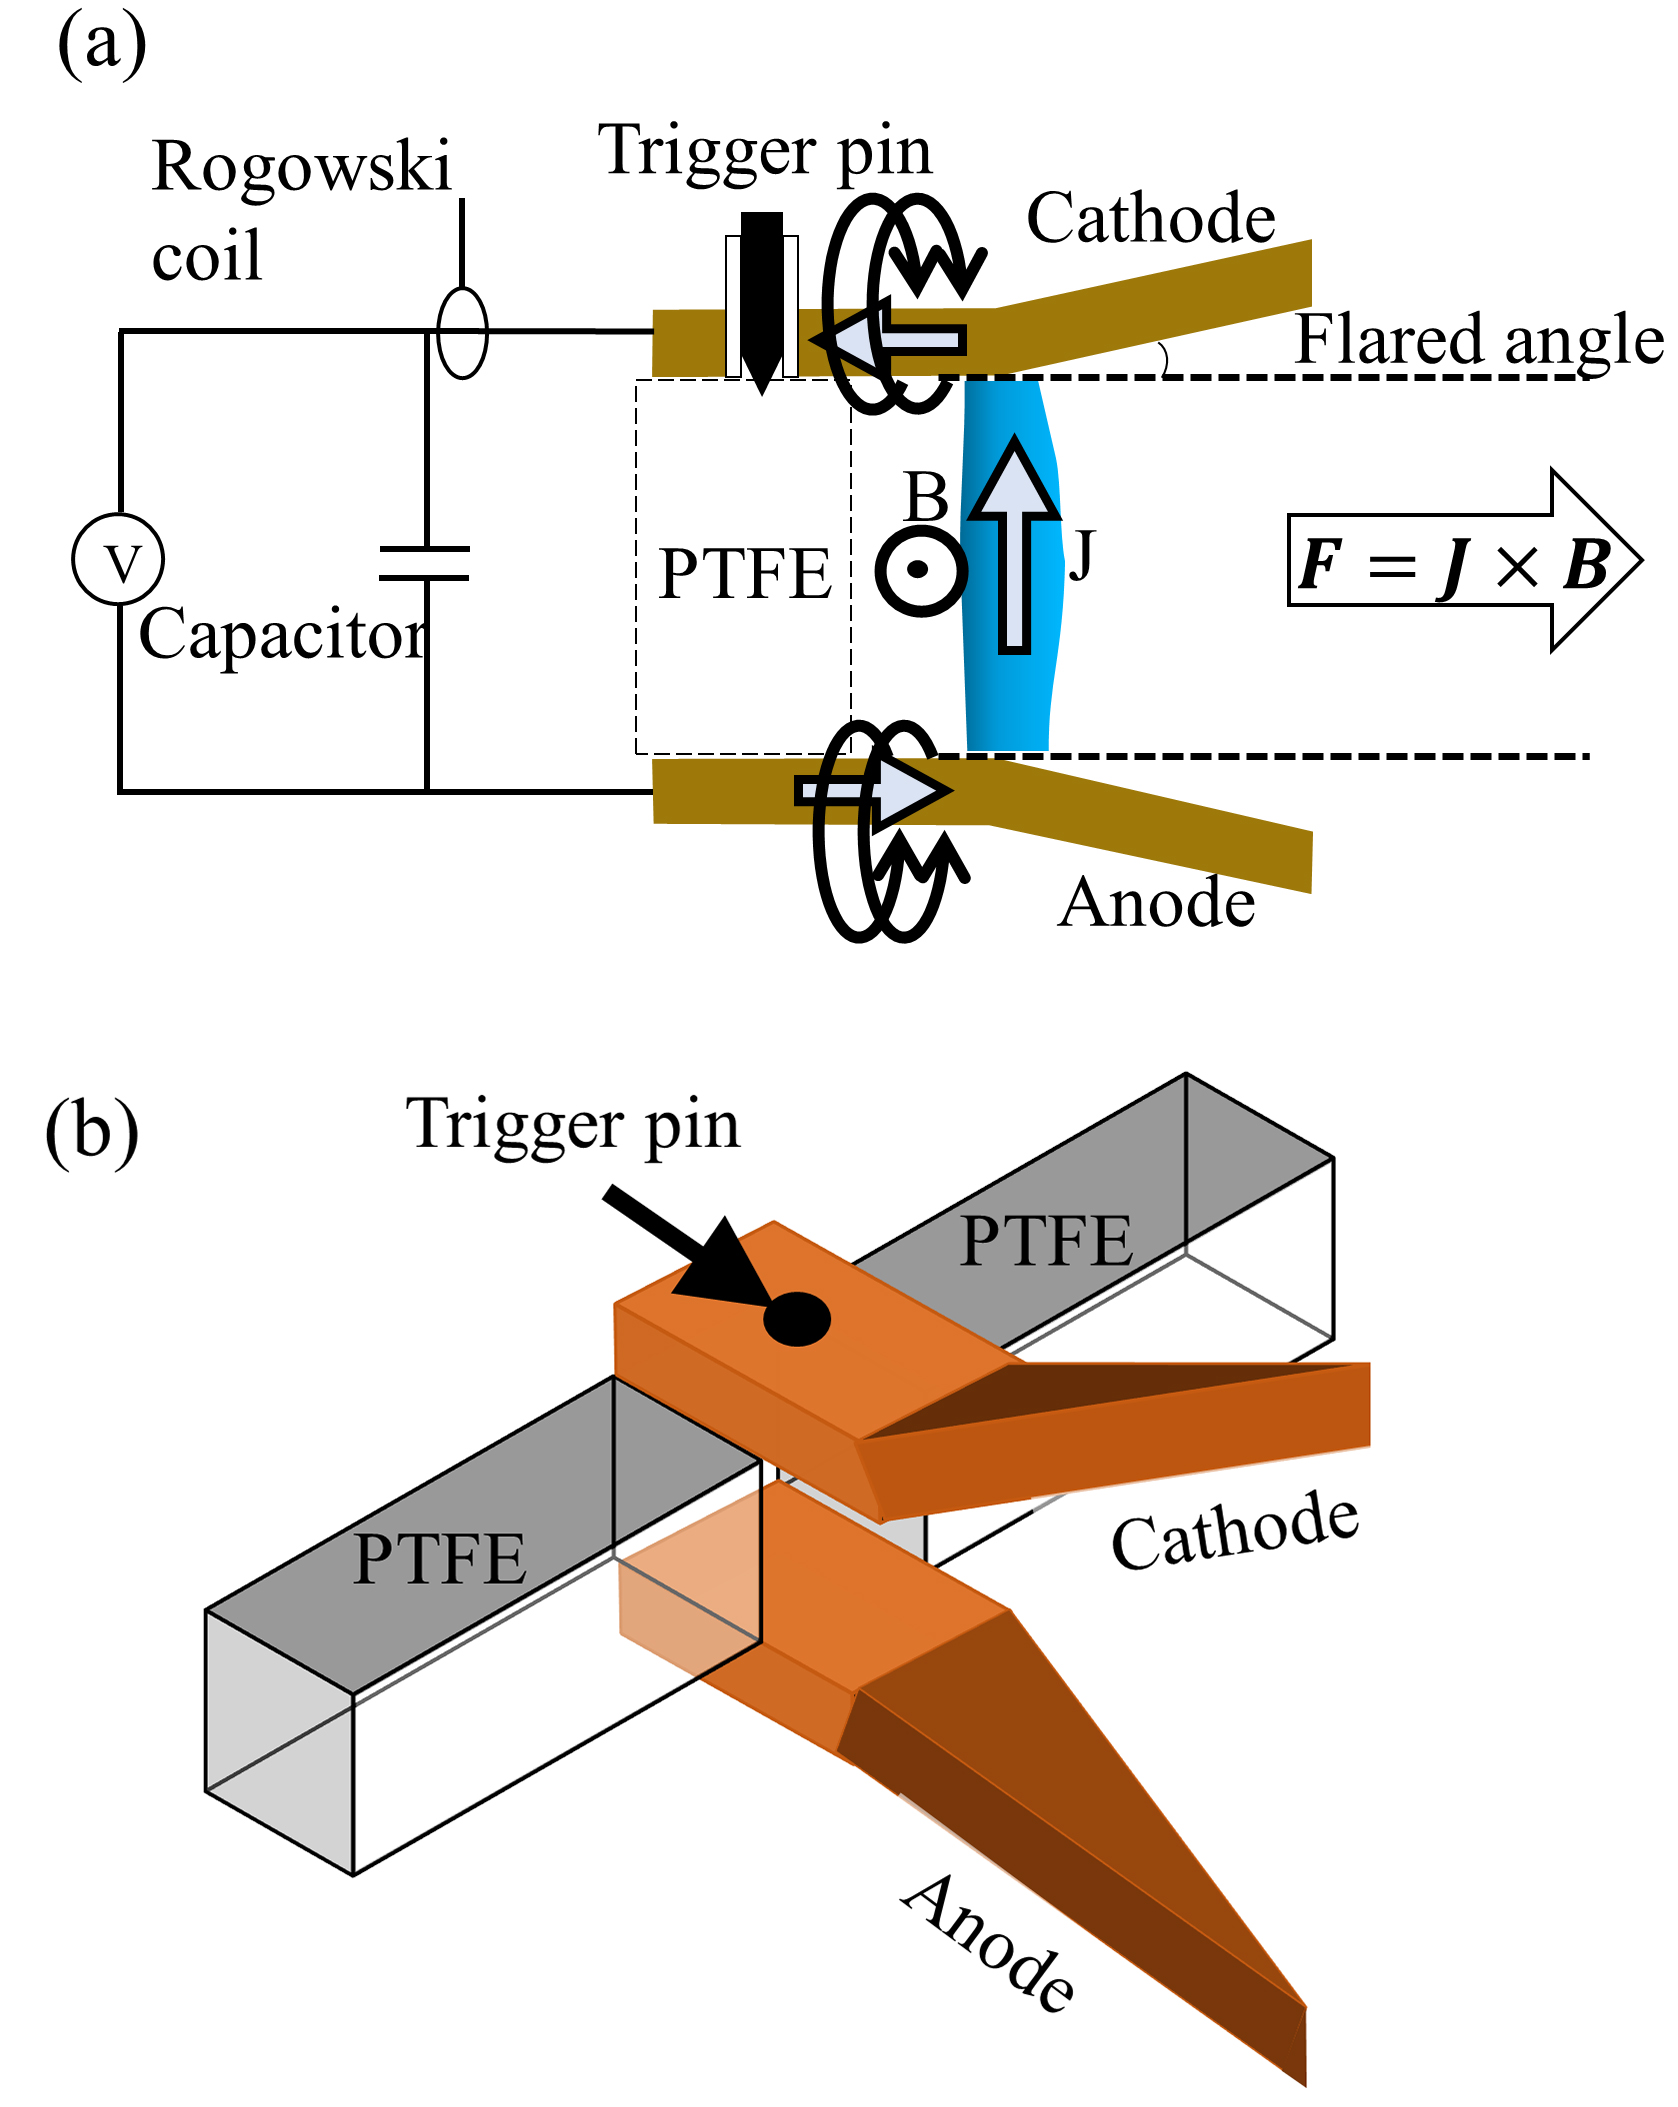
Fig. 2 (a) Schematic of the basic workings of the PPT circuit. (b) Electrode arrangement of the PPT.
Download figure:
Standard imageTable 1. PPT parameters.
| Parameter | Value | Parameter | Value |
| Discharge energy, E0 | 0.5‒2.5 J | Capacitance, C | 0.94 μF |
| Electrode thickness, t | 5 mm | Electrode flared angle, α/2 | 20° |
| Electrode gap distance (parallel section), h0 | 10 mm | Electrode gap distance (widest of flared section), he | ≈ 21 mm |
| Electrode width of parallel rectangular section, w0 | 5 mm | Electrode width of tip of tongue shaped section, we | ≈ 0 mm |
| Axial length of parallel rectangular section, x1 | 10 mm | Axial length of flared, tongue shaped section, x2 | 15 mm |
| Total area of exposed propellent surface (total), A | 1 cm2 | Ratio E0/A | 0.5‒2.5 J/cm2 |
The discharge voltage is measured across the electrodes using a high-voltage differential probe (Micsig DP20003), whereas the current is monitored by a Rogowski coil placed at the cathode, as shown in figure 2(a). Figure 3 shows the typical voltage and current waveforms from PPT operation at different discharge energies between 0.5 and 2.5 J.
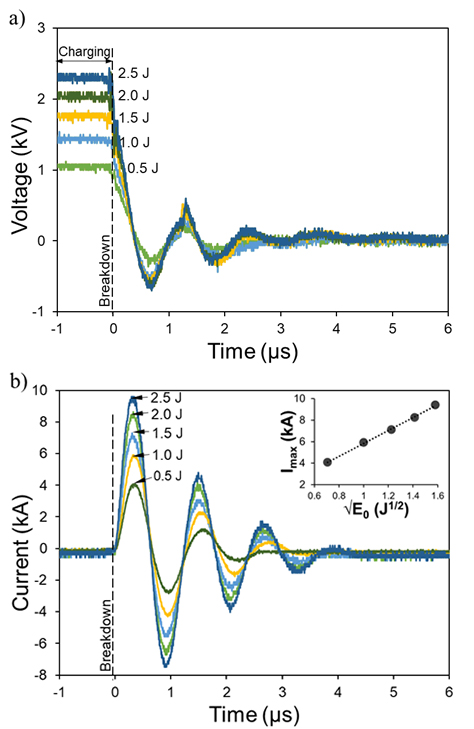
Fig. 3 (a) Discharge voltage measured across the electrodes, and (b) discharge current for different discharge energies. Inset shows plot of current maximum (first current peak) versus the square root of discharge energy.
Download figure:
Standard imageIt is noted that, irrespective of the discharge energy, the oscillation period of the voltage waveform remains constant at 1.22 ± 0.01 μs. Here, the plasma resistance is assumed to be negligible, but the period may depend on the initial inductance L0 according to the simple relation,  [20]. From this, the approximated value of L0 is 40 nH. A constant period implies that the time length of exposure of the PTFE surface to the current and the radiation from the plasma sheet are the same for the different discharge energies. Likewise, the position of the current density maximum along the electrodes is expected to be the same at the different energies. The inset plot of the current maximum Imax shows a linear relationship to the square root of discharge energy, E0, as described by equation (

where R and L are the mean resistance and inductance, respectively [18]. The capacitance is fixed and the inductance can be assumed to stay constant since the position of the maximum current is the same. The maximum current may be taken to represent the ablation rate of the propellant although the waveform is oscillatory. It usually occurs in low-power PPTs because of the small capacitance [21].
2.2. Torsional thrust stand
A sub-μN torsional thrust stand [22] is used to obtain the impulse bit of the PPT (figure 4) that is produced by the thrust. The resulting impulse produces a small momentary displacement in the torsional arm and this displacement is detected by a compact laser displacement sensor (Panasonic HL-G103-S-J) that is mounted facing the end (B) of the torsional arm. The laser displacement sensor has a sensitivity of 0.1 µm and a sampling rate of 5 kHz; it is interfaced to the computer and the displacement data is acquired via the software HL-G1SMI.
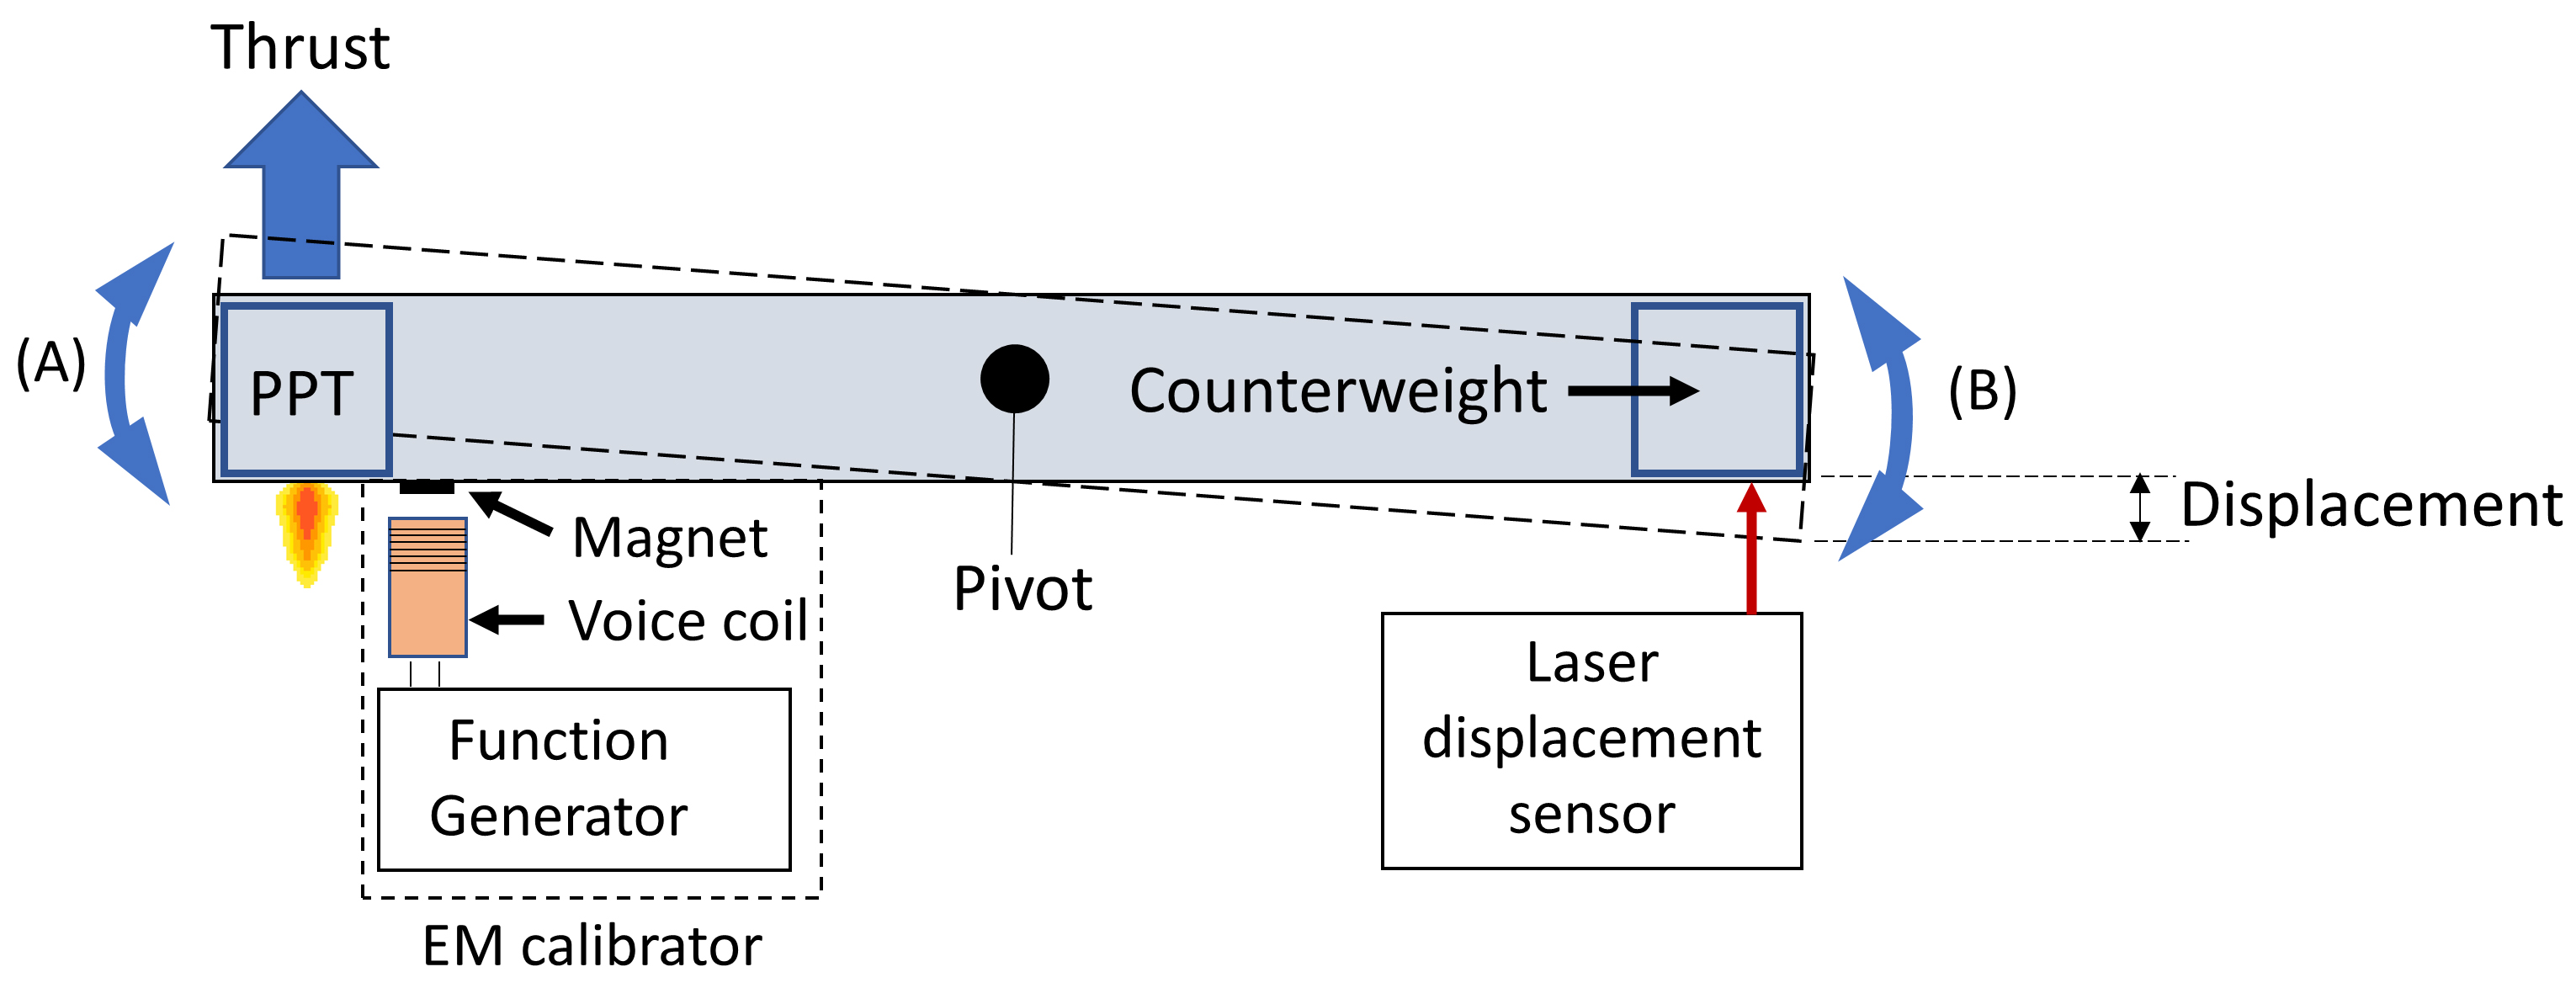
Fig. 4 Schematic diagram of the torsional thrust stand (top view).
Download figure:
Standard imageTo calibrate the displacement to the impulse bit, an electromagnetic (EM) calibrator is placed externally. Its positioning and engagement distance to a permanent magnet fixed to the other end (A) of the torsional arm are adjusted using a mechanical stage. The EM calibrator is connected to a function generator (RIGOL DG4062) to produce a squared wave pulse. By adjusting the pulse amplitude and the pulse width, different levels of calibration impulse bit can be produced. Each maximum deflection range corresponding to the applied impulse bit is plotted to produce the calibration curve, as shown in figure 5.
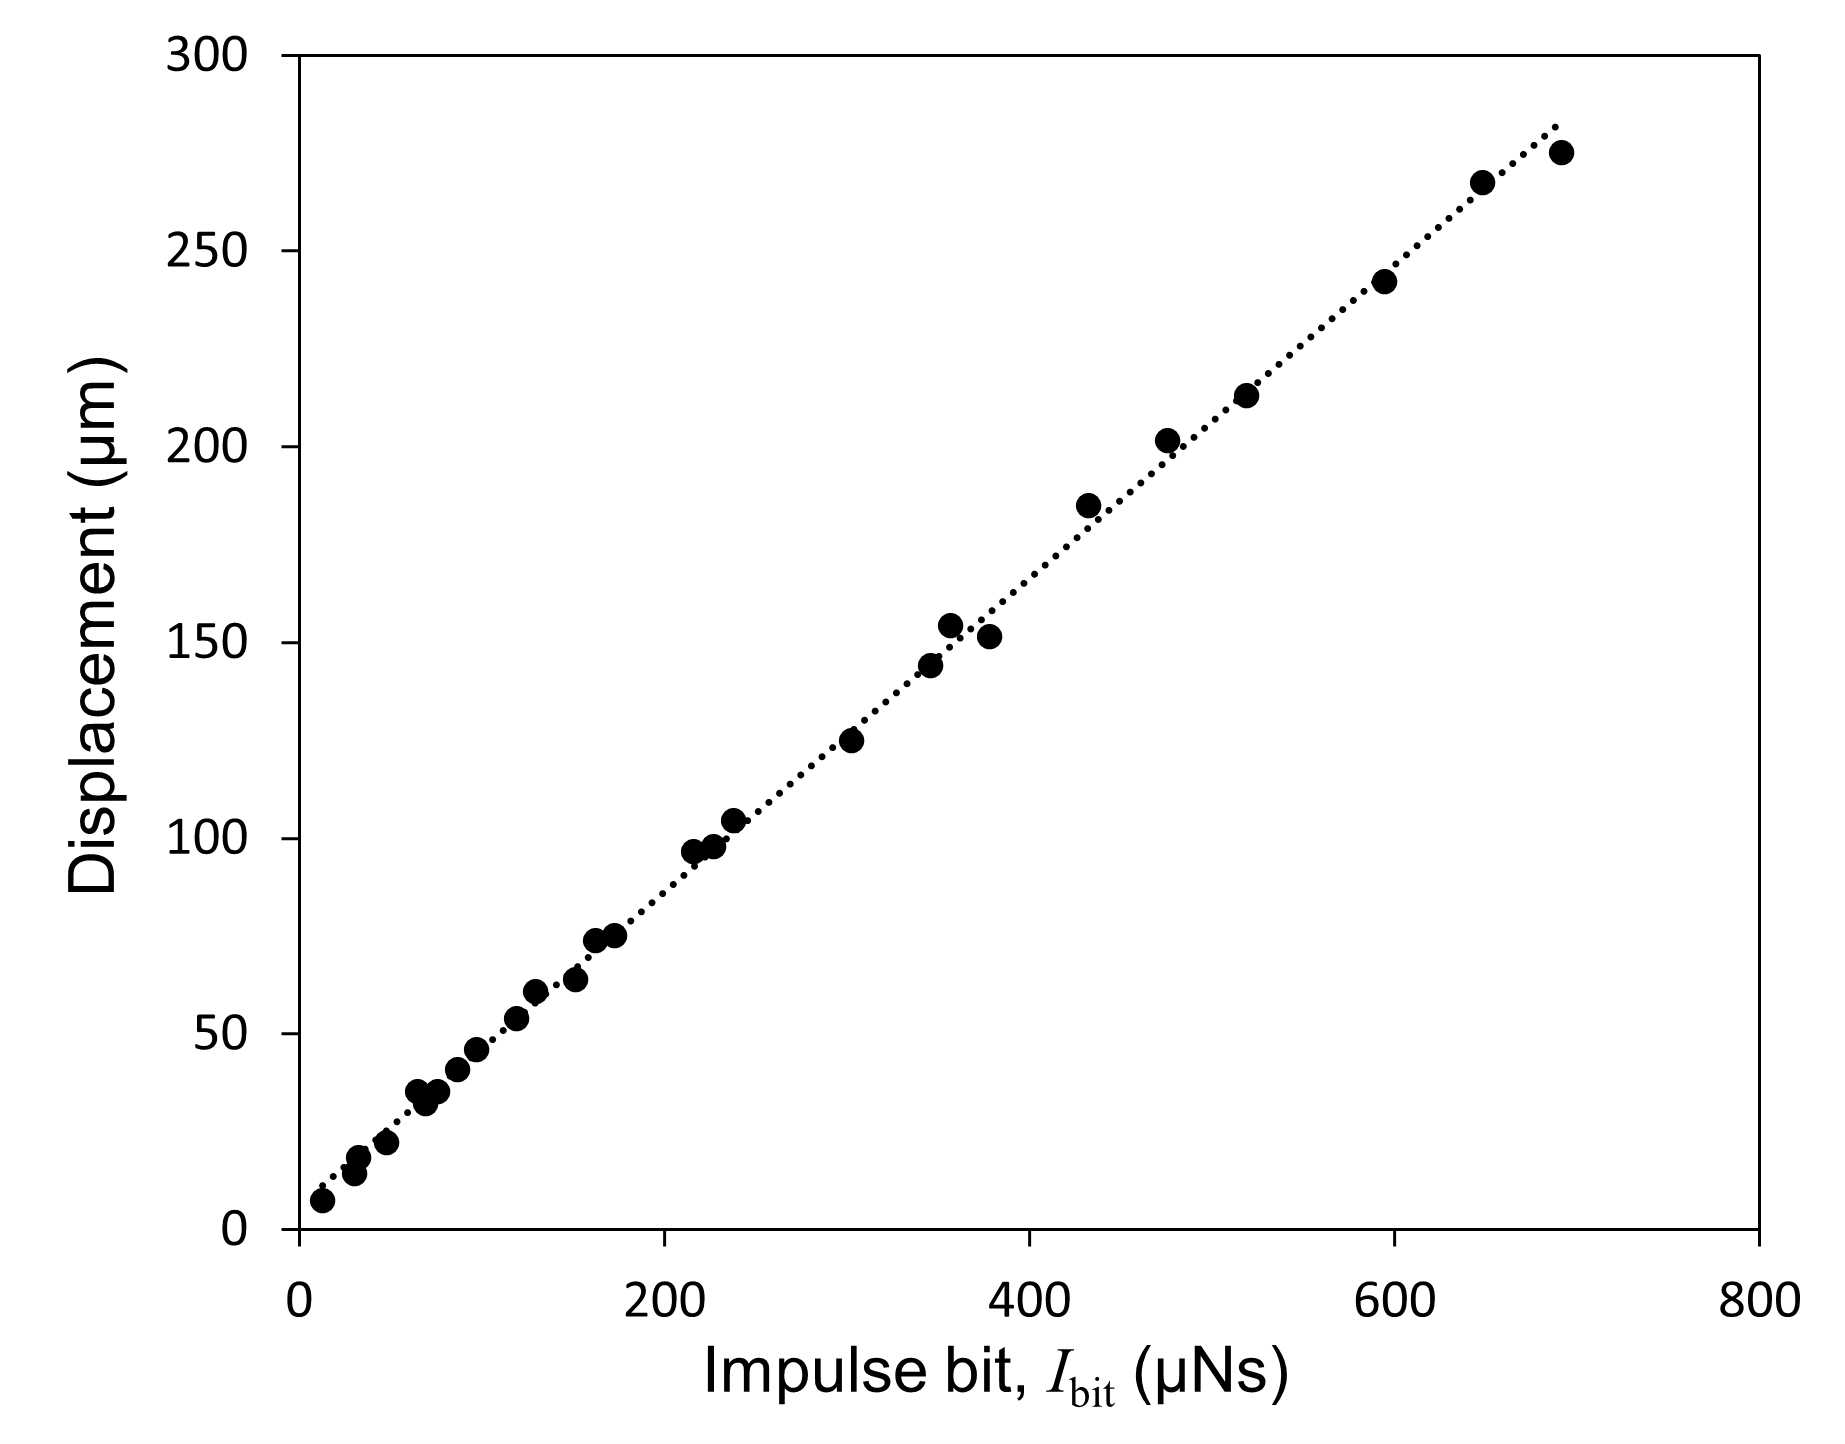
Fig. 5 Calibration curve for the torsional thrust stand.
Download figure:
Standard imageUncertainty in the EM calibrator system originates from the resolution of the instrumentations used. By combining the individual errors contributed by each instrument, the uncertainty error in the EM calibration can be calculated as:
where the term β has been added to consider all the unpredictable sources of disturbance. The known sources of error are summarized in table 2. The value of β has been chosen to be 20% for a worst-case estimate of the error, thus a more conservative Ibit evaluation is achieved. In the present configuration, the uncertainty in the Ibit measurement is 12%.
Table 2. Known sources of error for the uncertainty analysis.
| Relative uncertainty | Value (%) | |
| Current, I |

| 2.5 |
| EM calibration forces, Fc |

| 0.4 |
| Engagement distance, x |

| 0.5 |
| Pulse width, tc |

| 0.7 |
Deflection, 
|

| 4.3 |
| Non-linearity of EM force |

| 8 |
3. Results and analysis
3.1. Impulse characteristics
3.1.1. Impulse bit (Ibit)
Figure 6 shows that Ibit increases linearly with discharge energy, from  at 0.5 J to
  at 2.5 J. The values shown are averaged over 10 data points, and the error bars indicate twice the standard deviation. The specific impulse bit (or specific thrust), Ibit/E0, obtained from the data in figure 6 is 17 μNs/J. The impulse bit values reported in other PPTs of similar flared electrodes with a side-fed propellant configuration [2, 23, 24] fall within the trendline. Of the three references, Tran et al [2] used tongue-shaped electrodes. Clark et al [23] also showed a linear trend for a small range of E0 from 0.6 to 2 J and their Ibit/E0 was 17 μNs/J. For much higher discharge energies up to 800 J, Gessini and Paccani [25] showed a much higher Ibit/E of 38.6 μNs/J.
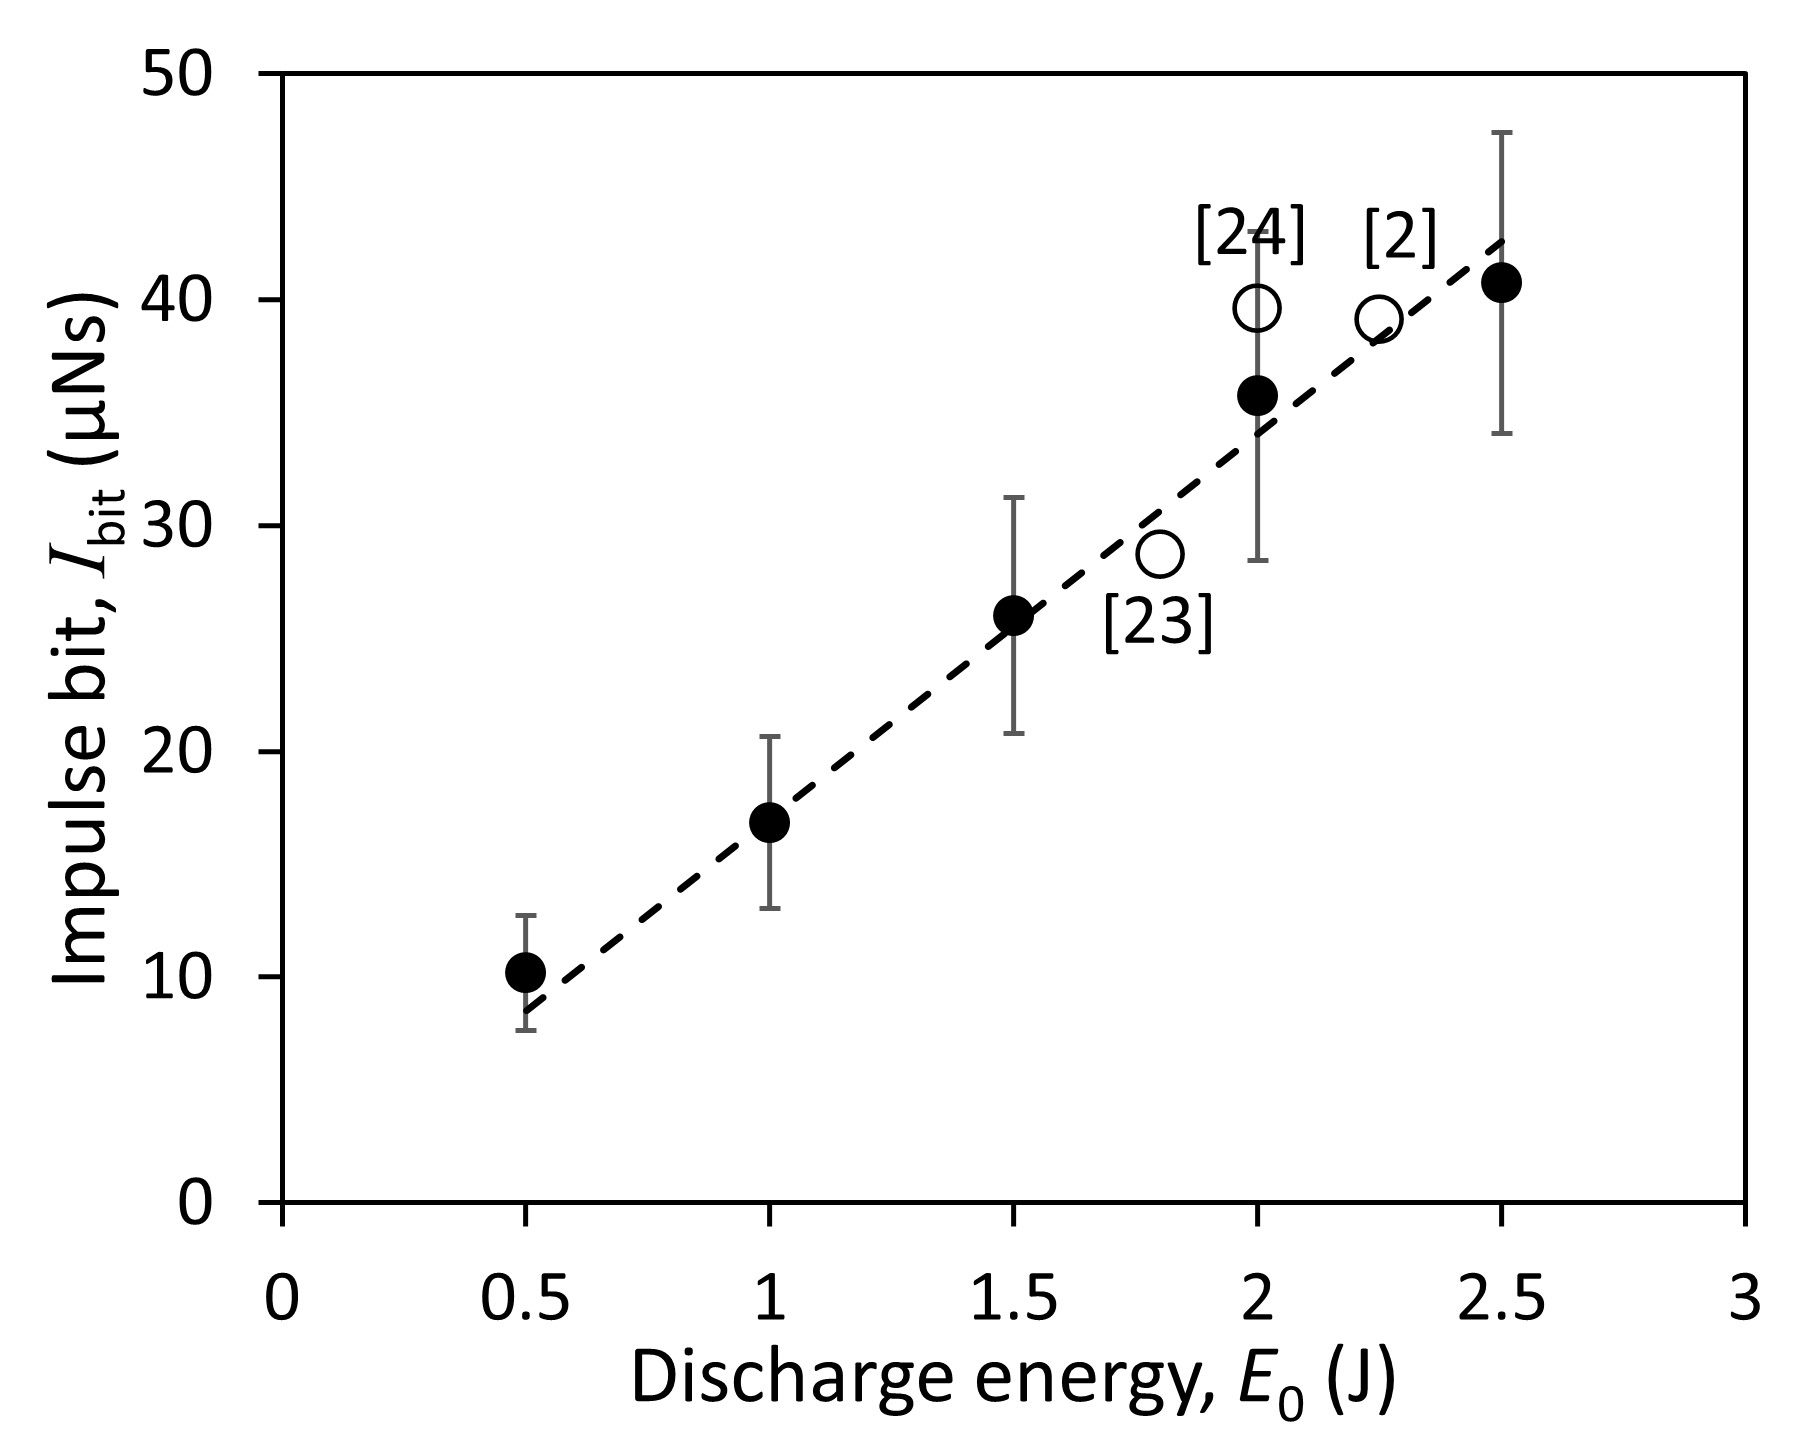
Fig. 6 Impulse bit as a function of discharge energy. Ibit from similar flared electrodes, side-fed PPTs [2, 23, 24] are included for comparison.
Download figure:
Standard imageIt is noted that some applications of PPTs require an extremely small and precise momentum change per pulse. This is important for the fine tuning of a satellite's location or altitude to a fraction of a millimeter. Thus, the small impulse bit capability of the PPT at low energy may be an advantage.
The combined effect from the EM impulse bit, Ibit-em, and the electrothermal component contributes to the total impulse bit (Ibit). Ibit-em is due to the accelerating ions in the discharge plasma, while the electrothermal component is contributed by the energetic neutral particles that are thermally expelled. Ibit-em can be calculated from equation (

where  is the inductance variation per unit length in μH/m and ψ is the current parameter in A2s.
  is dependent on the electrode geometry and its expression becomes more complex when the electrodes are flared and tongue shaped; the mean change in inductance,
  at axial position x of the flared and tongue-shaped section can be expressed as [13]

where μ is the permeability and both the width  and gap height
  are functions of the axial position. For a parallel rectangular geometry,
  can be calculated using the simple expression

where t is the thickness of the electrode and equation (5) is applicable for h/w > 1 [23, 24]. To make an approximate calculation of  , the axial length is segmented into equal sections of axial length 0.1 mm and
  is calculated for each section. Each section will have a different h (due to flaring) and different w (due to the tapered shape). A mean value of
  is estimated from these segments and is equal to 0.8 ± 0.2 μH/m (uncertainty is the standard deviation of 200 data points), about 30% higher than the estimate of 0.6 μH/m for parallel rectangular electrodes.
The current parameter, ψ, is calculated by discretely summing the area under the square of the discharge current curve, i2, and it is proportional to the discharge energy, E0. This linear relation can be fitted to a linear expression proposed by Palumbo and Guman [10],  , where the multiplying coefficient a has been shown to have fitted values of around 2 [10, 23]. The fitted value for a using data from figure 7 is 4.4 ± 0.1. The difference in the fitted values of coefficient a could be attributed to the difference in the thruster design, where Palumbo and Guman [10] and Clark et al [23] are side-fed configurations with flaring rectangular electrodes and this work uses a side-fed configuration with tongue-flared electrodes.
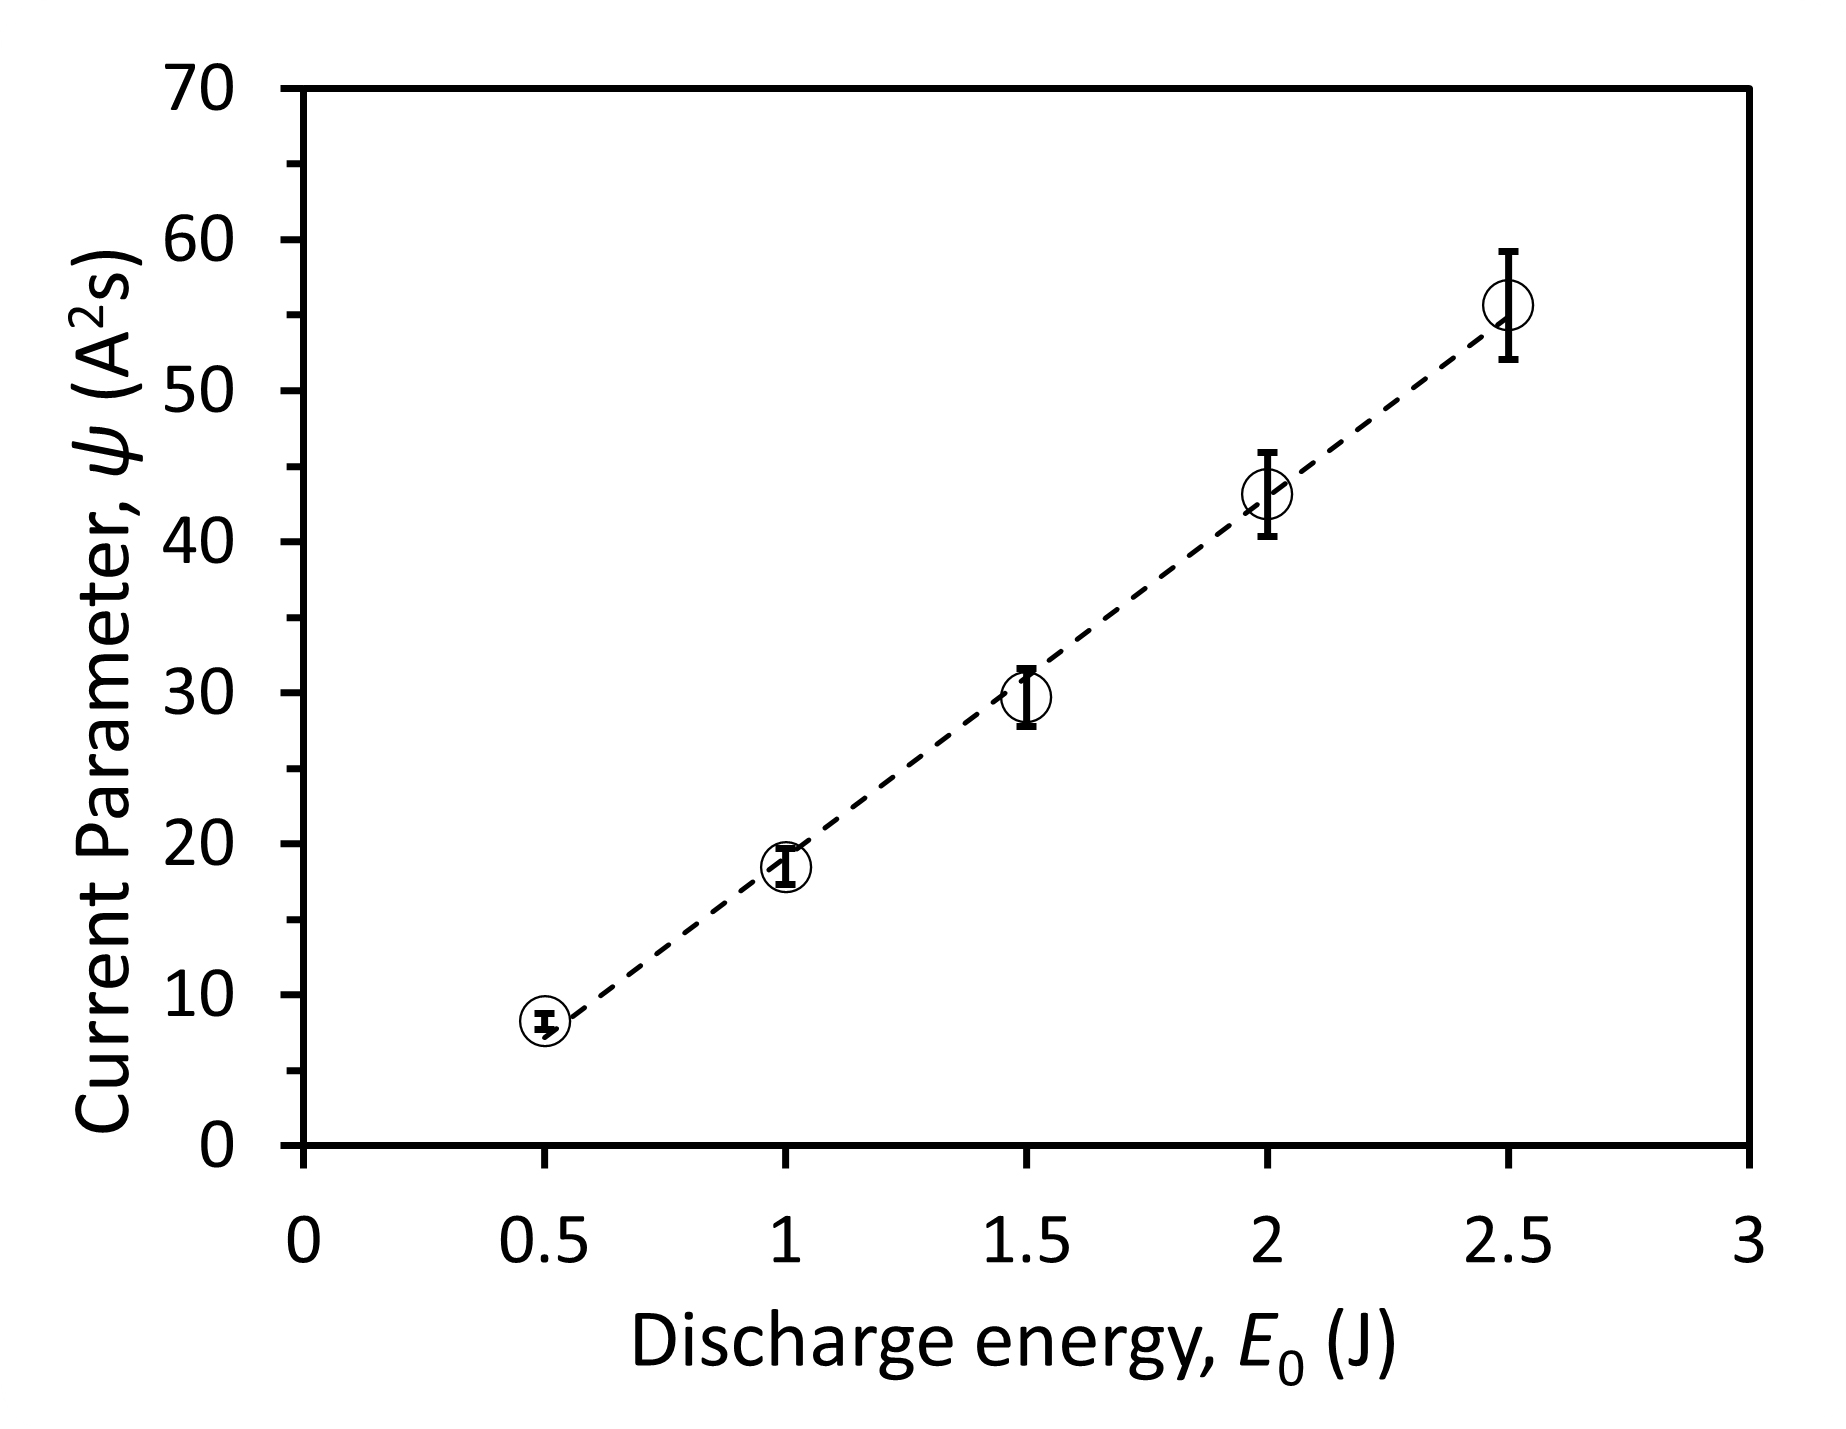
Fig. 7 Current parameter (ψ) as a function of discharge energy.
Download figure:
Standard imageFigure 8 shows the ratio of Ibit-em to Ibit in percentage. The upper curve took into consideration the flare and tapering (tongue shape) electrode geometry while the lower curve (dashed line) is determined for parallel rectangular electrodes. Within the discharge energy of 1–2.5 J, about 50% of the total impulse bit is contributed by the EM component. This is high as PPTs at energies below 20 J are known to be dominantly in the electrothermal mode; hence,  = 0.8 μH/m may be an overestimated value. Additionally, using an uncertainty contributed by one standard deviation from the calculation of the average of
  , the derived uncertainty for the ratio Ibit-em/Ibit is approximately 25%‒50%. The conservative value of 0.6 μH/m (non-flared and rectangular electrodes is assumed) yields the lower curve, demonstrating a reasonable amount of the EM component of approximately 30%. In comparison, the ratio reported by Clark et al [23] for an arrangement of a pair of rectangular electrodes that flare outward from halfway along their axial length falls in-between the upper and lower curves. They used
  = 0.66 μH/m (after Burton et al [26]). At the 0.5 J discharge energy, the ratio is much lower at 24% (at the lower curve), implying that the electrothermal component is the major contributor to the impulse bit. This means only a small portion of the ablated PTFE was ionized and converted to plasma thrust.
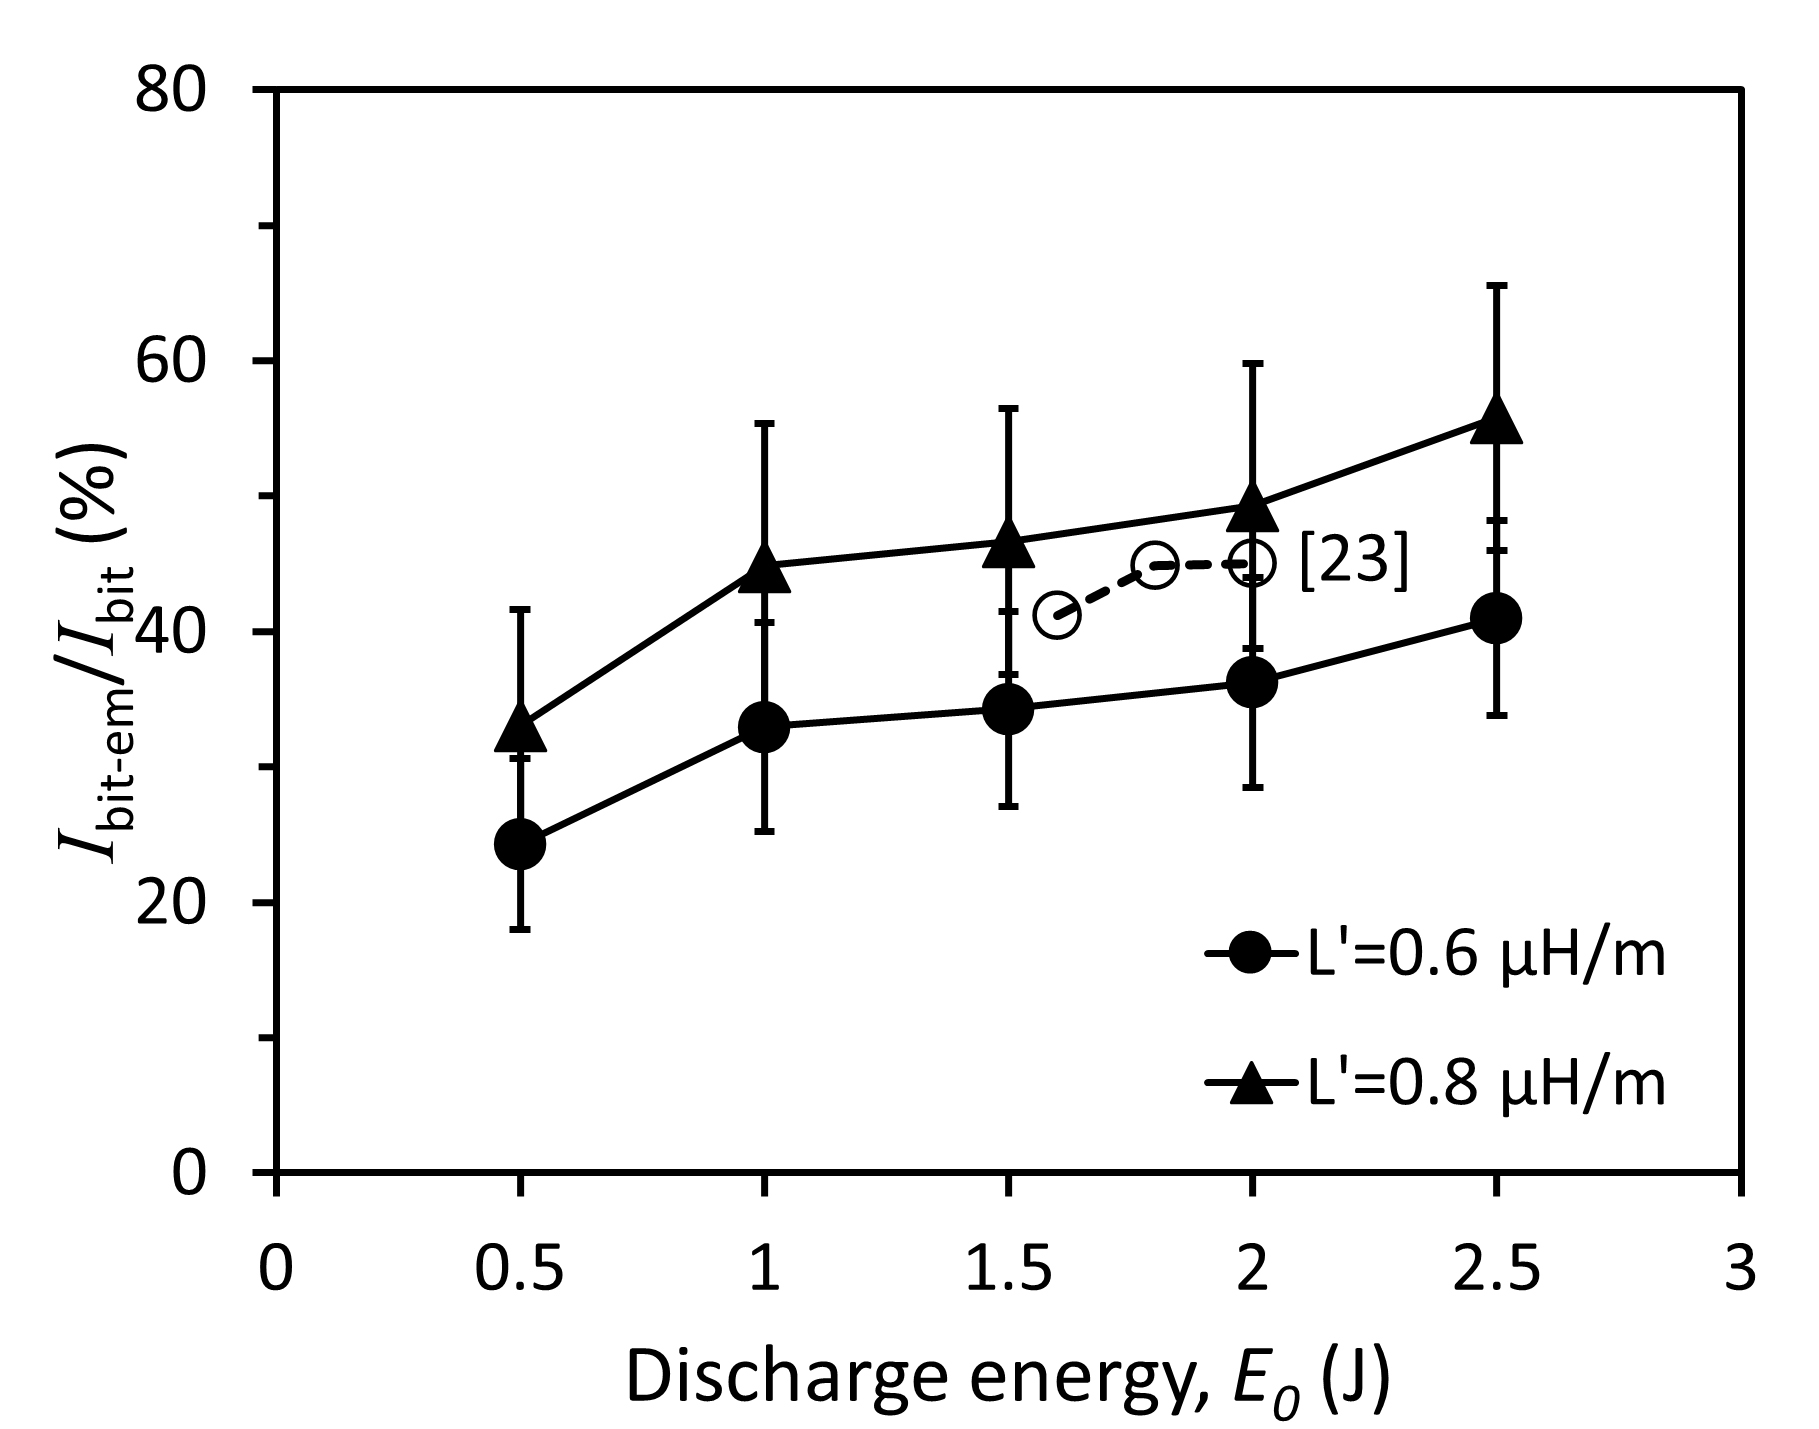
Fig. 8 Percentage of Ibit-em to total Ibit as a function of discharge energy for two different values of  . For comparison, data (hollow circles) from reference [23] are included.
Download figure:
Standard image3.1.2. Mass bit measurement (mbit)
The mass bit (mbit) is a measure of the effect of ablated propellant in a single firing. The value of mbit is determined from the reduction in mass of the solid PTFE propellant bar after 1,000 shots. As shown in figure 9(a), mbit increases linearly from  to
to  with respect to the discharge energy and can be fitted to a relation: mbit = 2.08E0−0.14. The values are lower than those published in references [2, 23, 24]. However, they follow the linear trend reported by Schönherr et al [27] for a tongue-flared PPT (replotted in figure 9(b)) that was operated at much higher capacitances (20- and 80-fold higher) or higher discharge energy. It is noted that the mbit reported in most of the literature is for energies around 2 J and above.
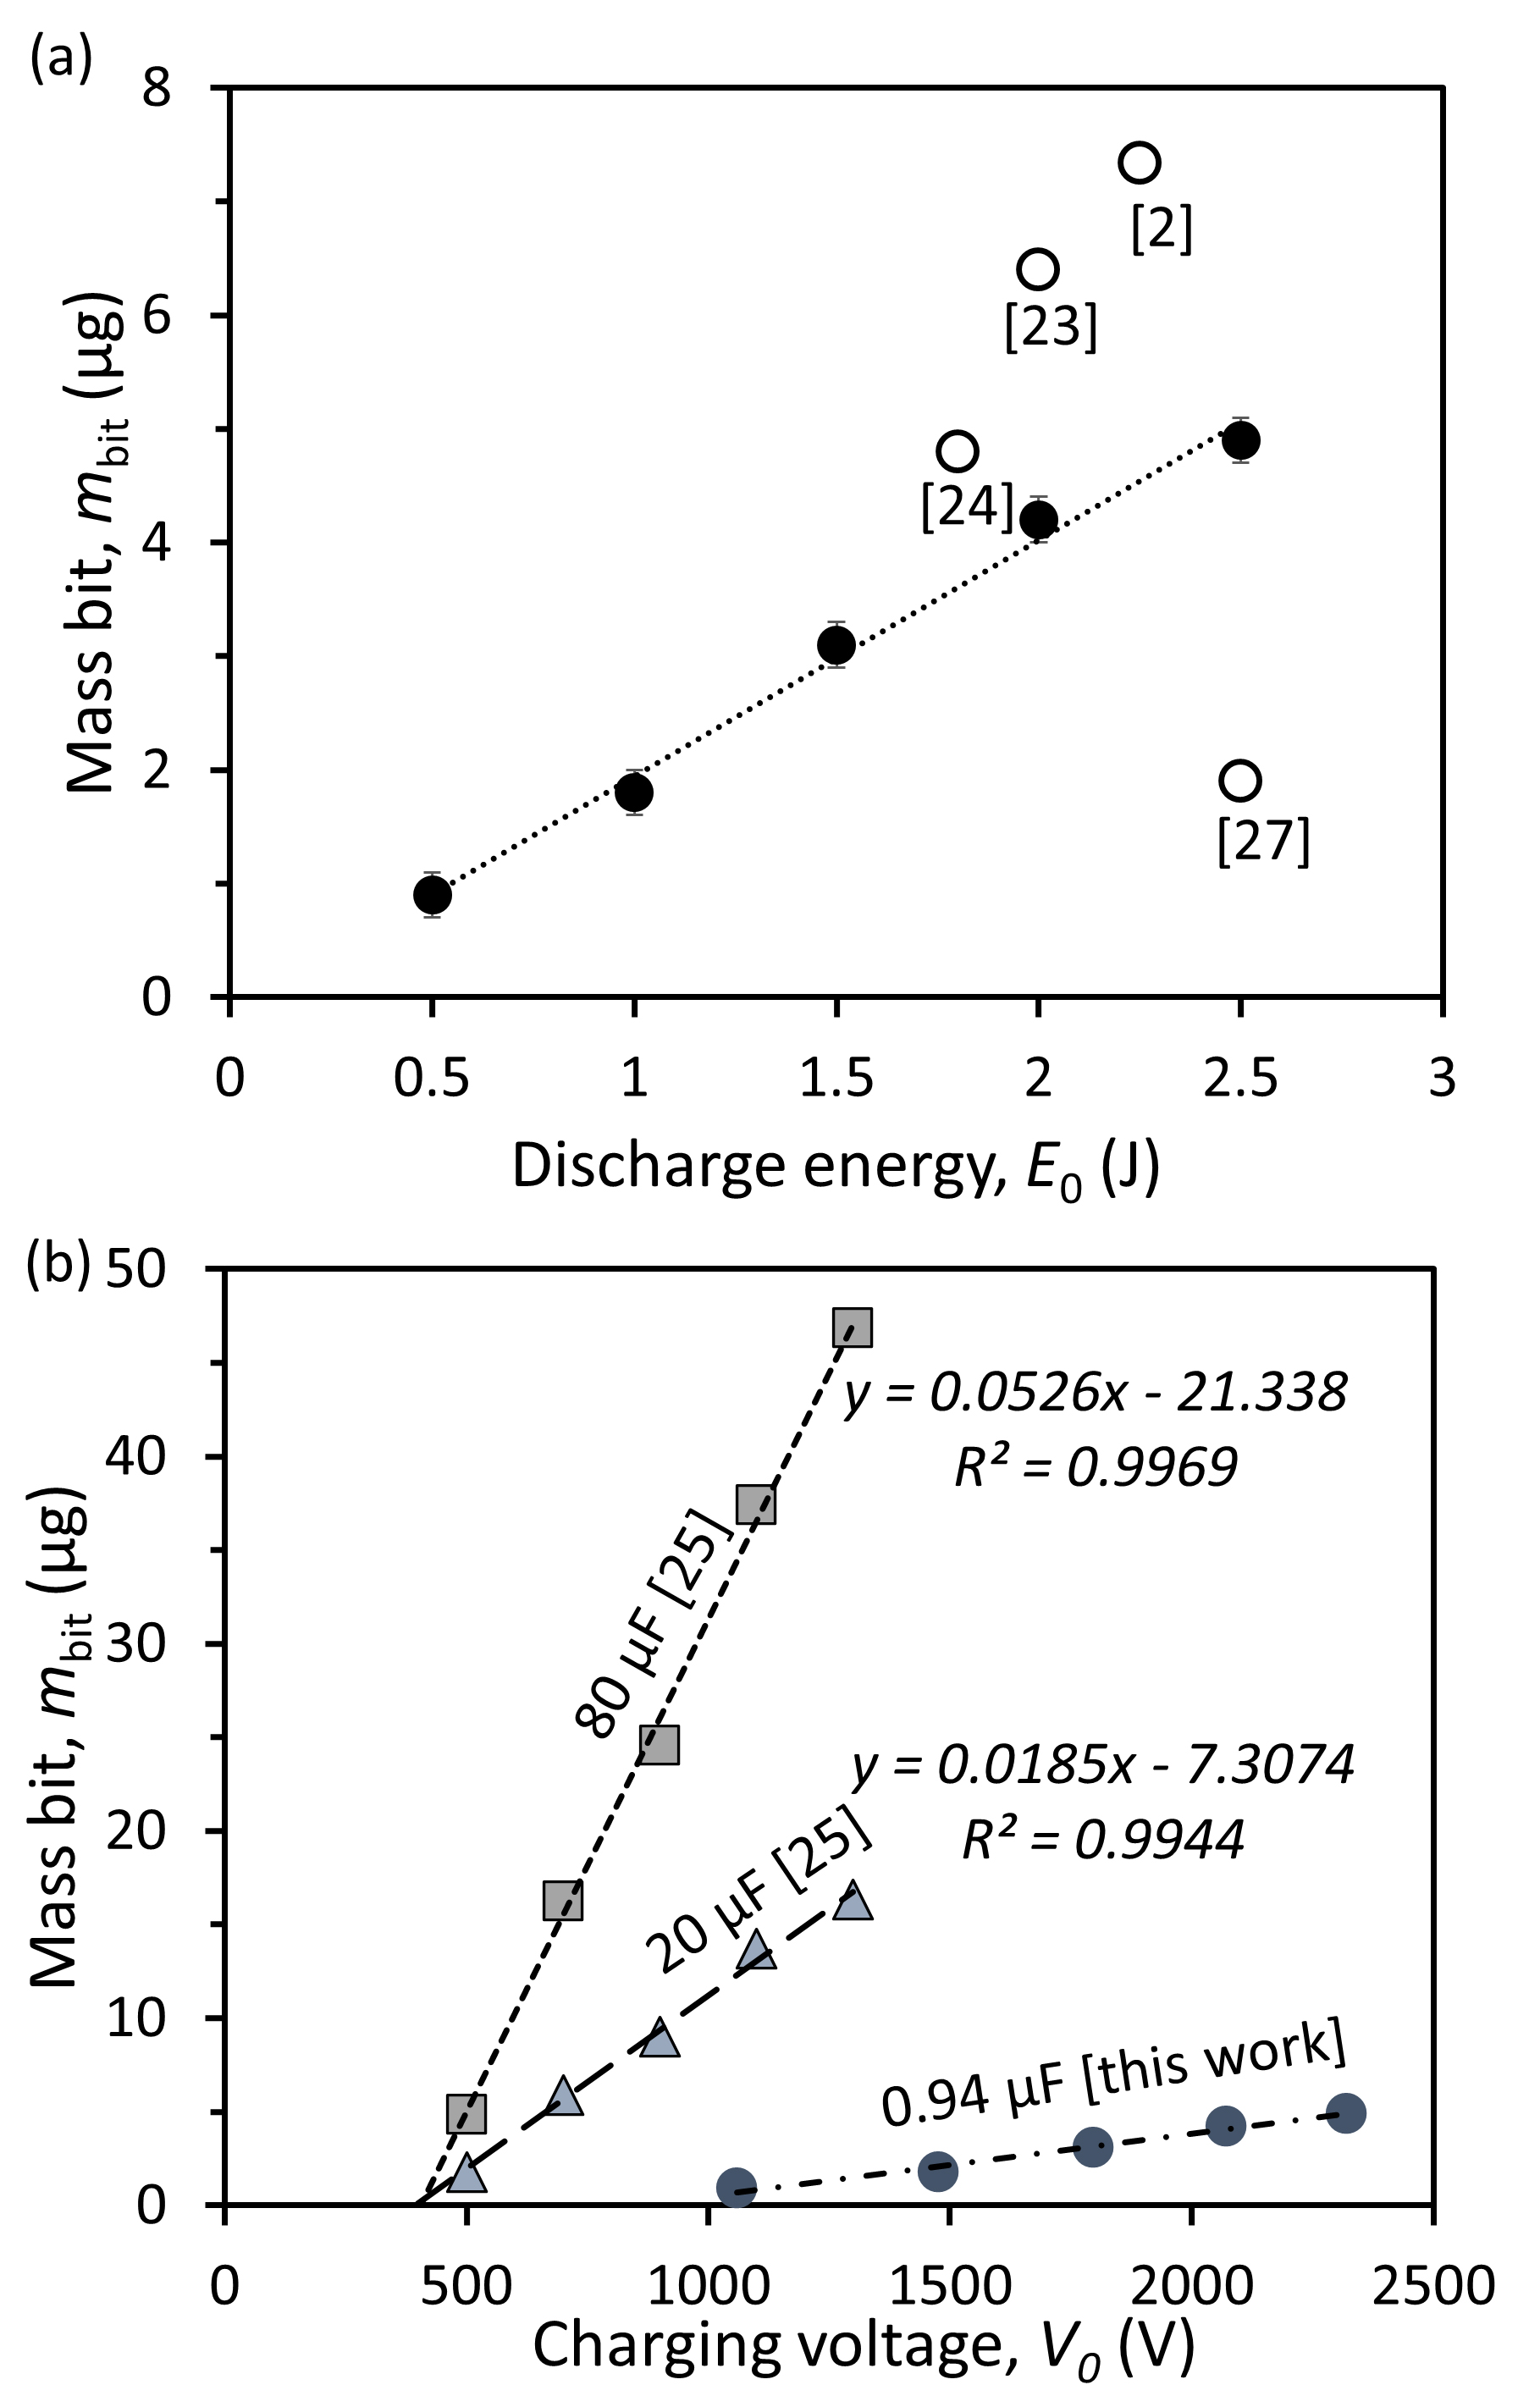
Fig. 9 Mass bit (mbit) as a function of (a) discharge energy and (b) charging voltage. Data from similar flared electrodes, side-fed PPTs [2, 23, 24, 27] are included for comparison.
Download figure:
Standard image3.1.3. Specific impulse (Isp)
The specific impulse (Isp) measures how efficiently the thrust is created by the PPT. A higher specific impulse means that the mass of the ablated propellent is more efficiently used for propulsion. It is calculated using the expression (in units of s):

where  is the gravitational acceleration. Figure 10 plots Isp versus the discharge energy per area of the propellant exposed to the discharge, E0/A, and compared to the semi-empirical specific impulse relations,
  by Gessini and Paccani [25] for side-fed type and
  by Guman [28] for all different geometries of propellant feed. At E0/A below 2 J/cm2, the specific impulse values are about 2–3 times higher than those predicted by Gessini and Paccani. Isp is a derived value from two independently measured parameters, Ibit and mbit. Particularly at very low discharge energy levels (also lower voltage), it is speculated that the arc discharge is weak and may not have been formed directly over the propellant surface. This could result in a relatively much lower liberated PTFE mass. The deposition of carbon back flux from the plasma may be relatively higher (this is observed visually as a larger portion of the surface being covered by black carbon deposit in figure 14 with no distinct whitish eroded track) and, hence, a much lower mass loss is measured, leading to a derived value for Isp that is much higher than those predicted by both semi-empirical relations. Above 1.5 J/cm2, the Isp values are consistent with those estimated from the semi-empirical relation. It is possible that, at lower discharge energy, the effective area is also lower. Thus, the data points of the specific impulse would occur at higher E0/A.
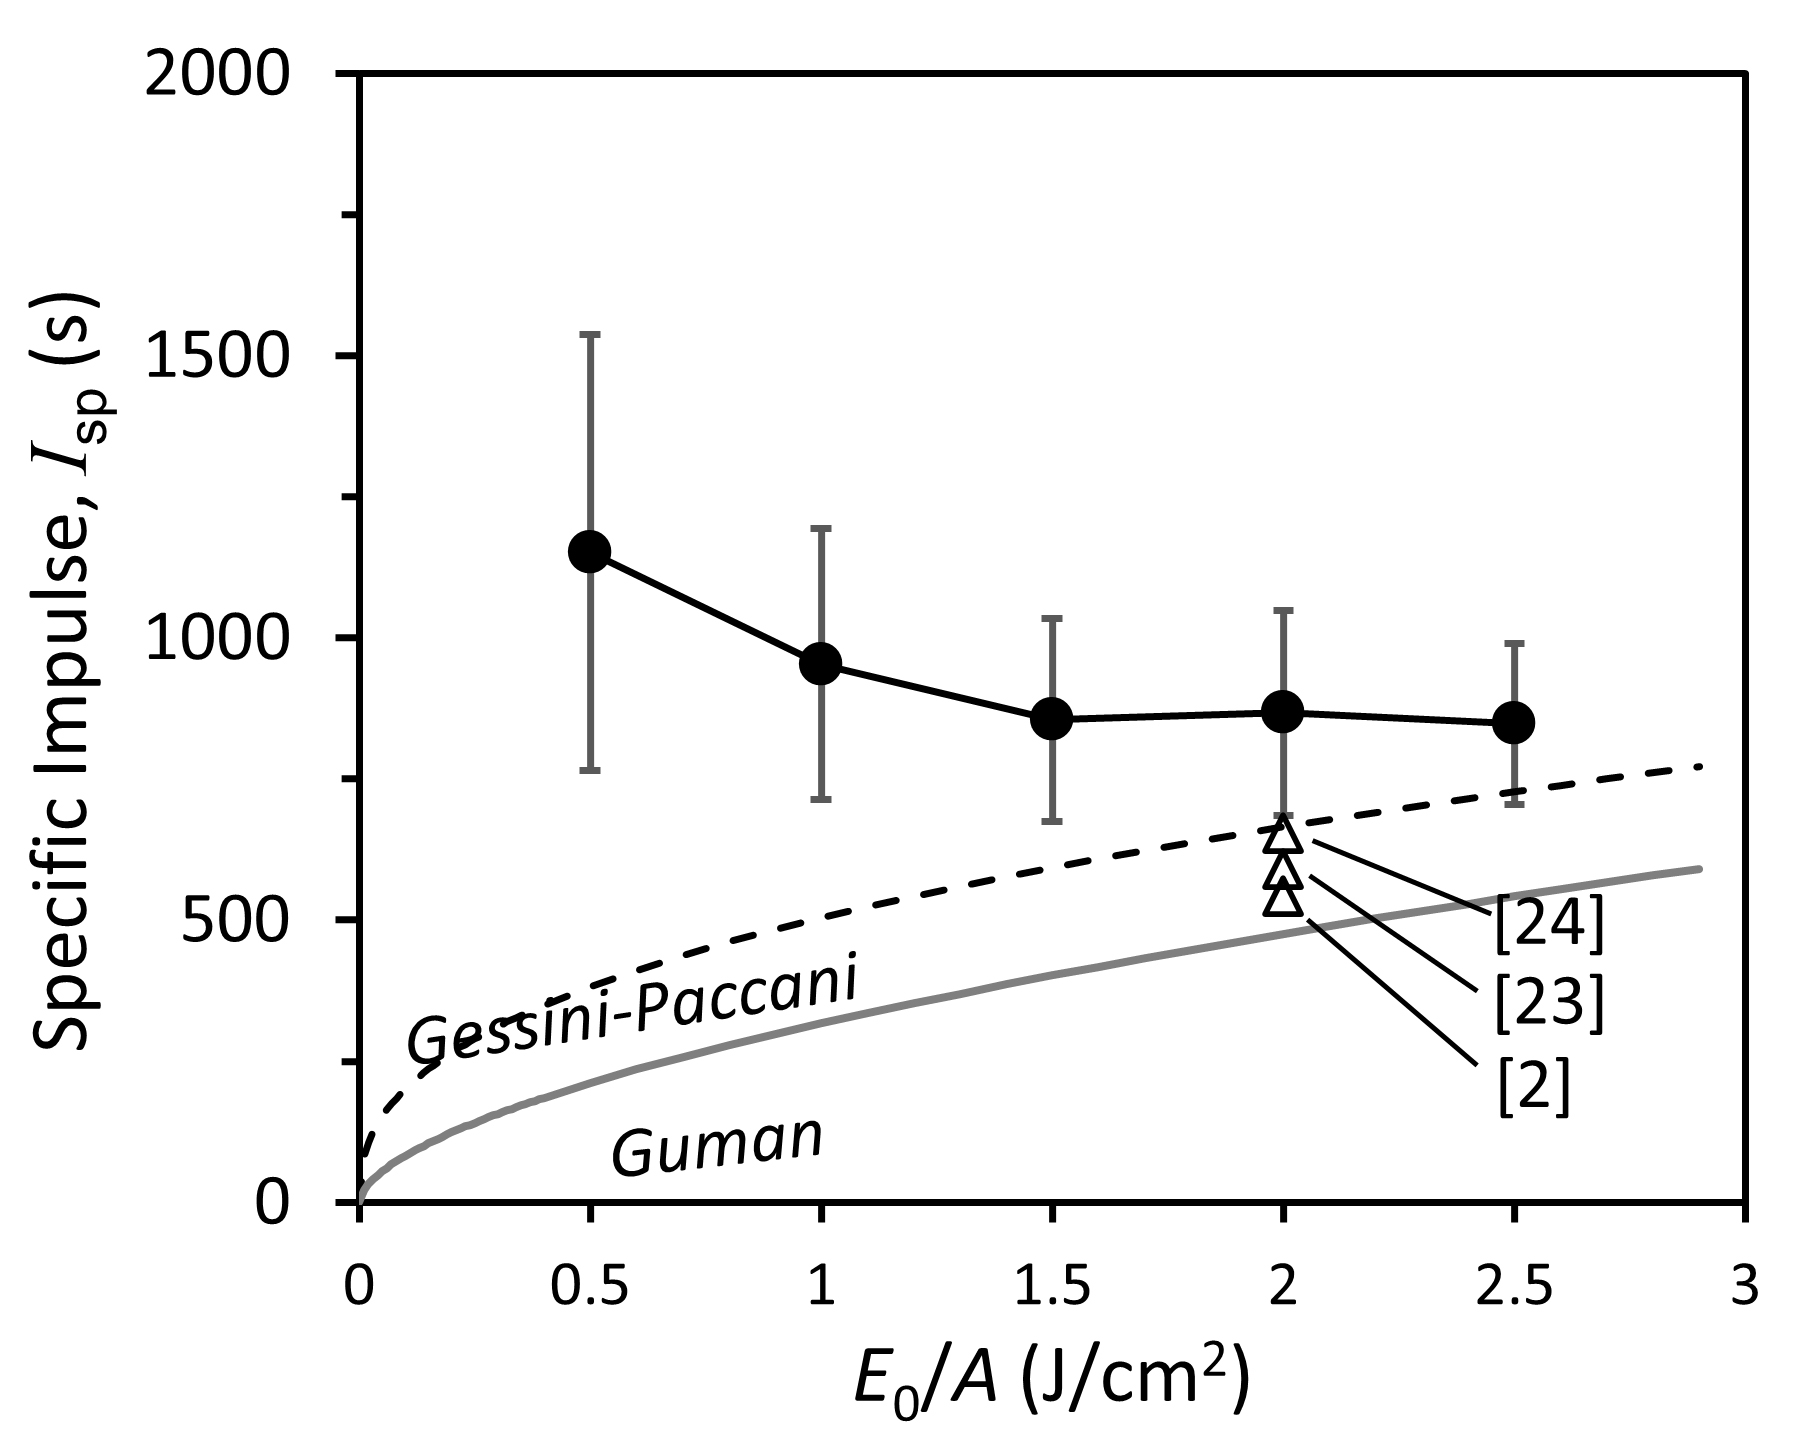
Fig. 10 Specific impulse (Isp) as a function of discharge energy/exposed area of propellant. Isp from flared electrodes, side-fed PPTs [2, 23, 24] are included for comparison.
Download figure:
Standard image3.1.4. Mean exhaust velocity
The mean exhaust velocity, ce, represents the average velocity of all ablated mass bits and is determined from the expression [20]

The variation of ce with discharge energy is shown in figure 11. Like the case in the determination of Isp, ce is also a derived value from the two independently measured Ibit and mbit. A larger value of ce at the lower discharge energies with a high uncertainty level is presented.
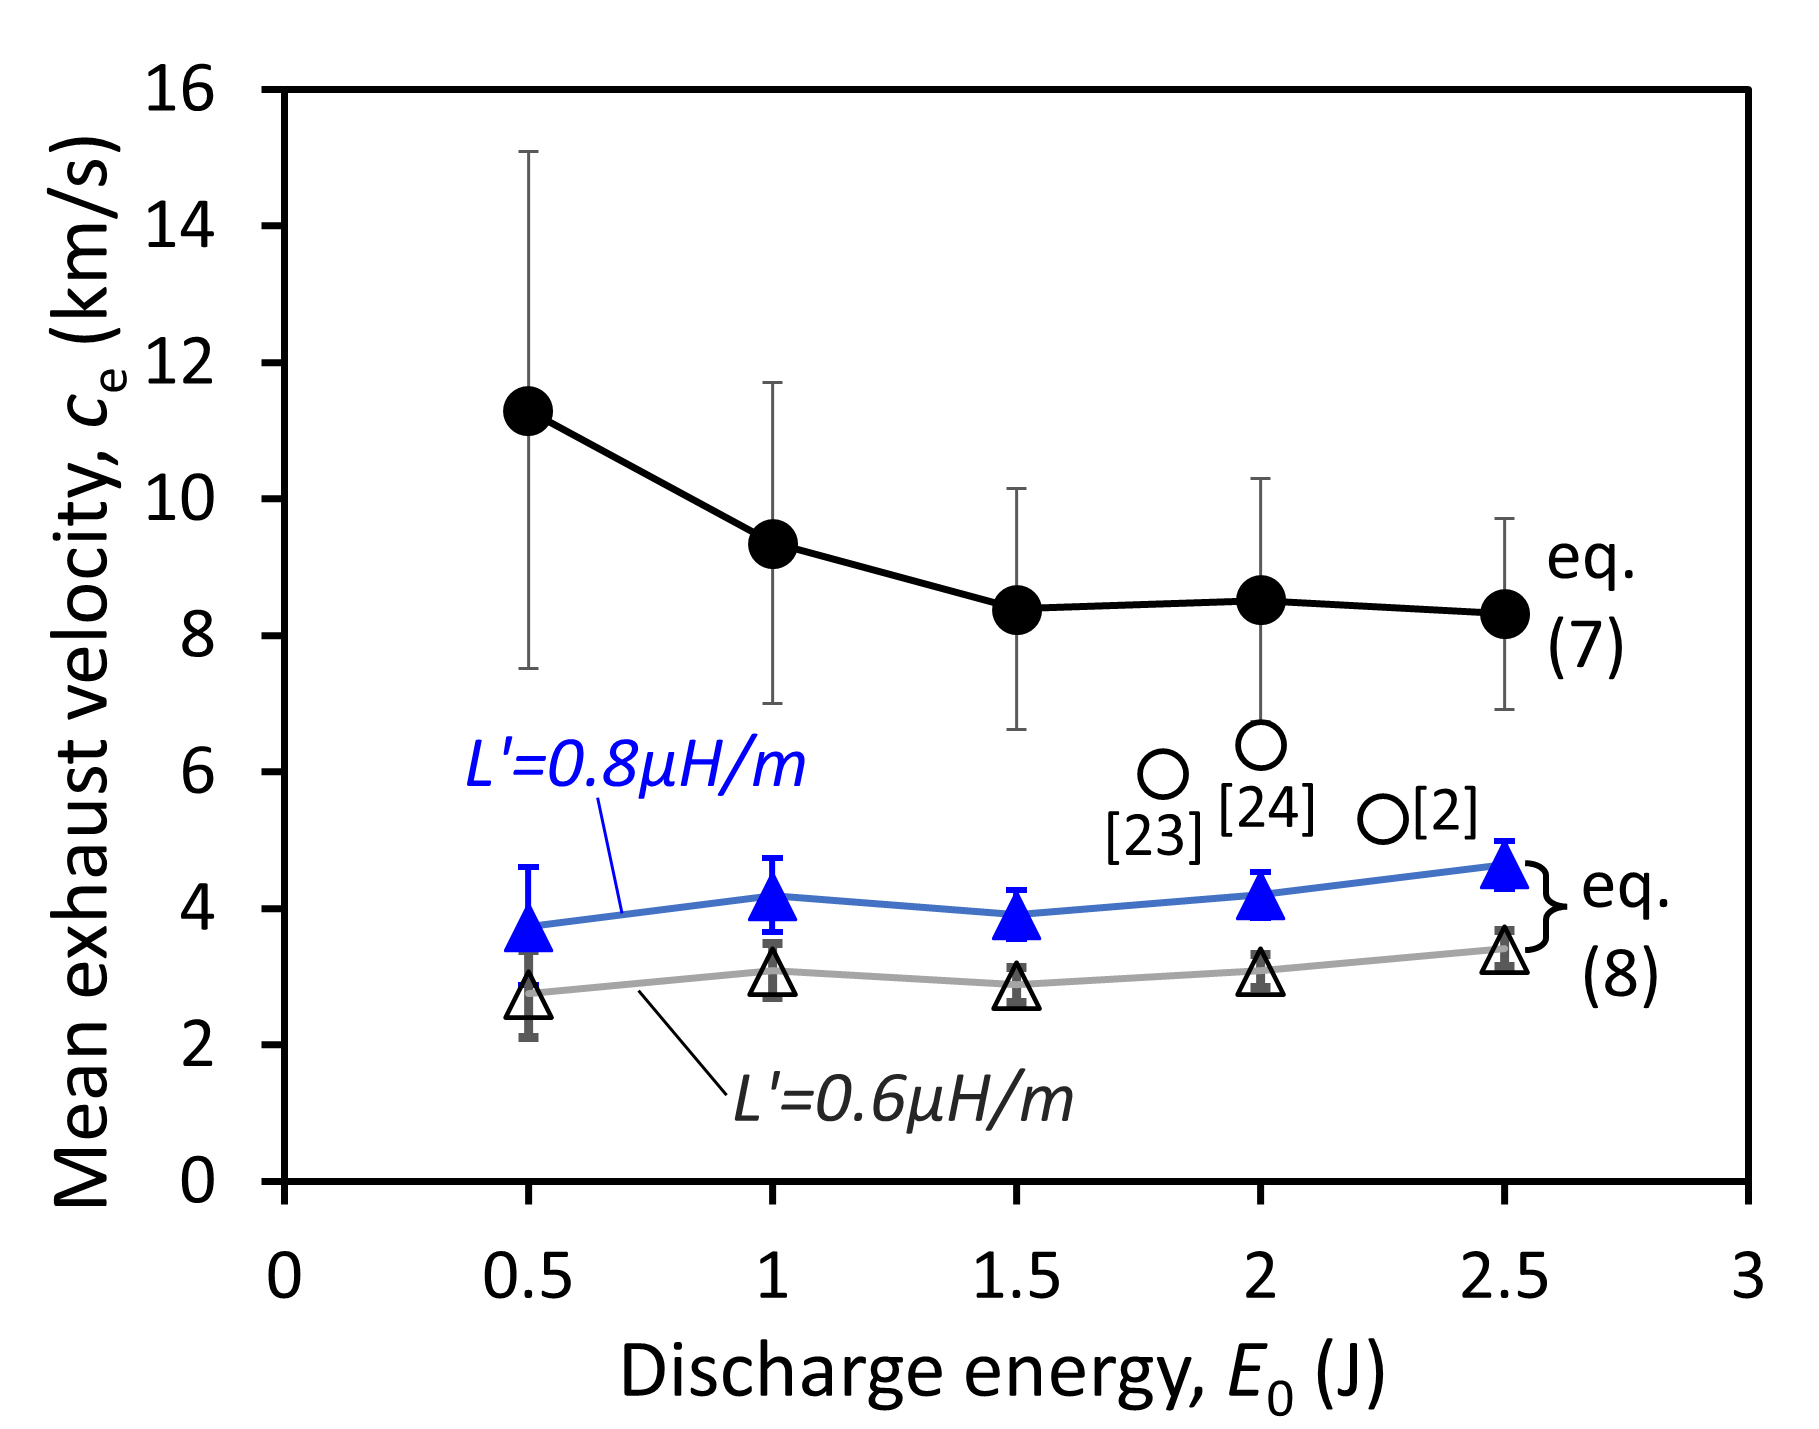
Fig. 11 Mean exhaust velocity (ce) as a function of discharge energy determined from equations (7) and (8).
Download figure:
Standard imageAssuming that the entire mass bit mbit is uniformly accelerated, as in a 'slug' model, and that the change of inductance with axial position (dL/dx =  ) of the plasma layer is also constant, the mean exhaust velocity ce can then be approximated through an alternative expression [18]

The two values of  (0.6 and 0.8 μH/m) are in equation (
3.1.5. 'Fastest' ion velocity
Upon exiting the PPT channel, the plasma plume has been observed to continue accelerating further downstream [30‒32]. In this work, the 'fastest' ion velocity (i.e. velocity of ions at the leading edge of the downstream plasma plume) is determined from the plasma transit time from the PTFE where surface discharge was first initiated to the position of the triple-Langmuir probe placed outside the PPT channel, that is, x
 25 mm, where x = 0 is at the plane of the PTFE propellant and x = 25 mm is at the exit plane of the thruster. Measurements were made up to 30 mm downstream from the exit plane. In the plasma plume of the PPT, there are different ion species with different ionization states (CII, CIII, FII, FIII, etc.). Each species experiences different acceleration due to different mass and charge. The probe current is contributed by all these ions. Thus, instead of using the peak of the probe current for time-of-flight measurements, the arrival time of the fastest ion species was used for the velocity measurement as it is more reliable and yet able to show the changes when discharge energy is varied.
From figure 12(a), all energies show the trend of ion acceleration along the downstream direction. This is evident from the increase in velocity from 71 km/s and 83 km/s at 25 mm to 114 km/s and 145 km/s at 55 mm, respectively, for discharge energy of 0.5 J and 2.5 J (figure 12(b)). The ions appear as if they will continue to accelerate further downstream, but it was not possible to measure beyond x = 55 mm due to the limited size of the vacuum chamber. A similar trend was observed by Ling et al [30]. They recorded a highest velocity of 81 km/s at 140 mm from the exit plane of a 9.8 J PPT. As the discharge energy is increased, the ions in the plasma plume gain higher kinetic energy; hence, the 'fastest' ion velocity increases. The plasma plume of the PPT exiting the thruster channel consists of energetic electrons and multiple species of ions with different ionization energies. The much lighter electrons attain significantly larger velocity and leave the ions behind. This possibly results in ambipolar diffusion, which acts on the ions and accelerates them. Therefore, the velocity of the 'fastest' ion would be higher than the average ion exhaust velocity within the PPT channel. Koizumi et al [29] deduced this value to be 10‒20 km/s from high-speed camera imaging of the C+ emission line of the plasma plume.
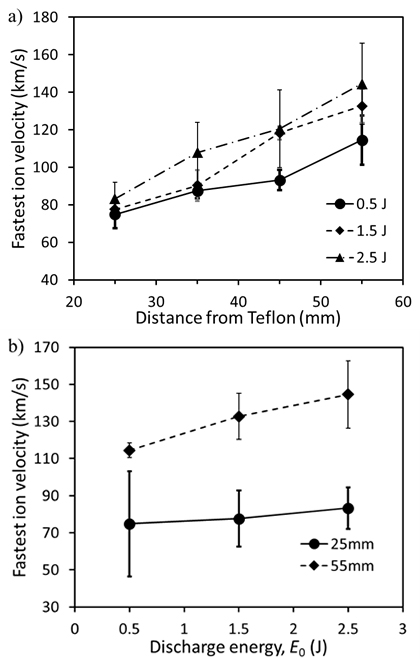
Fig. 12 'Fastest' ion velocity at (a) different distances from the PTFE surface and (b) at different discharge energies.
Download figure:
Standard image3.1.6. Thrust efficiency calculation
The thrust efficiency,  is calculated using a relation that involves only the independently measured impulse bit, mass bit and the discharge energy [26],
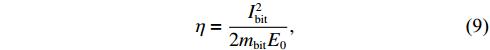
and the approximated expression from the 'slug' model consideration [22],

For equation ( (0.6 and 0.8 μH/m) are used in the calculation and the plots are shown in figure 13. The thrust efficiency calculated from equation (
Fig. 13 Thrust efficiency η of the PPT for discharge energy from 0.5 to 2.5 J. η from similar PPTs of flared electrodes and side-fed propellants are included for comparison.
Download figure:
Standard image3.2. PTFE surface degradation
Evidence of ablation is visible as an eroded area on the propellant surface after 103–105 of discharge firings. The images can qualitatively represent some of the discharge features, such as its structure and strength of the discharge [33, 34]. The 'black' areas are due to charring, possibly due to carbon back flux from the plasma [33]. Figure 14(b) shows that, at 2.5 J, there is an uncharred area (whitish) where the PTFE propellant gets ablated and ejected. The uncharred region is smaller at lower energy, indicating that less ablation has taken place. At the lowest energy of 0.5 J that produced the lowest discharge current, the charring occurred over the entire PTFE surface that faces the discharge. The lighter color tone indicates a least thick charred layer relative to those at the higher discharge energies. This suggests that there is a change in the discharge mechanism or due to incomplete decomposition of PTFE. This is consistent with the lowest ratio of Ibit-em to Ibit as compared to those at a higher discharge energy. Conversely, discharge at higher discharge energy produces higher current, leading to a higher surface temperature of the PTFE propellant bar, thereby enhancing the ablation rate [33, 35].
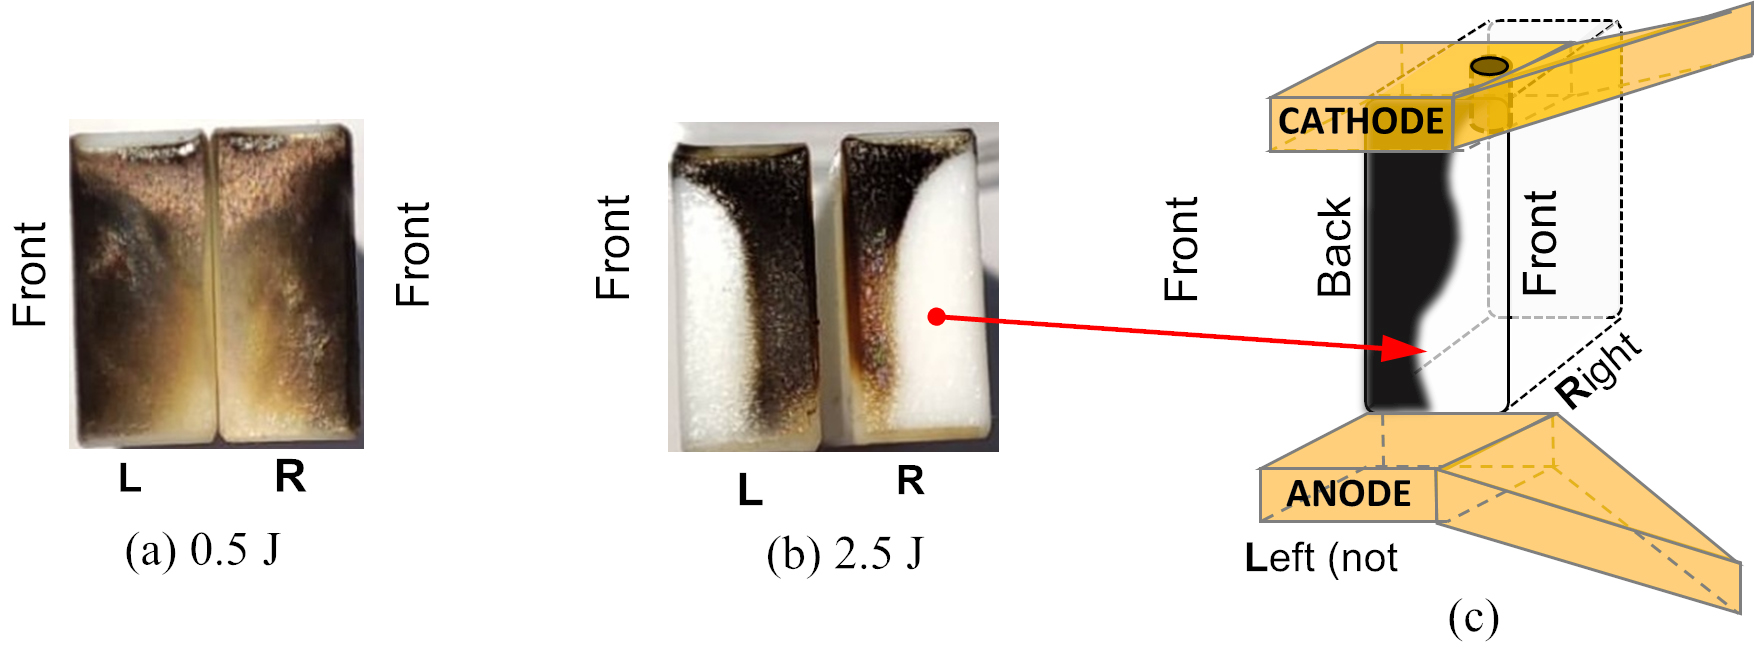
Fig. 14 Discharge-induced surface erosion on the PTFE propellant bar after 1,000 shots fired at (a) 0.5 J, (b) 2.5 J, and (c) placement of the propellant bar (only the right side is drawn) with respect to the electrodes.
Download figure:
Standard imageFigure 15 shows the FESEM imaging of the PTFE surface after 1,000 shots fired at discharge energy of 0.5 and 2.5 J. There is a difference between the images of 0.5 J and 2.5 J, although they are both charred areas (figures 15(b) and (c)). Figure 15(b) shows the globular structure while figure 15(c) shows a non-uniform structure. The EDX spectrum in figure 16(a) shows that the eroded area at 2.5 J contains mainly fluorine (62.14 at%) and carbon (35.88 at%) with a ratio ≈ 2 that corresponds to the stoichiometric ratio of PTFE, (C2F4)n . Oxygen is likely from moisture in residual air in the evacuated chamber or deposition when exposed to air. Figure 16(b) shows that the charred region contains mostly carbon (84.94 at%), followed by fluorine (12.87 at%), oxygen (1.54 at%) and a trace amount of copper (0.65 at%). The presence of a copper peak indicates that copper sputtering occurred during the discharge. This indicates that the copper electrodes are eroded during discharge. The globular structures are similar to those shown by Keidar et al [36] in a 1 and 3 J coaxial micro-PPT. These structures suggest that the carbon char is formed due to carbon deposits from the plasma rather than the incomplete decomposition of the PTFE propellant [33]. It is expected that F ion density exceeds that of C ions in the plasma plume arising from their stoichiometric composition in PTFE. The heavier F ions are less mobile, leading to their lower quantity in the char relative to C ions. Figure 16(c) shows the charred area for discharge energy of 0.5 J. The peaks are similar to those in figure 16(b), but the C/F ratio is lower than the C/F ratio in figures 16(b), 3 and 6.6, respectively. The difference in the ratio could be an indication of the incomplete decomposition of the PTFE propellant at low discharge energy. Together with the differences in FESEM images, this led us to postulate that the discharge mechanism changed when the discharge energy is low.
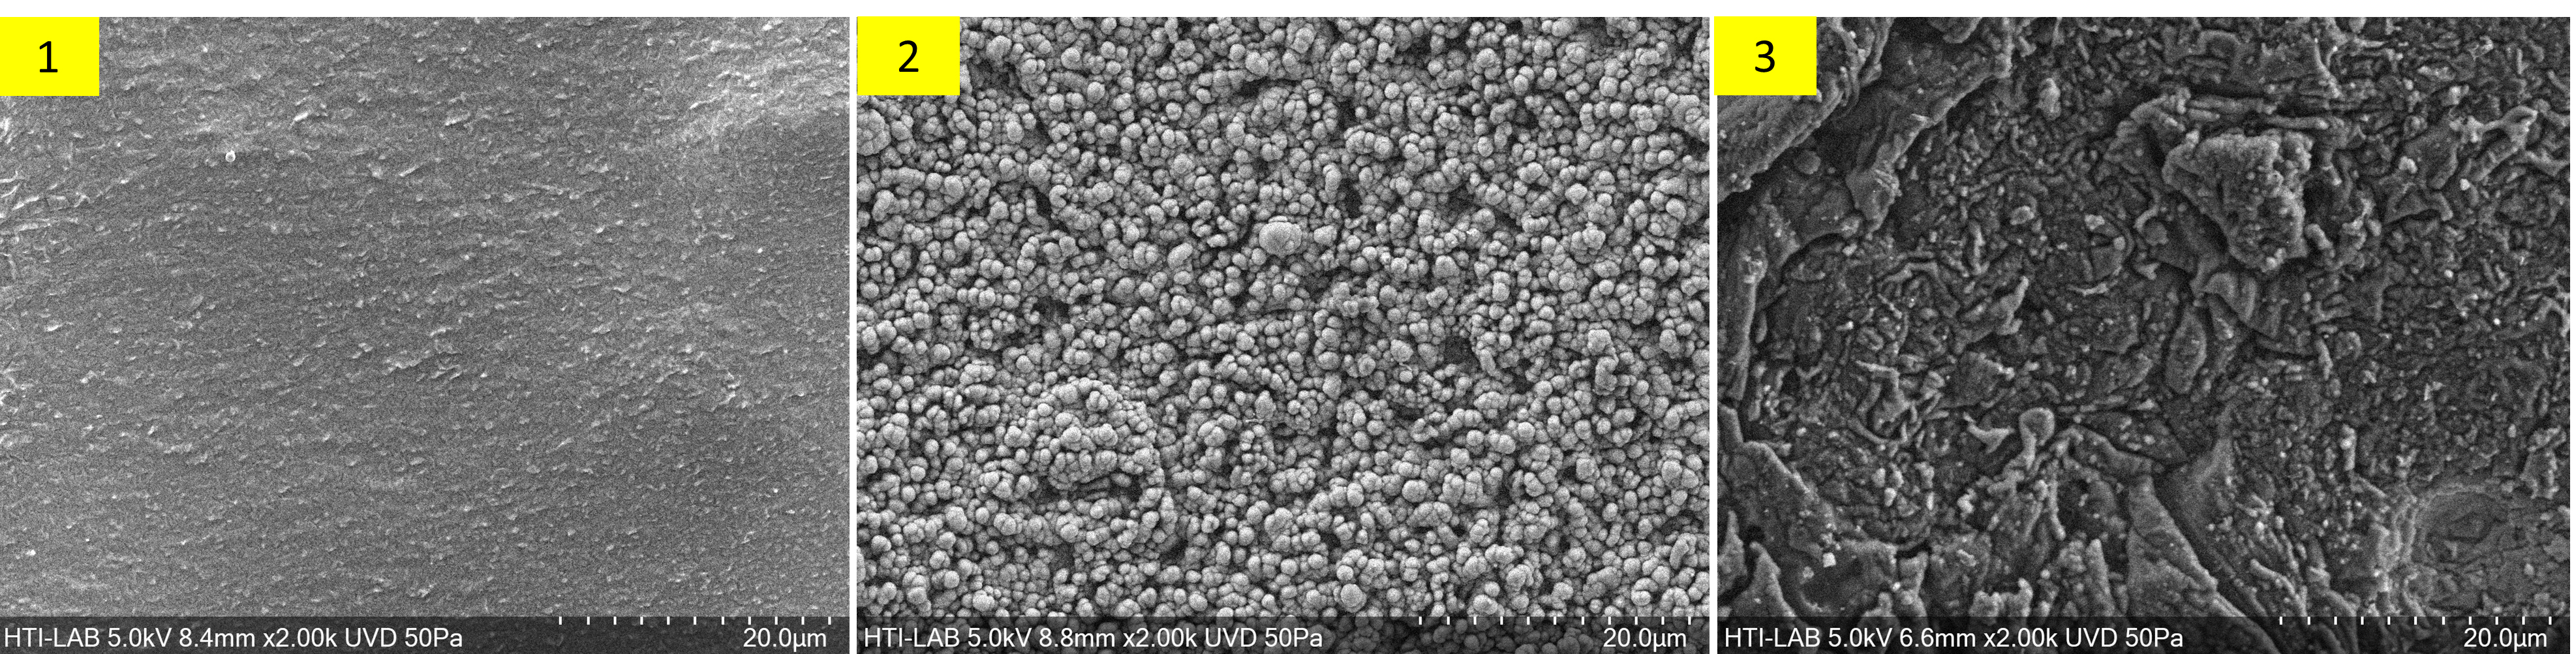
Fig. 15 FESEM image of the PTFE propellant surface at different regions after 1,000 shots fired at 0.5 J and 2.5 J. The respective eroded and charred regions for 2.5 J are marked as (1) and (2), while (3) marks the charred region for 0.5 J.
Download figure:
Standard image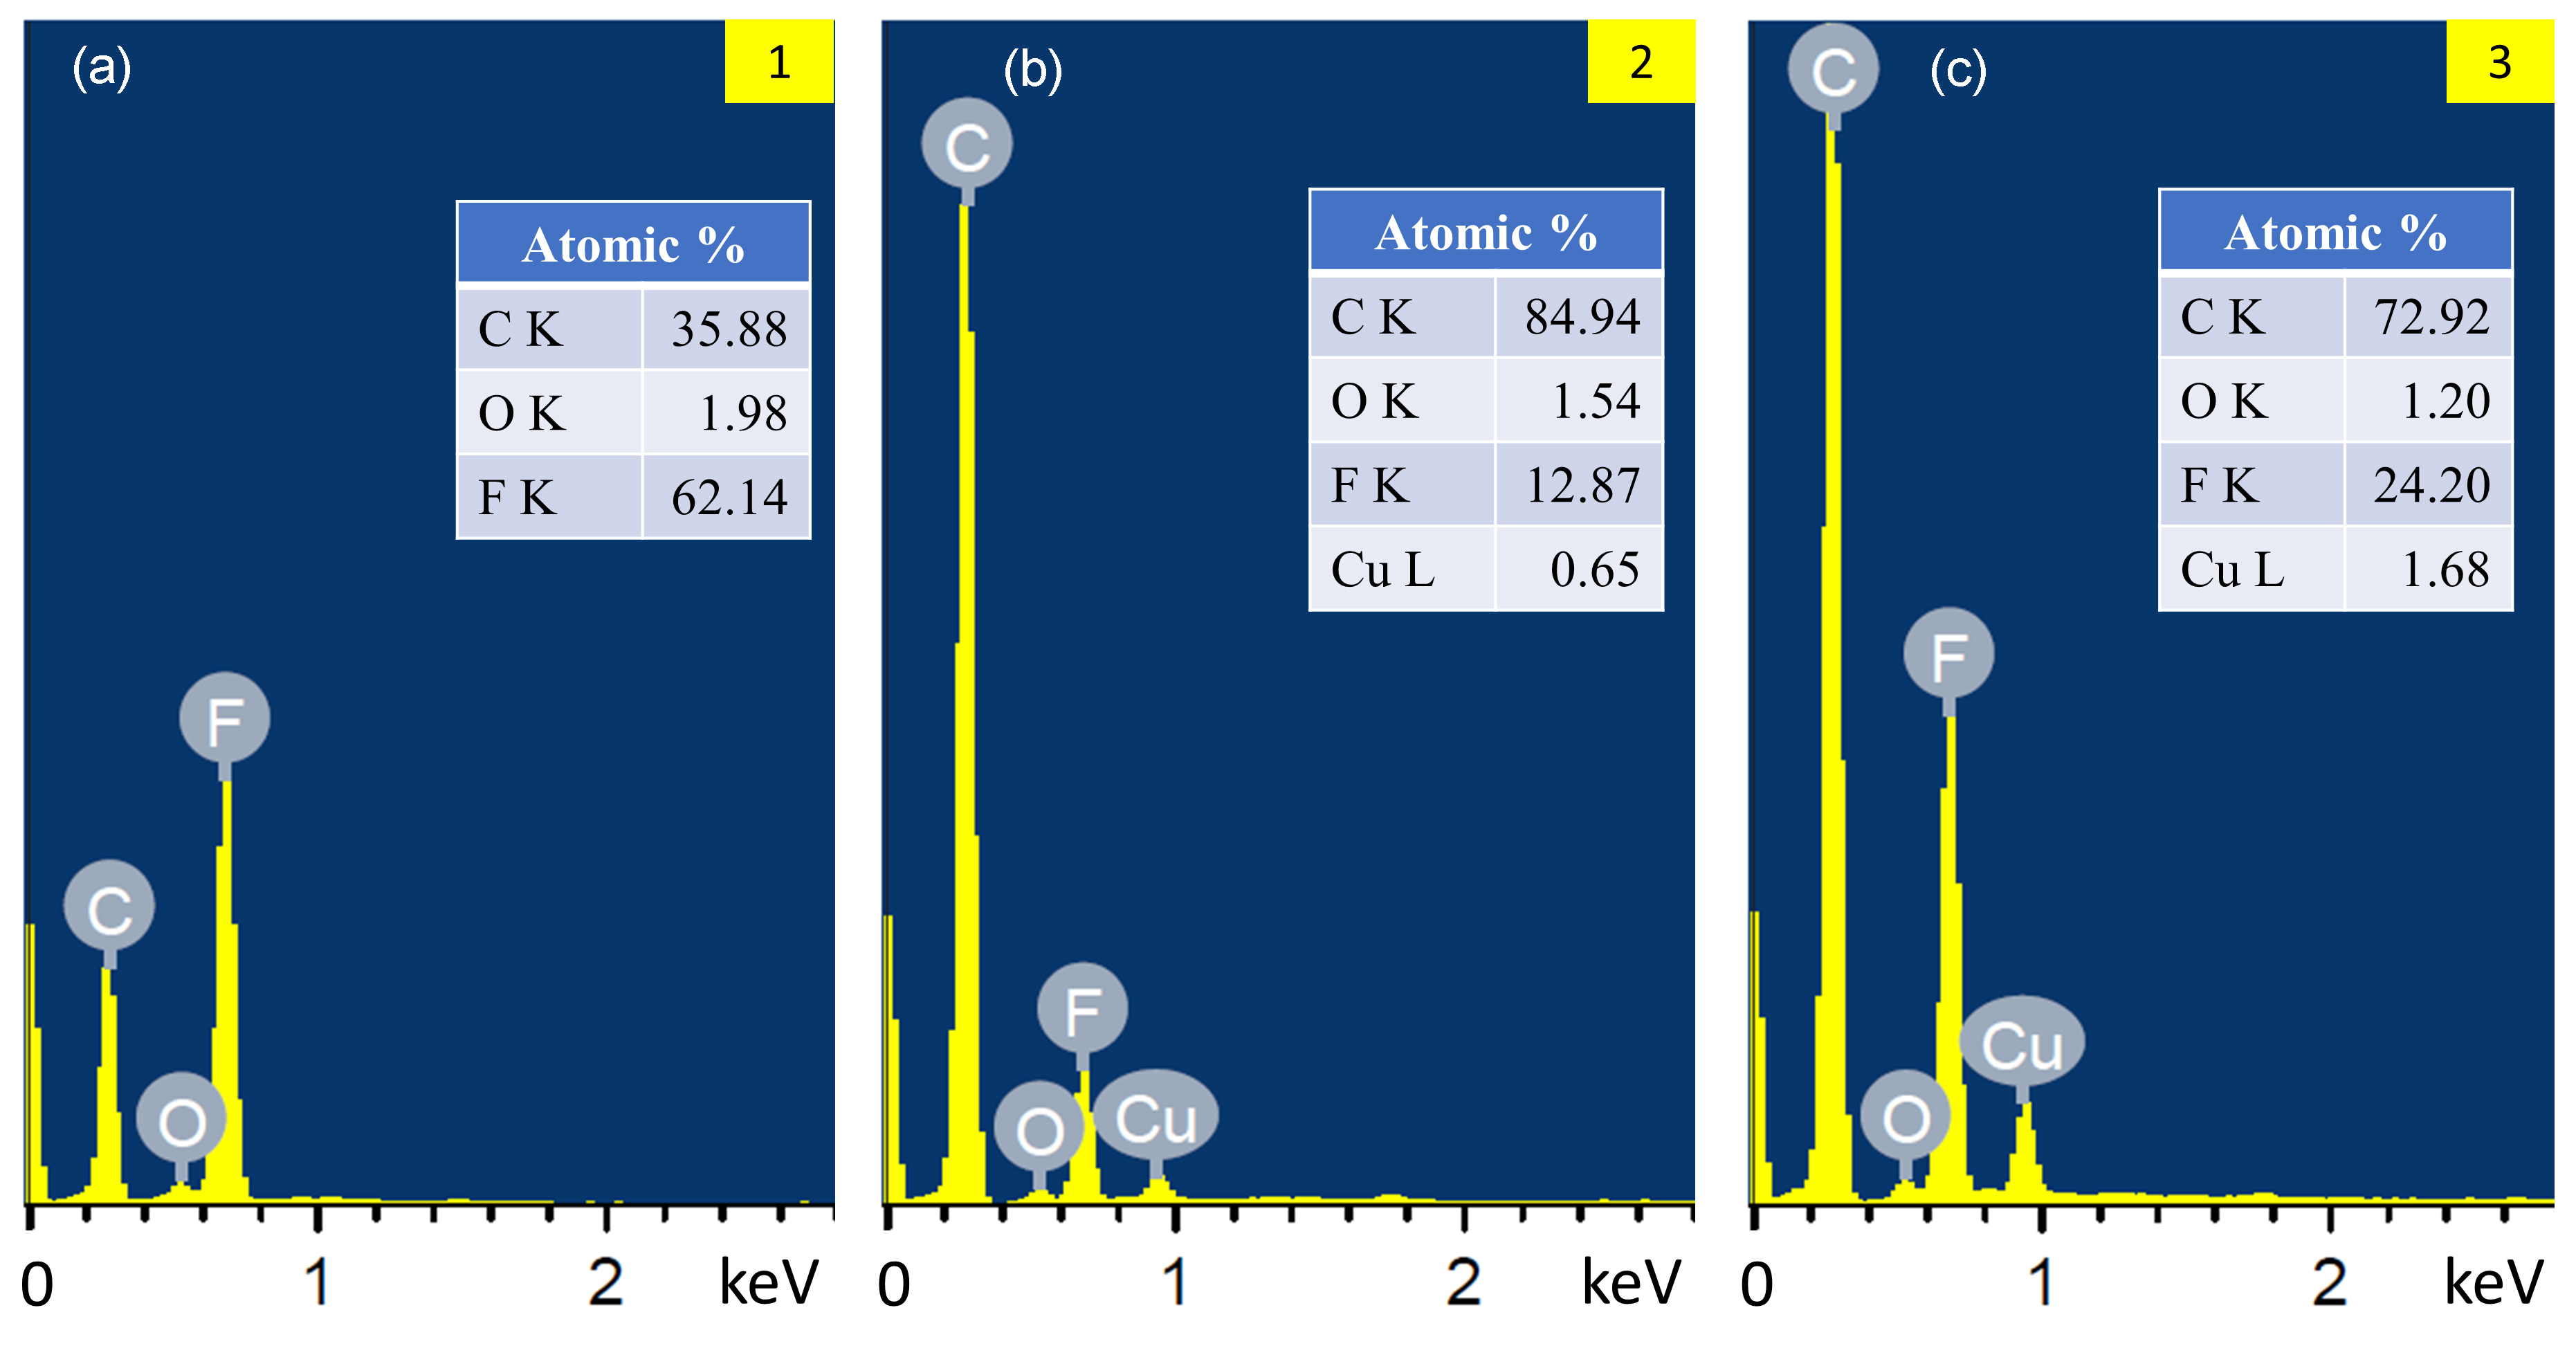
Fig. 16 EDX spectra measured at the sampled regions (a) '1' and (b) '2' and (c) '3' of figure 15.
Download figure:
Standard imageIncreasing discharge energy raises the PTFE surface temperature and leads to enhanced PTFE ablation. It also causes carbon char ablation, hence, preventing char formation. From the partially ablated surface area observed, it is likely that the discharge is not uniformly distributed over the entire exposed propellant surface; that is, heating of the surface is also not uniformly distributed. A simulation by Keidar et al [36] in a coaxial PPT showed that current density peaks near the electrode where the PTFE surface temperature is increased near the electrode led to more PTFE being ablated near the electrode. This is because the ablation rate is exponentially proportional to the surface temperature. Carbon deposition has a significant impact on the lifetime of a thruster because it can cause a short circuit between the anode and cathode. At the boundary between the charred and eroded areas, some tubular structures formed on the surface. It is speculated, albeit inconclusively, that formation of these structures might be aided by the interplay of forces arising from plasma dynamics and the carbon back flux during the discharge.
4. Conclusions
Within the low discharge energy (E0) range of 0.5‒2.5 J of a tongue-flared PPT, the impulse bit Ibit increased more slowly at a specific impulse bit of 17 μNs/J than that of PPTs at higher energies. The EM component (Ibit-em) that contributes to the Ibit was about 50% for E0 of 1‒2.5 J when a higher change in inductance with position ( ) with the tongue-flared electrodes was considered and dropped to 33% at 0.5 J. These values are higher than those reported in similar PPTs at 1.6‒2 J. Especially, the derived values of specific impulse Isp were 2–3 times higher at E0/A < 2 J/cm2 than those predicted by the semi-empirical formula by Gessini-Paccani. This is possibly due to a change in the discharge mechanism at lower discharge energy. Likewise, the mean exhaust velocity, ce, as well as the thrust efficiency, η, both derived using values of mbit, also demonstrated a higher value, especially at the low end of the discharge energy range and albeit with large uncertainties (60%–70% at 0.5 J), and decrease with increasing discharge energy, which is contrary to intuition. At discharge energy around 2 J, ce and η were closer to the values published in the references [2, 23, 24]. Using another method (independent of the measured mbit) that employed the triple-Langmuir probe to determine the 'fastest' ion velocity at the downstream locations external to the PPT channel, this velocity increased with increasing discharge energies at the exit plane of the PPT channel, which is to be expected. Although the 'fastest' ion velocity is not equal to the mean ion exhaust velocity and the mean exhaust velocity, the trend can still be representative of that in the mean exhaust velocity. This seemingly contradicts the trend observed for ce. The increase of 'fastest' ion velocity with distance downstream indicates that the ions were accelerating outside the PPT channel, possibly aided by ambipolar diffusion. Analyzing the elemental component of charring on the propellant surface, the highest proportion was C (85 at%), followed by F (13 at%) with traces of Cu from the electrodes. The globular structures and the EDX spectrum suggest that char was formed from carbon back flux from the plasma rather than incomplete decomposition of the propellant. Compared to published data (gathered from various PPTs of 1.8–8.5 J with tongue-flared, rectangular-flared and plane-parallel electrodes), a wider spread in values of Isp and η at the low-energy end could be seen. In other words, higher inconsistency of some performance parameters of the PPTs is likely to occur here, similar to our observation. This could be due to a weaker discharge that did not get distributed over the entire exposed surface of the propellant and relatively 'excess' charring that led to a smaller mass bit being measured.