


Abstract
Cancer is a disease of cell cycle, characterized by uncontrolled cell division. The tumor suppressor gene p53 plays a major role in cell cycle control, blocking the cell progression at G1/S phases. In triple negative breast cancer (TNBC), the lack/mutation of p53 is a common genetic irregularity that promotes survival signals leading to tumorigenesis. Due to its unique molecular profile, aggressive behavior, and metastasis, no targeted therapies exist for TNBC. This motivates our exploration of the influence of Electro-Curcumin-Therapy on the viability, cell cycle and p53 expression profile of TNBC cells. MDA-MB-231, human TNBC cells were treated with curcumin and eight 200 V cm−1 electric pulses (EPs) of either 100 μs or 5 ms duration. The synergy of 5 ms EPs and curcumin reduced viability to as low as 6% at 48 h after treatment. Combining the 100 μs EPs with curcumin arrested 80% cells in the G0/G1 phase. Applying 5 ms EPs with curcumin caused cells to shift from the G2 phase (9% reduction) to the S phase population (21% increase) compared to control. Combining 100 μs EPs with curcumin significantly downregulated the p53 level, while the p53 level significantly increased for 5 ms EPs with and without curcumin. These results indicate the potent effect of combining EPs and curcumin to effectively cause cell death in TNBC cells with different mechanistic behaviors, while having a much-reduced impact on cell death in normal mammary cells.
Export citation and abstract BibTeX RIS
Introduction
Since cancer is characterized by the loss of cell cycle regulation, the ability to control the cell cycle is an effective treatment strategy [1]. Several anti-cancer drugs have been designed to target specific phases of the cell cycle to preclude toxicity and drug resistance while improving clinical outcomes in various cancers [2]. However, there is an unmet need for triple negative breast cancer (TNBC) treatment, which do not express three receptors commonly targeted by treatments: the estrogen receptor (ER), the progesterone receptor (PR) and epidermal growth factor receptor 2 (HER2/Neu). An aggressive and metastatic sub type with low 5-year survival rates, high 3-year recurrence rates [3, 4], and lack of targeted therapies due to its unique molecular profile [5], TNBC contributes to 15%–20% of total breast cancers [6].
Recent reports have also suggested that the tumor suppressor gene p53 (TP53) is mutated in ∼80% of basal/TNBCs, impairing the regular function of p53 such as cell cycle control, DNA repair, and apoptosis [7, 8]. The mutation in p53 does not only abrogate the tumor suppressor function of the cells, but also causes new oncogenic activities to promote tumorigenesis through either a dominant-negative or a gain-of-function mechanism [9–11]. Emerging evidence suggests that compared to the expression of wild-type p53, the expression of mutant p53 is significantly elevated in TNBC, which interferes with default stress-induced apoptosis to promote survival signals leading to tumorigenesis [12, 13]. Therefore, targeting the mutant p53 or reactivating wild-type p53 in tumor cells using therapeutics can be an effective strategy against TNBC [11, 14, 15]. This motivated our study of MDA-MB-231, human TNBC cells, which have mutated p53. MDA-MB-231 is resistant to multiple commonly used chemotherapeutics (cisplatin, paclitaxel, and doxorubicin) [16], and is a standard in vitro model of highly invasive TNBC.
We used curcumin in the present study, as we had started investigating a number of commonly administered drugs, including tamoxifen, paclitaxel, doxorubicin, bleomycin, cisplatin, gemcitabine, and veliparib [17–20] using electric pulses (EPs) and various breast cancer cells since 2007. We have recently started studying curcumin due to its excellent anti-cancerous, anti-oxidant, and anti-bacterial qualities, as well as its effectiveness for treating several chronic conditions, including cancer [21]. Curcumin, a polyphenol, is the principal component of the herb turmeric (Curcuma longa), which has been used in medicine and cooking in India, China, and other Asian countries for over 4000 years [22]. Curcumin lacks the harsh side effects of many commonly administered chemotherapeutics for breast cancer [23]. Curcumin can target multiple pathways to modulate multiple receptors, growth factors, inflammatory cytokines, kinases, enzymes, and transcription factors to suppress initiation, progression, and metastasis of a variety of tumors [22, 24]. Curcumin inhibits cell cycle progression and induces apoptosis in multiple breast cancer cells, including triple negative breast cancer (TNBC), by downregulating NF-κB, Wnt/ß-catenin and their downstream targets, while increasing Bax to Bcl-2 ratio [25–27]. Curcumin can also result in the downregulation of mutant p53 levels to induce apoptosis and cell cycle arrest in TNBC cells [26, 27]. Therefore, curcumin can induce multiple signaling pathways to target TNBC, which motivates the current study to investigate the effect of herbal curcumin on TNBC cells with p53 mutation.
Since cancer is a multifactorial disease, we used electrical pulses (EPs) of various durations to enhance curcumin uptake to target multiple factors. This local application of short duration, high-intensity EPs across the cell membrane results in charge accumulation that increases the transmembrane potential (Vm). When Vm increases beyond the threshold (∼250 mV to 1 V) across its 5 nm thickness, there is a several-fold enhancement of electric field (100 MV cm−1), leading to pore formation [28, 29]. This phenomenon is called electroporation and can enhance the uptake of external molecules by up to 1000 times [30]. To estimate the steady-state applied electric field, E (V/cm) necessary to achieve Vm = 1 V for electroporation in a spherical cell at a 0° polar angle, one can modify the first-order Schwan's equation [31] to obtain

where, R is the cancer cell radius (cm). Since  smaller cells require larger applied electric fields for membrane pore creation. Therefore, applying the same E to cells in different phases of the cell cycle will induce different membrane effects since the cell radius varies during the cell cycle [32]. Thus, appropriate selection of EP parameters permits phase specific manipulation of the cell cycle.
When EPs are applied to facilitate the uptake of chemotherapeutics, this non-surgical procedure is called electrochemotherapy (ECT). ECT is gaining momentum as an alternate modality for advanced, inoperable, radiation and chemo-resistant tumors, including cutaneous and subcutaneous metastases, in Europe [33]. The effect of ECT treatment is limited to the local electric field region, minimizing collateral damage to the surrounding tissue, because  where r is the distance away from the application site. ECT is effective, safe, affordable, outpatient based, applicable to all types of solid tumors, and rapid in execution (a few minutes per nodule).
Increasing evidence suggests that electroporation cannot be merely dismissed as a physical phenomenon that forms pores in the cell membrane, since EPs may manipulate other biophysical mechanisms. Zhao et al, recently reported that EPs can extensively affect multiple cellular processes such as cytoskeleton dynamics, protein synthesis, nucleic acid stabilization, inflammation, and apoptosis (programmed cell death) [34]. They also reported that the variation in cellular proteins and pathways under electrical stimulation depends upon the EP parameters and differ from a pure physical hurt response [34]. Previous studies in cancer model systems revealed that EPs can affect multiple proteins to instigate distinct mechanisms to induce cancer cell death [35–40]. Many studies have shown that EPs can also alter p53 expression and influence signaling [41–44]. However, to the best of our knowledge, no study has investigated the effects of EPs on the p53 levels in cells harboring p53 mutations, which we explore in this study.
Conventionally, eight 100 μs duration EPs at 1200 V cm−1 at 1 Hz repetition rate are used for ECT [33, 45, 46]. However, this study explores the effect of various combinations of non-invasive, low-voltage EPs (200 V cm−1) with natural phytochemical curcumin on the viability, cell cycle and p53 expression profile of MDA-MB-231 cells, a TNBC cell line with high levels of mutant p53. We selected low-intensity EPs since recent studies reported that combining non-invasive, low-intensity EPs (as low as 60 V cm−1) with chemotherapeutics can effectively treat cancer without severe inflammatory reactions [47]. While we previously applied ultra-microsecond (10 μs) 2500 V cm−1 and 5000 V cm−1 EPs to MDA-MB-231 cells in suspension [48], the present study examines the application of non-invasive and low-intensity 200 V cm−1 EPs (∼1/25th times lower) to plated/adherent MDA-MB-231 cells in situ, which more closely mimics the in-vivo condition.
Methods
Cell preparation
Human adenocarcinoma epithelial TNBC cells MDA-MB-231 (ATTC®), and non-cancerous epithelial cells, MCF10A (ATTC®) were used. The MDA-MB-231 cells were cultured as a monolayer in DMEM (Gibco™, USA) with 10% FBS and 1% Penicillin-Streptomycin. The MCF10A cells were cultured in a 1:1 ratio of DMEM:Ham's F12 supplemented with 5% horse serum (HS; Atlanta Biologicals), 20 ng/ml human epidermal growth factor (Sigma-Aldrich, USA), 0.5 mg/mlhydrocortisone (Sigma-Aldrich), 100 ng/ml cholera toxin(Sigma-Aldrich), 10 µg/ml bovine insulin (Sigma-Aldrich), 100 IU/ml penicillin and 100 µg/ml streptomycin. The cells were incubated at 70%–80% humidity, 5% CO2, and 37°C. They were trypsinized and centrifuged for 5 min at 1000 rpm and 4 °C and resuspended in fresh media for treatment.
Electric pulse application
We used a BTX ECM 830 Electroporator (Genetronics Inc., USA) to apply eight square wave unipolar 200 V cm−1 EPs at 1 Hz repetition rate with 100 μs or 5 ms EP duration. We used NEPA21 electrodes (NepaGene, Japan) to apply EPs to adherent cells incubated in a 24-well plate (1.5 × 10⁵ cells/well) with a gap of 1 cm, yielding an applied electric field of 200 V cm−1. Figure 1 shows the experimental setup.
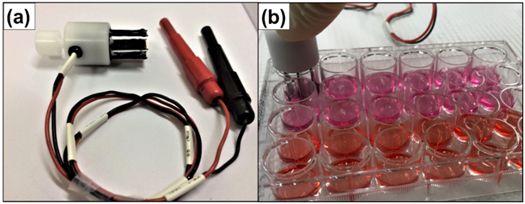
Figure 1. (a) NEPA21 electrode. (b) Experimental setup for adherent cell electroporation in a 24-well culture plate.
Download figure:
Standard image High-resolution imageDosage study and real-time cell viability assay
For the curcumin dosage study, cells were seeded in 96-well plates (10 × 103 cells/well) and allowed to attach for 24 h. The spent media was replaced with media containing curcumin (Sigma-Aldrich) at appropriate concentrations for treatment. The control was not treated (NT control) and the vehicle control (control) had media containing dimethyl sulfoxide (DMSO).
To assess viability after EPs, we seeded the cells and allowed them to attach for 24 h. We treated the cells in media containing 50 μm curcumin with or without EPs. Controls and EP only treatments had media containing DMSO.
The above cells were incubated for 24 h and RealTime-GloTM reagent (Promega, USA) was added to assess the viability at 24 h and 48 h, as per the manufacturer's protocol. Luminescence (Lum) was measured for 1 s integration time using a SpectraMaxM5 multiplate reader (Molecular Devices, USA). Experimental Lum was normalized with control Lum to determine viability at 24 h or 48 h using
Cell cycle assay via flow cytometry
Cells were incubated in 24-well plates (1.5 × 10⁵ cells/well) for 24 h, followed by spent media replacement with serum-free media for 24 h to synchronize cell cycle. Following synchronization, cells were treated in fresh media containing 50 μm curcumin with or without EPs. Controls were treated with either serum-free media as a positive control or media containing the vehicle, DMSO. The EP-only controls were treated with media containing DMSO (control) and EPs. After 36 h of treatment, media was aspirated, and the cells were washed with PBS. The cells were then incubated in trypsin-EDTA containing 100 μg mL−1 DNase I (Worthington, USA) for 10 min, and then collected. The samples were centrifuged at 2,000 rpm for 5 min and the supernatant was drained. The cells were washed and resuspended in PBS containing 2.5 mM EDTA (1xPBS-EDTA), fixed by adding drop-wise into fresh ice-cold 70% ethanol, and stored at −20˚C until staining. For staining, fixed cells were centrifuged at 2000 rpm for 10 min and the supernatant was discarded. Cells were then washed with 1xPBS-EDTA, resuspended in Muse® Cell Cycle Reagent (EMD Millipore, USA) containing propidium iodide (PI) and RNaseA, and stored at room temperature for 30 min Stained cells were run on a CytoFLEX (Beckman Coulter, USA) flow cytometer. Cells in different cell cycle phases were quantified using FCS Express software.
Immunoblotting of p53
The MDA-MB-231 cells were seeded at 1 × 10⁵ cells/well in 24-well plates and allowed to attach for 24 h. Cells were then treated for 24 h in fresh media containing 50 μm curcumin or DMSO (control) with or without EPs. Treated cells were collected in RIPA buffer and sonicated to obtain lysates. Cell lysates were centrifuged at 14000 rpm to clear debris and the protein concentration in the lysates was estimated via the bicinchoninic acid (BCA) assay. A total of 15 μg of protein from each sample was mixed with 5 × sample buffer and were boiled to denature proteins. The denatured protein samples were subjected to SDS-polyacrylamide gel electrophoresis, transferred onto a polyvinyl difluoride (PVDF) membrane, and immunoblotted. The PVDF membrane was blocked overnight at 4 °C with 5% w/v nonfat dry milk, before probing for the proteins using primary antibody for P53 (Cell Signaling Technologies) and β-tubulin (Developmental Studies Hybridoma Bank, University of Iowa). We used ImageJ for densitometric quantification.
Statistical Analysis
Statistical significance for the dosage study and cell viability assays used Repeated Measure Analysis of Variance (ANOVA), followed by Tukey's test for multiple comparison. The Tukey's test tags each treatment with a single letter ('A') or a group of letters ('AB'). Treatments represented by the same or common letters indicate that they are not significantly different. Different letters indicate that the treatments are significantly different (p < 0.05). For example, if treatment 1 is 'A', treatment 2 is 'B', and treatment 3 is 'AB', treatments 1 and 2 are significantly different since they have different letters, but treatment 3 is not significantly different from ether 1 or 2, since it shares letter 'A' with treatment 1 and 'B' with treatment 2.
Statistical significance for cell cycle assay and p53 expression was derived using Student's unpaired two-tailed t-test. Prior to statistical analysis, the data was log transformed to satisfy normality and homoscedasticity assumptions. The statistical package JMP® was used to perform statistical analysis. Experiments were performed in triplicates and data reported as mean±SE, where SE is the standard error.
Results
Dosage study and real-time cell viability assay
Figure 2(a) shows the curcumin dosage curve for MDA-MB-231 cells at 24 h and 48 h. The viabilities were normalized with no treatment control (NT control) viability at 24 h or 48 h (100%).
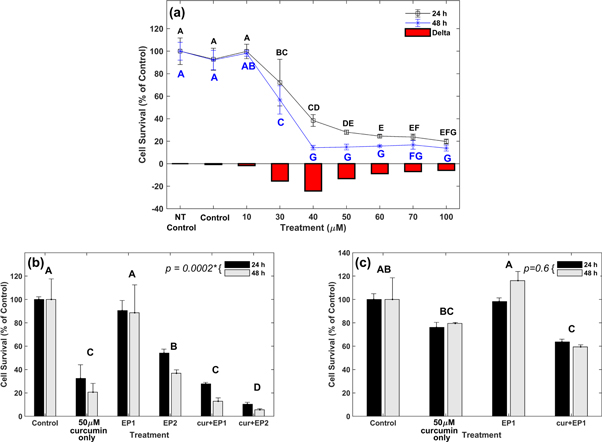
Figure 2. Cell viability at 24 h and 48 h (a) MDA-MB-231 under various curcumin concentrations. Delta represents the viability drop at 48 h from 24 h. Veh denotes media containing dimethyl sulfoxide (DMSO). (b) MDA-MB-231 under different electric pulse (EP) treatment conditions. (c) MCF10A under different treatment conditions. The EP 1 and EP 2 denote the application of eight 200 V cm−1 EPs at 5 μs and 100 ms, respectively. Results are based on experiments performed in triplicate with error bars calculated using standard error.
Download figure:
Standard image High-resolution imageThe viability for DMSO treated samples (control) was 93% and 92% at 24 and 48 h, respectively. The DMSO treatment caused only a minimal reduction of 7%–8% in viability, compared to NT control. A 10 μM curcumin dosage resulted in 99.8% and 98.2% viability at 24 and 48 h, respectively. Applying a curcumin concentration of 30 μM resulted in 72% viability at 24 h and a reduction to 57% at 48 h. Applying 40 μM curcumin concentration induced a sharp reduction in viability to 38% and 14% at 24 h and 48 h, respectively. A curcumin concentration of 50 μM resulted in 28% and 15% viability at 24 h and 48 h, respectively. The viability reduction at 24 h was 10% for a 10 μM increase in the curcumin concentration from 40 μM to 50 μM. The cell viabilities were 24.5%, 23.7%, and 20% at 24 h, and 16%, 17%, and 14% at 48 h for 60 μM, 70 μM, and 100 μM curcumin, respectively. Increasing concentration beyond 50 μM caused only a limited viability reduction, as the reduction was 8% for two-fold dosage increase from 50 μM to 100 μM, indicating nonlinear saturation. This was corroborated by the statistical results.
Table 1 shows that the F-test indicates that all fixed effects are statistically significant (P < 0.05). The statistical significance of the interaction effect ('TreatmentxTime') indicates that the simultaneous influences of 'Treatment' and 'Time' on cell viability were not additive; therefore, only the interaction effect was subjected to Tukey's test.
Table 1. Fixed Effect F-test details for dosage study after 24 h and 48 h (*indicates P < 0.05).
| Source | Mean square (MS) numerator | Degree of freedom (DF) numerator | F Ratio | Prob > F |
|---|---|---|---|---|
| Treatment | 3.17 | 8 | 33.59 | <.0001* |
| Time | 1.25 | 1 | 93.43 | <.0001* |
| TreatmentxTime | 0.16 | 8 | 11.94 | <.0001* |
The Tukey's test letter report in figure 2(a) indicates no significant difference between NT control, control, and 10 μM curcumin samples at 24 h or 48 h (share letter 'A'). Treatments with curcumin concentration greater than 10 μM are significantly different from control at 24 h and 48 h, since (do not share any common letter. Treatments at 40 μM and 50 μM are not significantly different at 24 h (share letter 'D') and 48 h (share letter 'G'). There is a significant difference between 40 μM and curcumin concentrations of 60 μM and greater at 24 h, since they do not share any letter. However, there is no significant difference among 50 μM, 60 μM, 70 μM, and 100 μM curcumin treatments at 24 h (share letter 'E') and 48 h (share letter 'G').
Figure 2(b) shows the cell viability under various sample conditions: DMSO control (control), 50 μM curcumin only, eight 100 μs, 200 pulses (EP1), eight 5 ms, 200 V cm−1 pulses (EP2), 50 μM curcumin + EP1 (cur + EP1), and 50 μM curcumin + EP2 (cur + EP2). All viabilities were normalized with the viability of 24 h or 48 h control (100%), respectively. The viability for EP1 was 90% and 89% at 24 h and 48 h, respectively. The viability for EP2 was 54% at 24 h, and 37% at 48 h. The viability of the curcumin only sample was 32%, and 21% at 24 h and 48 h, respectively. The synergy of EPs with curcumin increased cell cytotoxicity. The cur + EP1 treatment reduced viability by 72% at 24 h and 88% at 48 h from respective control samples. In comparison, curcumin alone induced only a 67% and 79% decrease in the viability from control samples 24 h and 48 h, respectively. Increasing the pulse duration to 5 ms for cur + EP2 increased the cytotoxic effect, reducing the cell viabilities to 10% and 6% at 24 h and 48 h, respectively. This indicates a highly nonlinear response, as could be expected in biological effects. A sustained reduction in viability was observed at 48 h for all treatments (curcumin only, EP2, cur + EP1, and cur + EP2) with the viability decreasing between 5% and 17% from 24 h to 48 h.
Table 2 summarizes the F-test on Fixed effects. The P-values for 'Treatment' and 'Time' are 0.0005 and 0.0002, indicating significance (P < 0.05). The significance in 'Time' indicates that viabilities at 48 h are significantly different from viabilities at 24 h. The P-value for 'Time×Treatment' interaction is 0.0590, indicating that the 'Time' and 'Treatment' are not crossed, but are additive.
Table 2. Fixed effect F-test details for the MDA-MB-231 cell viability at 24 h and 48 h.
| Source | Mean square (MS) numerator | Degree of freedom (DF) numerator | F Ratio | Prob > F |
|---|---|---|---|---|
| Treatment | 5.37 | 5 | 12.28 | 0.0005* |
| Time | 1.22 | 1 | 30.85 | 0.0002* |
| TreatmentxTime | 0.124 | 5 | 3.13 | 0.0590 |
Note: *indicates P < 0.05.
The Tukey's test was conducted on the 'Treatment' effect to determine the significance among the treatment methods. Tukey's test letter report in figure 2(b) indicates that EP1 does not differ significantly from the control (same letter 'A'). The curcumin only (letter 'C') is significantly different from the control, EP1 (letter 'A'), and EP2 (letter 'B'). The cur + EP1 (letter 'C') is significantly different from the control, EP1, and EP2, but not from curcumin only (same letter 'C'). The cur + EP2 (letter 'D') is significantly different from all other samples, indicating the potency of this combination in causing major cell death.
Since in vivo EP treatments will involve both healthy and cancerous cells, we assessed the viability of a non-cancerous, epithelial cell line, MCF10A, using the same combination of EPs and 50 μM curcumin. Figure 2(c) shows that the MCF10A viability was much higher than the MDA-MB-231 viability (figure 2(b)). The viability of MCF10A cells for curcumin only treatment was 76% at 24 h, and increased to 79% at 48 h. These viabilities were not statistically significantly different from the control viability, indicating that the curcumin treatment does not significantly reduce the viability of MCF10A cells even at 48 h (share letter 'B'). The viability of the EP1 sample was 98% and 116% at 24 h and 48 h, respectively, which was not significantly different from control (share letter 'A'). The viability for the combination of eight 200 V cm−1 EPs at 100 μs with 50 μm curcumin (cur + EP1) was 64% and 59% at 24 h and 48 h, which was significantly different from the viability of control and EP1.
The ANOVA results reported in table 3 indicate that the effect of 'Time' was not significant for MCF10A cell treatment. Therefore, regardless of treatment modality, the viability of MCF10A cells at 48 h was not significantly different from the MCF10A viability at 24 h (Time effect: p = 0.6 in table 3).
Table 3. Fixed effect F-test details for the MCF10A cell viability at 24 h and 48 h.
| Source | Mean square (MS) numerator | Degree of freedom (DF) numerator | F Ratio | Prob > F |
|---|---|---|---|---|
| Treatment | 0.37 | 3 | 14.44 | 0.0014* |
| Time | 0.0045 | 1 | 0.298 | 0.6000 |
| TreatmentxTime | 0.016 | 3 | 1.07 | 0.4131 |
Note: *indicates P < 0.05.
Cell cycle assay
Figure 3(a) shows cell cycle patterns that represent the G0/G1, S, and G2 phases of the cell cycle for different treatments. The quantification of the cell population in different phases of the cell cycle is shown in figure 3(b). Cells were synchronized by 24 h serum starvation before starting the treatment. The serum starvation treatment (SF control) lined up 78% cells in G0/G1 phase, with 11% of the cells in each of the S, and G2 phases. The DMSO control (control) treatment showed the progression of the cell cycle as the number of cells in the replication phase (S-phase) and G2 phase increased to 15% and 16% respectively, with 69% of cells in G0/G1 phase. Figure 3(b) shows that the distribution of cells for the control group in the G0/G1, S, and G2 phases was significantly different from the respective phases in the SF control group (p < 0.05). The EP1 treatment had 73%, 15%, and 12% cells in G0/G1, S, and G2 phases, respectively. The EP2 treatment induced similar behavior with 72%, 17%, and 12% cells in G0/G1, S, and G2 phases, respectively. The distribution of cells in the G0/G1, S, and G2 phases for EP1 and EP2 did not differ significantly from the G0/G1, S, and G2 phase distribution for control samples.
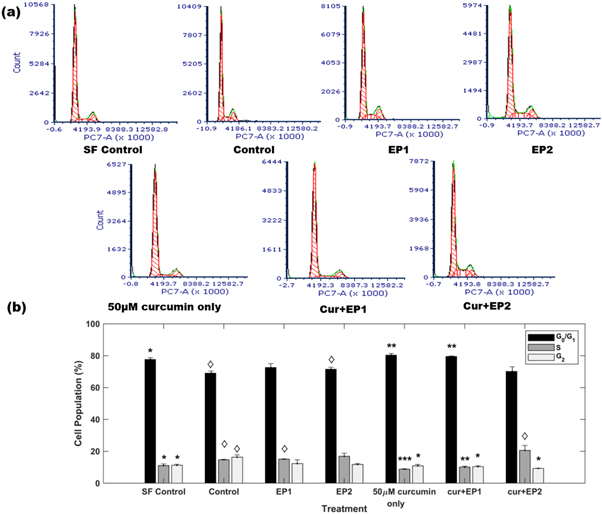
Figure 3. (a) DNA content analysis for different treatments, where EP 1 and EP 2 denote the application of eight 200 V cm−1 EPs at 5 μs and 100 ms, respectively and Cur represents 50 μM of curcumin. (b) Distribution of cell population in different cell cycle phases under different treatments. Results are based on three independent experiments. Error bars are calculated using standard error. *P < 0.05, **P < 0.005, ***P < 0.0005 significantly different from control. ◊P < 0.05, significantly different from SF control.
Download figure:
Standard image High-resolution imageThe curcumin only treatment induced significant G0/G1 phase cell cycle arrest with 80% cells in the G0/G1 phase compared to 69% for the control (p < 0.005). Moreover, 9% and 11% of the cells were in the S and G2 phases, respectively, which differed significantly from the S (p < 0.0005) and G2 (p < 0.05) phases of the control, indicating a strong shift from S phase in curcumin treatment. The combination of 100 μs duration EPs with curcumin in the cur + EP1 treatment arrested 80% of the cells in the G0/G1 phase, significantly different from control (p < 0.005). Moreover, cur + EP1 treatment reduced the percentage of cells in the S and G2 phases to 10% each, significantly different from the S (p < 0.005) and G2 (p < 0.05) phases in control. Further, the striking resemblance in the S and G2 phase distributions between cur + EP1 and serum-starved cells (cur + EP1: 10.1% in S, and 10.4 in G2; SF control: 11.1% in S, and 11.3 in G2) indicates that cur + EP1 halts cell cycle progression in the MDA-MB-231 cells.
Interestingly, increasing the pulse duration from 100 μs to 5 ms for cur + EP2 did not increase the fraction of G0/G1 phase cells. We observed that 70% of the cells were in the G0/G1 phase for the cur + EP2 treatment compared to 69% for the control, which was not significantly different. However, the fraction of cells in the G2 phase decreased significantly to 9% with an increase in the S phase to 21% compared to 16% and 15% in G2 and S (p < 0.05) for the control, respectively. The cell population in the S phase for cur + EP2 differed significantly form the SF control. These observations indicate a strong shift away from the G2 phase for cur + EP2 samples compared to control (p < 0.05).
Immunoblotting of p53
Figure 4(a) shows the immunoblots of p53 protein for different treatments, and figure 4(b) shows the quantification of p53 expression normalized with β-tubulin and reported relative to the control. The immunoblotting revealed a significant decrease of 54% in p53 levels for curcumin only treated samples compared to control. The EP1 sample showed a non-significant and marginal increase of 15% compared to the control. Similar to the curcumin only sample, the p53 levels for the cur + EP1 sample was significantly reduced by 42% compared to control. The p53 levels were not significantly different for curcumin only and cur + EP1 samples.
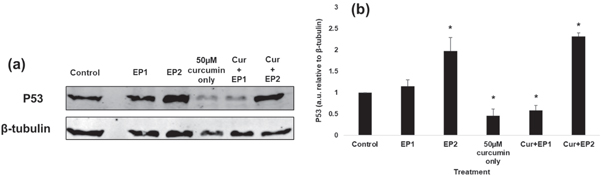
Figure 4. (a) Expression of p53 in the control and samples exposed to eight 200 V cm−1 electric pulses (EPs) at 100 μs (EP1), 5 ms (EP2), 50 μM curcumin (Cur), combined EP1 and curcumin (cur + EP1), and combined EP2 and curcumin (cur + EP2). (b) Quantified expression of p53 demonstrating a statistically significant reduction following treatment with Cur or cur + EP1 and a statistically significant increase in P53 following EP2 or cur + EP2 (* indicates p < 0.05 from the control). The quantified blots were normalized with β-tubulin and were reported relative to the control. Results are based on three independent experiments with error bars calculated using standard error.
Download figure:
Standard image High-resolution imageHowever, applying longer duration 5 ms EPs (at the same intensity) for EP2 significantly elevated the levels of p53 by 2 × compared to the control. Similarly, p53 expression for cur + EP2 sample also significantly increased by 2.3 × compared to the control. These observations suggest a difference in the action mechanism of effects observed under EPs delivering greater energy density over a longer EP duration and hence the energy.
Discussion
The dosage curve in figure 2(a) indicates that curcumin can significantly reduce the viability of MDA-MB-231 cells in a dose and time dependent manner. The MDA-MB-231 viability at 50 μM was 28%, which correlates extremely well with the 26% MDA-MB-231 viability observed by Huang et al at 50 μM [49]. We observed only a minimal reduction in the viability for dosages above 50 μM at 24 h and 48 h, indicating a plateau (2%–10% reduction from 50 μM to 100 μM that was not statistically significant). We observed limited cytotoxicity for lower curcumin concentrations (below 30 μM) at 24 h and 48 h. Latifah et al also observed similar behavior for MDA-MB-231 cells treated with lower curcumin dosages [50]. They reported a 2% viability reduction from 24 h to 48 h at 3 μg mL−1 (8.14 μM), which correlates extremely well with 1.6% viability reduction we observed from 24 h to 48 h at 10 μM. In our work, 30 μM curcumin significantly reduced the viability compared to NT control at 24 h and 48 h. Similarly, Huang et al reported reduced MDA-MB-231 cell proliferation at curcumin dosages of 30 μM and above [49]. Viability ranged from 13.8% to 16.7% for curcumin dosages from 50 μM to 100 μM at 48 h, indicating that curcumin only does not decrease MDA-MB-231 viability beyond ∼86% at 48 h. Considering this, we chose 50 μM dosage for the further studies.
Results in figure 2(b) indicate that combining curcumin with appropriate EP parameters can significantly reduce MDA-MB-231 cell viability compared to control and treatment with either curcumin only or EPs only. For cur + EP1, MDA-MB-231 cell viability decreased by 72% and 87% from the control at 24 h and 48 h, respectively. The impacts observed on the viability of MDA-MB-231 cells were much larger and time sustained compared to the non-cancerous MCF10A mammary epithelial cells (table 4). This is due to the different electrical properties of cancer cells compared to normal cells, as discussed by Dr Haltiwanger [51].
Table 4. The viability of MDA-MB-231 cells and MCF10A cells at 24 h and 48 h under different treatment conditions.
| MDA-MB-231 | MCF10A | |||
|---|---|---|---|---|
| 24 h | 48 h | 24 h | 48 h | |
| Control | 100 ± 2.2 | 100 ± 17.7 | 100 ± 5 | 100 ± 18.6 |
| 50 μM curcumin only | 32 ± 11.8 | 21 ± 7.5 | 76 ± 4.9 | 80 ± 0.8 |
| EP1 | 90 ± 8.6 | 89 ± 23.9 | 98 ± 3.5 | 116 ± 7.8 |
| Cur + EP1 | 28 ± 1.3 | 13 ± 2.9 | 64 ± 2.8 | 59 ± 1.8 |
In MDA-MB-231 cells, compared to control (100%) and curcumin (32%) samples, the cur + EP2 sample showed only 10% and 6% viability at 24 h and 48 h, respectively. This notable increase in cell death compared to the curcumin only sample indicates the enhanced cytotoxicity caused by increased curcumin uptake due to the synergy of electrical pulses and curcumin. Since EP1 and EP2 have the same electric field but much different pulse durations (100 μs versus 5 ms), EP2 will induce a much higher Vm for a much longer period of time. Thus, EP2 will create more long-lived membrane pores that will either induce more cell death than EP1 without curcumin, or increase curcumin transport into the cell to induce more cell death than EP1 during a combined curcumin and EP treatment. Increased EP2 viability highlights the synergistic effects produced by cur + EP2 on MDA-MB-231 viability. Viability as low as 6%, obtained with a single application of cur + EP2 indicates that combining the EP with curcumin may target compensatory survival pathways to overcome drug resistance due to heterogeneity. Therefore, one can obtain desirable cell death by appropriately selecting EP parameters for a fixed dosage.
Figure 3 indicates that different EP parameters at a given curcumin dose can perturb the cell cycle, playing a major role in differential treatment cytotoxicity. The cell cycle distributions for EP1 and EP2 did not differ significantly from control, indicating that EP application alone does not cause cell cycle arrest. While 50 μM curcumin caused significant cell cycle arrest in the G0/G1 phase, no significant cell cycle arrest occurred for EP2, highlighting mechanistic differences in cell death. Previous studies have also reported G1 arrest with curcumin in MDA-MB-231/Her-2 and other breast cancer cells [52–54]. Similarly, cur + EP1 caused significant cell arrest in the G0/G1 phase, which resembles SF control samples, indicating that pre-synchronized cells did not progress through the cell cycle for cur + EP1.
Unlike 50 μM curcumin and cur + EP1, the cur + EP2 sample, despite exhibiting the highest cytotoxicity in figure 2(b), had no cell cycle arrest in the G0/G1 phase; however, it did exhibit a significant reduction in G2 phase population with an increase in S phase population compared to control, which may indicate that the cells in the S phase were either slowed or arrested and not actively synthesizing DNA compared to control [55]. The variations in the cell cycle pattern observed with different EP parameters indicate that one may select appropriate EP parameters to achieve desired cell cycle effects, which could be coupled with drugs targeting a specific phase of cell cycle to synergistically target cancer cells with reduced side effects (e.g. cisplatin and bleomycin, which target DNA synthesis).
The p53 study results in figure 4 indicate that when MDA-MB-231 cells are exposed to curcumin only treatment for 24 h, the expression of p53 protein is significantly downregulated to 0.46, compared to 1 for control. This correlates very well with other researchers [26], who assessed 5 to 20 μg mL−1 of curcumin dosage. These authors observed that treatment with 20 μg mL−1 of curcumin (equivalent to 54.29 μM) significantly reduced the expression of p53 to ∼0.43, compared to 1 for control. We observed similar behavior by combining EP1 with curcumin (cur + EP1), which significantly downregulated the p53 level to 0.58 from 1 for control, although p53 level was not significantly different from 50 μM curcumin. The reduced p53 level for curcumin only and cur + EP1 treatments compared to the control correlates very well with our observed reduction in the MDA-MB-231 cell viability and cell cycle control in G0/G1 phase for curcumin only and cur + EP1. This suggest that the 50 μM curcumin and cur + EP1 treatments induce MDA-MB-231 cell death and G0/G1 cell cycle arrest through a p53 dependent mechanism, confirming that targeting mutant p53 in MDA-MB-231 cells can be an effective strategy [11, 14, 15].
Interestingly, we observed a significant increase in the p53 levels for the samples treated with 5 ms EPs (EP2) compared to the control. Other studies have reported similar results for low-intensity EP activation of p53 expression [41, 42]. The cur + EP2 treatment also caused a significant increase in p53 level compared to the control, while maximizing MDA-MB-231 cytotoxicity. This suggest that the effects induced by longer duration EPs (5 ms) may either be p53 level independent or are in response to the reactivation of p53 [13, 15]. Figure 5 summarizes the effects of the various treatments on cell viability, cell cycle, and p53 expression profile.

Figure 5. Schematic diagram of effects observed on cell viability, cell cycle, and p53 expression profile.
Download figure:
Standard image High-resolution image
Conclusion
Together these results indicate that EPs can manipulate the cell cycle and arrest cell division, undertaking distinct pathways and that their synergy with curcumin may provide a potentially effective and alternative way to target TNBC. This may open a new modality for applying EP-mediated curcumin therapy to aggressive and metastatic TNBC. This therapy is safe, physical, and inexpensive with a high potential for transfer to clinical practices.
Acknowledgments
The authors are grateful to the partial funding support by the Dean's award GRA—FY16, the help of Dr Jill Hutchcroft, Gregory Cresswell at the Purdue University Flow Cytometry facility, assistance of Rodrigo Ferreira during experiments, and Dr Kuhn's lab for spectrophotometer use.
Conflict of Interest
The authors declare no conflict of interest.