
Abstract
The current work focuses on the fabrication of pristine and metals (Co, Cu, Ni, Li, and Sn) doped β-PbO phase nanoparticles by cost-effective precipitation method. The properties of the produced nanoparticles were investigated using a variety of characterization techniques. The produced compound was a highly pure β-PbO phase, according to the XRD data. From the UV–vis DRS the obtained bandgap of pristine β-PbO, Co, Cu, Ni, Li, and Sn doped β-PbO was 2.68 eV, 1.88 eV, 2.01 eV, 2.65 eV, 2.64 eV, and 2.70 eV, respectively. The doped samples with the lowest photoluminescence (PL) intensities show the reduced photogenerated electron–hole pair recombination, which increased the photocatalytic activity of β-PbO nanoparticles. The study of the surface morphology by SEM reveals the irregular distribution of the particles. In both pristine and doped nanoparticles, EDX verifies the existence of the expected elements. In comparison to pristine β-PbO, all doped β-PbO nanoparticles have enhanced photocatalytic activity for the degradation of methylene blue (MB) dye under the irradiation of visible light. Among the doped nanoparticles, Cu and Co-doped β-PbO demonstrated particularly high performance. After 80 min of irradiation, Cu and Co-doped β-PbO showed 99.45% and 99.39% degradation rates of MB dye, compared to only 75.13% for pure β-PbO. Hence, the photocatalytic activity of pure β-PbO is boosted through metals doping due to bandgap narrowing, generation of impurity states, increased specific surface area, higher carrier concentration, reduced carriers recombination, the action of dopant ions, and microstructural changes.
Export citation and abstract BibTeX RIS

Original content from this work may be used under the terms of the Creative Commons Attribution 4.0 licence. Any further distribution of this work must maintain attribution to the author(s) and the title of the work, journal citation and DOI.
1. Introduction
Various semiconducting oxide nanoparticles has used as catalysts for the degradation of organic pollutants in air and water due to their high specific area, fast dispersion, high reactivity, and strong sorption. Titanium dioxide (TiO2) is the most widely used and excellent photocatalytic material among various oxide materials [1]. Other semiconducting oxide nanoparticles, such as ZnO, WO3, Cu2O, CuO, SnO2, etc, are also reported for photocatalysis applications [2]. However, these semiconducting metal oxides have drawbacks, including rapid charge recombination, poor sensitivity with visible light irradiation, and nanoparticle aggregation that affects their applications as photocatalysts [3]. TiO2 and ZnO are among the widely used photocatalysts. However, pure TiO2 and ZnO are active only under UV light irradiating, which is expensive compared to the visible light solar spectrum [4]. Thus, due to their wide bandgap, TiO2 and ZnO showed low photocatalytic performance under the irradiation of visible light. For the enhancement of photocatalytic performance of semiconducting oxide nanoparticles, significant efforts such as metal or nonmetal doping, deposition of surface of oxide materials by metals or other metal oxides, control of materials morphology, compositing with carbon-based materials, and fabrication of superstructure mesocrystals have been made [2, 3, 5]. Among these, various metal doping has attracted much interest because through metals doping new impurity level is created, and the bandgap becomes narrow, thereby improving the photocatalytic activity under visible light irradiation. For example, Xie et al [6] reported the Se-doped TiO2 by sol–gel method to enhance visible light irradiation of TiO2 with a wide bandgap of 3.2 eV. Adeel et al [7] produced Co-doped ZnO through precipitation method for the degradation of methyl orange under visible light irradiation. The incorporation of Co into ZnO inhibited the charge carriers' recombination. Cheng et al [8] also reported the S doped Bi4Ti3O12 for the photodegradation of organic pollutants. According to their study, the doped materials exhibited enhanced photocatalytic activity due to the visible light adsorption enhancement and sufficient separation of photoinduced electron–hole pairs.
Lead monoxide (PbO) is among semiconducting oxide nanoparticles having α-PbO and β-PbO polymorphs. The crystal structure of α-PbO is tetragonal and is stable at low temperatures, whereas the crystal structure of β-PbO is orthorhombic and is stable at high temperatures [9, 10]. Researchers have been synthesized β-PbO nanoparticles by using different methods. Despite the successful synthesis of pure β-PbO nanoparticles, there are few reports on the different metal-doped β-PbO phase nanoparticles. Azarang et al [11] prepared Zn-doped PbO nanoparticles and deposited on fluorine-doped tin oxide as a photoanode to measure the photocurrent response of SnSe nanoparticles. From the XRD result, they observed that the undoped PbO nanoparticle has a mixture of both β-PbO and α-PbO phases. However, the Zn-doped PbO nanoparticles showed only the β-PbO phase as they confirmed by Raman spectra results.
PbO and PbO-containing photocatalysts have been reported so far for the photodegradation of different organic pollutants. For instance, Borhade et al [12] synthesized orthorhombic pristine PbO and Ni-doped PbO through hydrothermal method for the methyl blue dye degradation under visible light irradiation. Wang et al [13] reported the perovskite-like PbBiO2Br/PbO/g-C3N4 photocatalyst for the photodegradation of crystal violet dye and 2-Hydroxybenzoic Acid under visible light irradiation. Wang et al [14] synthesized PbO/TiO2 and Sb2O3/TiO2 nanocomposite photocatalysts via the hydrothermal method for the photocatalytic degradation of Benzophenone-3 under visible light irradiation. Bhachu et al [15] also reported the PbO-modified TiO2 photocatalyst by depositing PbO clusters onto anatase TiO2 film through aerosol-assisted chemical vapor deposition. According to this report, the PbO generates a new state above the valence band. At the same time, electron localization takes place on the surface of TiO2, and hole localization takes place on PbO, modifying the photocatalytic activity of TiO2. Mebed et al [16] also reported the PbO-Al2O3 nanocomposite synthesized by a microwave irradiation method and utilized for the degradation of methylene blue (MB) dye under UV–vis and visible light irradiation. MB dye is among the synthetic dyes widely used in textile industries which are physically and chemically stable compounds that affect aquatic life when released into the environment without treatment and effective management [7].
Doping either metals or non-metals into metal oxide semiconductors generates impurity levels which can enormously enhance the photocatalytic activities by separating the charge carriers under visible light irradiation [17]. The literature has reported that the undoped/dopant surface could act as regulation sites for separating photoinduced electron–hole pairs and improves photocatalytic performance [18]. Our group recently reported the influence of various metal-doped α-PbO catalysts for the photodegradation of MB dye under visible light irradiation [19]. The results obtained confirmed the significant influence of fabrication methods on the tuning of photocatalyst properties. In the present work, the high purity β-PbO and various metal doped β-PbO nanoparticles were successfully synthesized via chemical precipitation method and its photocatalytic activity for the degradation of MB dye under visible light irradiation has been evaluated. In this work, we have selected β-PbO due to its easy for synthesis and low cost comparatively. Not only this, in our previous work we have easily synthesized α-PbO by using the same precursor and a high purity β-PbO in our present study. This has excited us to select and investigate the photocatalytic activity of β-PbO. Cu, Co, Ni, Sn, and Li are selected as dopants due their exceptional behaviors in improving the photocatalytic activity of metal oxide nanoparticles. Moreover, to identify and compare the effects of dopants from different groups, Cu, Co, and Ni are selected from transition metals, Sn is from post transition neighbor of the host Pb and Li is from group I elements. Furthermore, to the best our knowledge there is no report on the photocatalytic activity of β-PbO and the doped β-PbO. Thus, the current study provided new insight in the investigation of photocatalytic activity of pristine and different metals doped β-PbO under visible light irradiation.
2. Experimental detail
2.1. Chemicals and reagents
Lead acetate trihydrate (99.0% purity) was acquired from Loba Chemie and utilized as a precursor for synthesizing β-PbO nanoparticles. Stannous chloride dehydrates, Cobalt (II) nitrate hexahydrate, Cupric acetate monohydrate and Nickel acetate tetrahydrate were purchased from Loba Chemie and lithium nitrate was from Alpha Chemika which were used as Sn, Co, Cu, Ni, and Li dopants precursors respectively. NaOH (99%) and HCl (35%) were employed as pH adjusters, sourced from Loba Chemie. The MB dye (C16H18 ClN3S), employed as the organic pollutant model, was procured from Loba Chemie. Ascorbic acid (99.9%), disodium ethylenediaminetetraacetic acid (>99%), and isopropyl alcohol (99.5%) were obtained from Loba Chemie and CARELABMED India respectively and were used as scavengers. All reagents and chemicals were used without further purification. Distilled water served as the solvent throughout the experiment.
2.2. Preparation of pristine and metals doped β-PbO NPs
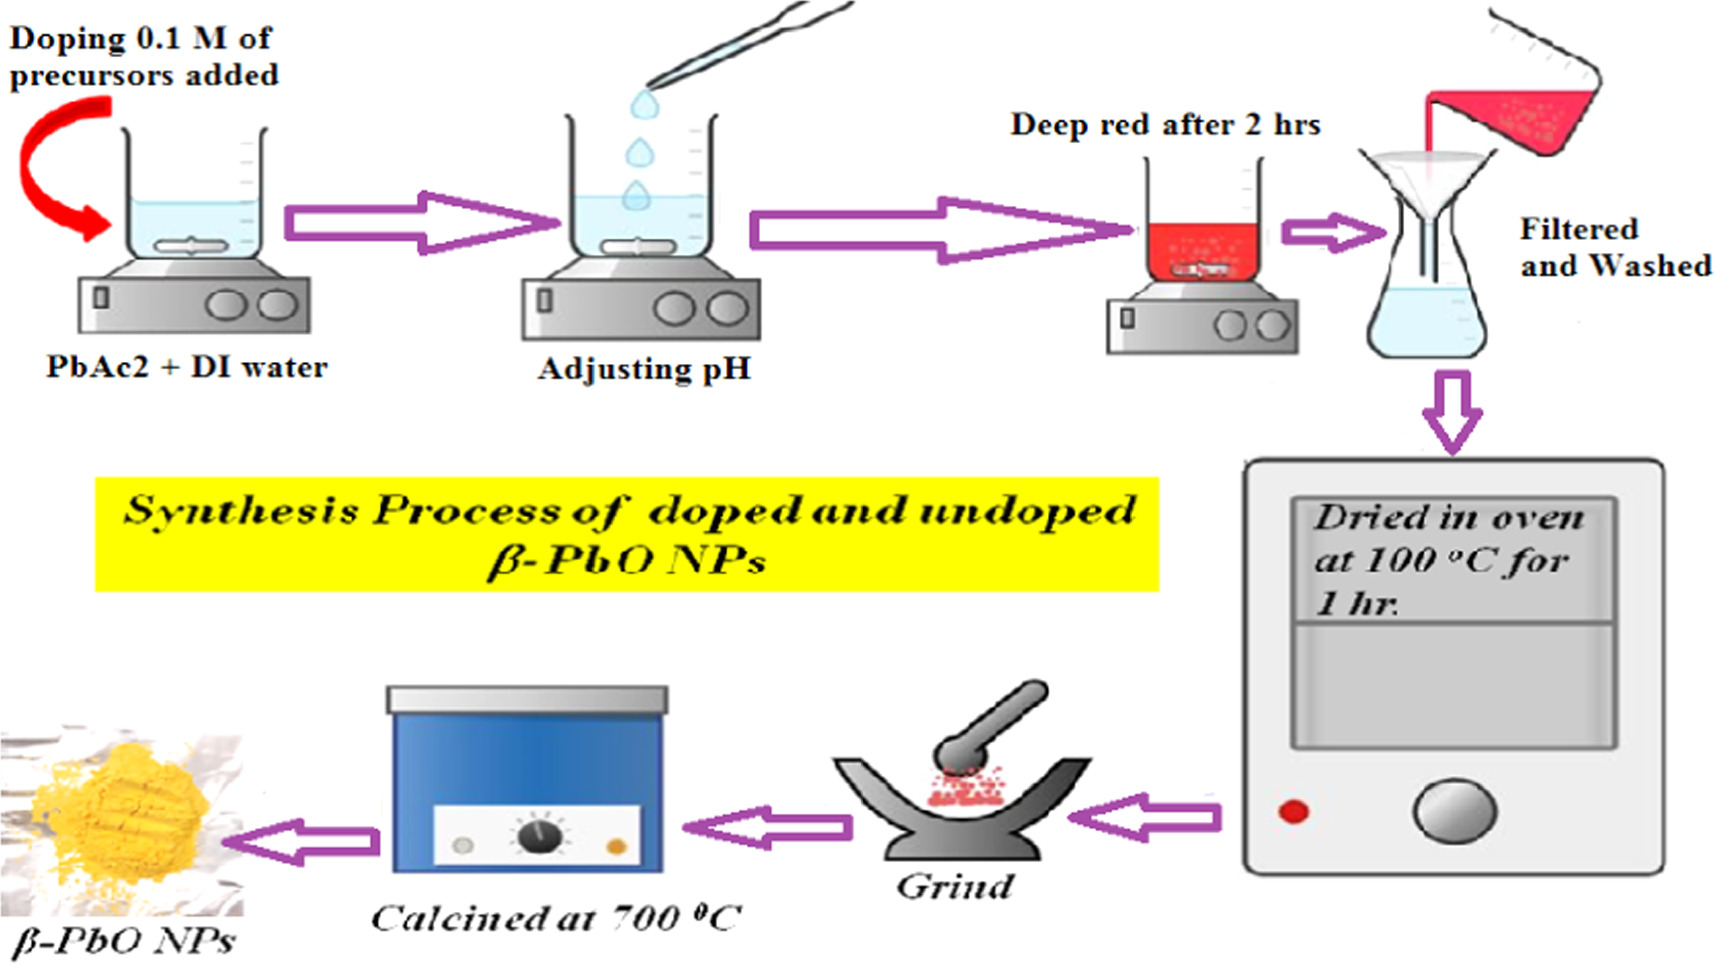
In this study, pristine and metal-doped β-PbO nanoparticles (NPs) were synthesized following the method outlined in [19]. For pristine β-PbO, 50 ml of distilled water and 0.5 M Pb(CH3COO)2.3H2O were added to a beaker and stirred until a clear solution formed. Subsequently, a pH controller and reducing agent were prepared by dissolving 9.5 M NaOH in 50 ml of distilled water in a separate beaker. Then, 20 ml of the NaOH solution was added drop wise to the Pb(CH3COO)2.3H2O solution, while maintaining a temperature of 85 °C and continuous stirring. As NaOH solution was added drop wise, the color of the solution changed from clear to milky and then to cloudy. After 2 h, the solution turned orange, eventually transforming into a deep red color, indicating the formation of pristine β-PbO nanoparticles, at which point the reaction was halted. The resulting red precipitate was filtered using Whatman paper. To eliminate impurities such as organic compounds, the filtered precipitate was sequentially washed with ethanol and distilled water. Finally, the precipitate was dried in an oven at 100 °C for 1 h. To achieve high-purity β-PbO nanoparticles, the oven-dried sample was transferred to a furnace and annealed at 700 °C for 2 h.
The entire synthesis process of β-PbO NPs is shown in figure 1. For the preparation of metals doped β-PbO NPs, similar procedures were followed except the adding of 0.1 M of each dopant to the Pb(CH3COO)2.3H2O solution separately. Thus, 0.1 M of SnCl2.2H2O, Co(NO3)2.6H2O, Cu(CH3COO).H2O, Ni(CH3COO)2.4H2O, and LiNO3 were added to Pb(CH3COO)2.3H2O solution for the formation of Sn2+, Co2+, Cu2+, Ni2+ and Li+ doped β-PbO NPs respectively. Finally, the prepared samples were collected and stored for further characterizations.

Figure 1. The entire synthesis process of β-PbO NPs.
Download figure:
Standard image High-resolution image2.3. Characterizations techniques
For phase identification, x-ray diffraction (XRD) analysis was conducted using a Shimadzu-7000 instrument with CuKα radiation at a wavelength of 1.5406 Å. Optical properties were studied using UV–vis diffuse reflectance spectroscopy (UV–vis DRS) with a UV-3600 Plus Series Model, covering a range from 320 nm to 800 nm. Emission spectra analysis of the prepared samples was performed using a photoluminescence spectrometer (PL), specifically the HORIBA FluoroMax-4 Spectrofluorometer, with an excitation wavelength of 352 nm. Surface morphology was examined via scanning electron microscopy (SEM) utilizing the Jeol JSM-75000F Field Emission Scanning Electron Microscope, with imaging conducted using Jeol PC-SEM software. Elemental composition spectrum was measured using energy dispersive x-ray analysis (EDX) with Thermo NSS software. Additionally, UV–visible spectrophotometry was employed to measure the absorbance of MB dye at various time points during light irradiation, utilizing a halogen lamp as the visible light source with a power of 150 W and a wavelength range from 350 nm to 800 nm.
2.4. Photocatalytic degradation experiment
The photocatalytic experiment carried out with the preparation of the aqueous suspension. Appropriate amount of catalyst (nanoparticles) was dissolved in 100 ml of MB dye solution with an initial concentration of 10 ppm. To adjust the pH, 0.5 M NaOH was dissolved in 100 ml of distilled water, and a solution containing a 10:100 ratio of HCl to distilled water was prepared to adjust the pH to 10. A halogen lamp served as the visible light source for degrading the MB dye. The aqueous suspension of MB dye with catalysts was then added to a 1L Pyrex container, which served as the vessel in the photoreactor. A dark experiment was conducted while stirring for 30 min to establish adsorption–desorption equilibrium. Subsequently, the aqueous suspension was transferred into the photoreactor, and the irradiation was initiated. Samples of 8 ml each were withdrawn at 20-minute intervals until 80 min had elapsed. These withdrawn samples were then centrifuged for 30 min at 4000 rpm to remove the catalyst (nanoparticles). Finally, the centrifuged samples were analyzed using a UV–Vis spectrophotometer at a wavelength of 664 nm. The absorption spectra of the supernatant were collected for the analysis of MB dye degradation. To identify the types of reactive species, a trapping experiment was conducted using disodium ethylenediaminetetraacetate, isopropyl alcohol, and ascorbic acid as scavengers for holes ( ), hydroxyl radicals (·
 ), and superoxide radicals (
 ), respectively. Each scavenger was added at a concentration of 3 mM to the aqueous solution of MB dye and catalyst. Importantly, all experimental conditions, including pH value, irradiation time, catalyst dosage, and initial concentration of MB dye, remained consistent across all samples in the photocatalytic experiment.
3. Results and discussions
3.1. XRD analyses
The XRD patterns of high purity β-PbO and metals doped β-PbO are shown in figure 2(a). The XRD peaks are indexed as (010), (111), (020), (200), (201), (220), (022), (131), (311), (222), and (040). The obtained phase is the β-PbO phase which is confirmed from the matching well with JCPDS PDF #38–1477. For pristine β-PbO, there is no unknown revealed peak which indicates that the synthesized material is a high purity β-PbO phase. The pristine β-PbO and different metals doped β-PbO patterns are sharp and strong, which specify the crystallinity nature of the prepared nanoparticles. Among the indexed peaks, the (111) and (020) showed highest intensity peaks for pristine β-PbO and metals doped β-PbO. However, the rest indexed peaks are showed lower intensity peaks. The predominance of the (020) plane of pristine and lithium doped β-PbO is showing the growth orientation along the 〈020〉. For other metals doped β-PbO the (111) is the dominant diffraction peak which is showing the orientation along the 〈111〉. As shown in the enlarged figure 2(b) the different metal doped β-PbO shows shifts relative to the dominant diffraction peaks of pristine β-PbO at positions 29.12°, 30.34°, and 32.62°. For the (200) plane, all doped materials showed shifts to the highest angles except Sn-doped β-PbO, which can be attributed to the dopant impurities. The non-similar ionic radii of dopants and host materials may responsible for the higher or lower angle shifts of diffractions. This can subsequently decrease or increase the crystallite size of the papered materials. To the highest and lowest shift shows the lattice strain and relaxation respectively. In terms diffraction intensity peaks, the reduction after dopants incorporation indicates the introduction of some perturbation in the crystal structure of β-PbO [20]. For Sn-doped β-PbO the (111) and (020) crystal plane are not shifted due to the similar ionic radius of Sn2+ and Pb2+ which is 0.118 nm and 0.119 nm respectively [21]. The ionic radius of Li+, Ni2+, Cu2+ and Co2+ is 0.076 nm, 0.073 nm, 0.069 nm and 0.065 nm respectively. From the XRD data crystallite size  of undoped and metals doped β-PbO NPs is calculated by the relation of full width at half maximum (FWHM) β given by Scherer's relation [22].

The crystallite sizes of undoped and metals doped β-PbO are given in table 1. The crystallite size of undoped β-PbO is 57.39 nm. However, except for Li-doped for other metal doped the crystallite size is decreased. The increased crystallite size of Li-dope is attributed to the high shifts to the highest angle position and highest intensity peaks compared to other metals doped β-PbO. The size mismatch of the hosts Pb2+ or O2 and dopants distort the crystallinity of the materials. The induced strain which can be causes the distortion of crystallinity can estimated by the relation:

The estimated induced strain of undoped and metals doped β-PbO are given in table 1. For Sn, Cu, and Ni-doped β-PbO, the induced strain is increased which may attribute to the lattice mismatch of dopants with host material β-PbO. The increased induced strain confirms the deterioration crystallinity of the metals doped β-PbO. Particularly, the induced strain highly increased for the Ni-doped compared other metals doped. For Co-doped, the induced strain is almost equal with pristine β-PbO, whereas it decreases for Li-doped. The increased strain in Ni-doped shows the substantial ionic radii difference between Ni and β-PbO. This causes the lattice distortion, which can lead to XRD peaks shifting to the highest angle position, as one can observe from figure 2(b). The Li-doped induces a small strain relative to other dopants.
Figure 2. (a) the XRD patterns of undoped and metals doped β-PbO NPs and (b) the extended patterns of the plane (111), (020) and (200).
Download figure:
Standard image High-resolution imageTable 1. The calculated crystallite sizes, dislocation density, and strain pristine and different metals doped β-PbO.
| Materials | D (nm) | ε [(line−2(nm)−4) × 10−4] | δ [lines/(nm)2) × 10−4] |
|---|---|---|---|
| Pristine β-PbO | 57.39 | 5.88 | 3.06 |
| Sn: β-PbO | 50.93 | 6.62 | 3.87 |
| Co:β-PbO | 57.36 | 5.88 | 3.05 |
| Cu: β-PbO | 56.09 | 6.01 | 3.20 |
| Ni:β-PbO | 54.94 | 6.13 | 3.33 |
| Li:β-PbO | 58.54 | 5.76 | 2.93 |
The dislocation density (δ) can be calculated by:

The dislocation density for the Sn, Cu, and Ni-doped is increased compared to the pristine β-PbO as shown table 1. The increase of the dislocation density of the metals doped shows the disorder and the degradation of crystalline quality of β-PbO. The dislocation density for other metals doped materials is decreased, which can be attributed to the high crystallinity of these materials.
Figures 3(a)–(f) presents the Rietveld refinements of XRD data of undoped and metals doped β-PbO done by GSAS II. The red dots, black solid line, and green curve corresponds to the observed data, the Rietveld refinement profile and the difference between observed and calculated at every step respectively. The Rietveld refinement is more important in phase analysis. The obtained lattice parameters and cell volumes from the Rietveld refinement for undoped and metals doped β-PbO is given in table 2. These results are in the best agreement with the previous report [23].
Figure 3. The Rietveld refinement profiles of XRD data for undoped β-PbO, Sn-doped β-PbO, Cu-doped β-PbO, Ni-doped β-PbO, Co-doped β-PbO, and Li-doped β-PbO (a)–(f) respectively. The red dots, black line, green line and blue ticks represents experimental data, calculated pattern, difference curve and Bragg diffraction positions respectively.
Download figure:
Standard image High-resolution imageTable 2. Lattice constants a, b, and c of pristine and different metal doped β-PbO obtained from Rietveld refinement by using GSAS-II software.
| Materials | Lattice constants (Å) | Cell volume (Å)3 | ||
|---|---|---|---|---|
| a | b | c | ||
| Pristine β-PbO | 5.88674(26) | 5.4861(4) | 4.7496(3) | 153.387(21) |
| Sn:β-PbO | 5.8865(3) | 5.4843(3) | 4.7504(3) | 153.357(22) |
| Co:β-PbO | 5.88845(20) | 5.48655(22) | 4.75176(20) | 153.517(13) |
| Cu:β-PbO | 5.88733(19) | 5.48615(21) | 4.75094(20) | 153.450(13) |
| Ni:β-PbO | 5.88873(21) | 5.48623(20) | 4.75179(18) | 153.516(13) |
| Li: β-PbO | 5.89127(11) | 5.4931(4) | 4.7539(3) | 153.843(11) |
3.2. UV–vis diffuse reflectance spectra
The UV–vis DRS of undoped and metals doped β-PbO are shown in figure 4 and the absorption edge is ranging from 460 nm to 750 nm. It can be seen that the absorption edge for pristine β-PbO is near 420 nm, while Ni and Li-doped the characteristic absorption edge is revealed near 430 nm, 418 nm, respectively. However, it shows a substantial variation for Co and Cu-doped β-PbO. Besides, pristine β-PbO, Li, Sn, and Ni-doped show similar characteristics of reflectance. For pristine β-PbO, the reflectance decreases up to 420 nm but from 420 nm, it increases. It possessed the greatest reflectance of greater than 98% in the visible light region above 566 nm. In the between the wavelength of 320 nm to 566 nm, the Li-doped β-PbO owns the largest reflectance than undoped and other metals doped β-PbO. The adsorption edge for Sn-doped β-PbO is near 396 nm, which showed shifts to the lowest wavelength. Starting from 396 nm, the reflectance of Sn-doped β-PbO increases and becomes greater than all doped materials for wavelength above 620 nm. Co, Cu, and Ni doped β-PbO showed the lowest reflectance compared to undoped β-PbO, Sn, and Li doped in the spectral region 320 nm to 800 nm. The reflectance of Ni doped slowly decreases in the UV region until 418 nm and gradually increases in the visible light region. The highest reflectance is observed in the region 320 to 566 nm for the Li doped β-PbO. For Co-doped, the reflectance decreases as wavelength increases. In the highest wavelength starting from 566 to 800 nm, all doped materials have lower reflectance than pristine β-PbO. The lowest reflectance is attributed to the transfer of charge from the valence band to excited states. Among all the Co doped showed the lowest reflectance. The lowest reflectance of the doped materials shows improved absorption, which may be attributed to the defect introduced due to dopants' impurity levels. The optical bandgap is estimated by Kubelka–Munk equation given by [24]:

where,  is Kubelka–Munk function, and R is the reflectance. Figures 5(a)–(f) shows the plots of
  against photon for undoped and metals doped β-PbO. The value of the band gap is estimated from the points at which straight line cuts photon energy. Except Sn-doped, other doped materials showed red shifts in their bandgap, which can be attributed to impurity levels due to doping. Thus, band gap of undoped β-PbO, Sn, Ni, Li, Co, and Cu doped β-PbO is 2.68 eV, 2.70 eV, 2.65 eV, 2.64 eV, 1.88 eV, and 2.01 eV respectively. The value of the band gap is decreased in metals doped β-PbO, thereby improving the absorbance. However, in Sn-doped β-PbO, the band gap is slightly increased. The band gap increasing while doping metal in metal oxide was reported in Ga-doped ZnO [25]. The band gap variation is due to the variation of ionic radii of dopants and host material. The ionic radius of Sn2+, Li+, Ni2+, Cu2+ and Co2+ is 0.118 nm, 0.076 nm, 0.073 nm, 0.069 nm and 0.065 nm. The Co doped owns the lowest band gap as its ionic radius is also small compared to other metals. However, Sn doped owns the largest bandgap hence; Sn has the largest ionic radius compared to other dopants.
Figure 4. UV–vis DRS of undoped and metals doped β-PbO.
Download figure:
Standard image High-resolution image
Figure 5. Curves for determination of bandgap of (a) undoped β-PbO, (b) Li, (c) Ni, (d) Co, (e) Cu, and (f) Sn doped β-PbO.
Download figure:
Standard image High-resolution image3.3. PL emissions analysis
The powder of undoped and metals doped β-PbO NPs are analyzed by photoluminescence (PL) and their emission spectra under 352 nm excitation wavelength of shown in figure 6. The undoped β-PbO Cu, Co, and Ni doped shown strong green band emission at 523 nm. However, they are with different intensities. The strong green band emission can be attributed to oxygen vacancy, dopants defect level and Pb2+ interstitial. However, in Li and Sn doped, the intense green emission band shows a redshift which is 524 nm. Thus, defects such as oxygen vacancy and interstitial defects can cause the emission of green band. The Pb2+ vacancy can also cause the formation of green band emission at 523 nm [26]. Weak band emissions are observed at 536 nm, 547 nm, and 623 nm for pristine β-PbO. For Li-doped, the weak emission bands are observed at 537 nm, 547 nm, and 622 nm. For Sn-doped, the weak emission bands are revealed at 537 nm, 547 nm, and 621 nm. The weak emission band observed at 633 nm shows the redshifts. From these results, the blue and red shifts are observed. Weak emission broad red band emerged at 623 nm is occurred is due to the defect of interstitial atom. Shifts in emission bands are attributed to defects of dopants impurity. The transfer of charge from the excited state edge to singly ionized O2 also causes the green emission bands [27].
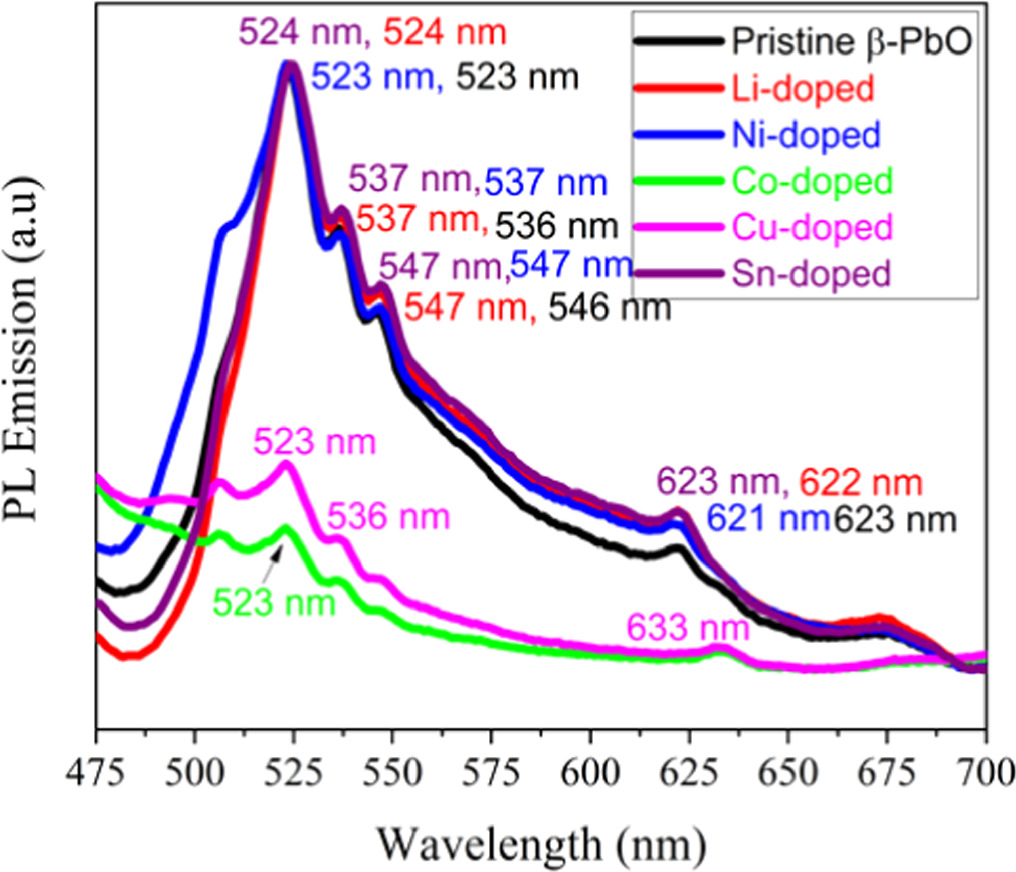
Figure 6. Photoluminescence emissions of undoped and metals doped β-PbO NPs.
Download figure:
Standard image High-resolution imageSn doped showed the highest intensity which indicates weak interaction of Sn-O bond, hence capacity of carriers increases at trap center due the increase of emission intensity peaks [16]. However, Co doped showed weak intensity due to strong interaction between Co and O [28]. The decrease in emission intensity can also attributed to charge transfer from highest occupied state to donor level occurred by dopants [29]. In solar cells and photocatalysis the weak PL intensity mean low recombination of charge carriers subsequently enhancing the performance of materials [29, 30]. The defect formation decreases the recombination of charge carriers. Hence, the oxygen vacancy accepts the generated electrons, while the ions of dopants accept the generated hole [30]. Therefore, weak PL intensity shows a reduced recombination of photoinduced electrons and holes; hence, improved photocatalytic activity of materials is expected.
3.4. SEM analyses
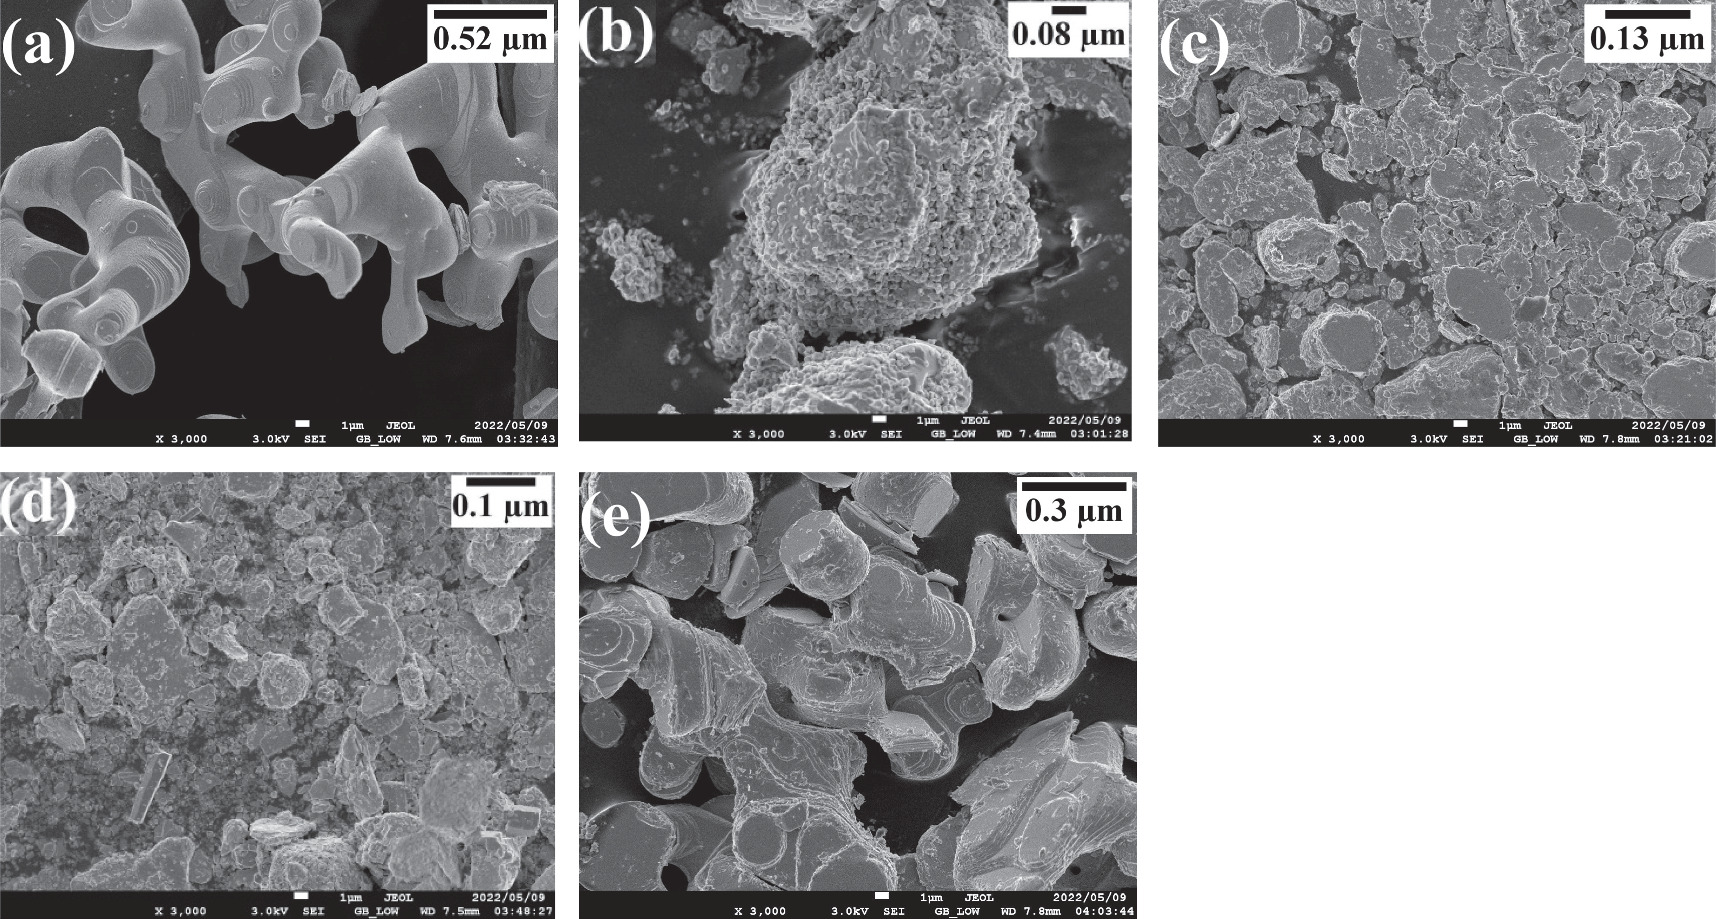
The image of SEM for undoped and metals doped β-PbO is shown in figure 7. As presented in figure 7(a) undoped β-PbO NPs are agglomerated and formed interconnected flake-like morphologies. The aggregated particles have layered flake-like orthorhombic, which are deposited on top of each other by forming interconnected branches. Gaussian distribution is used to estimate the distributions of average size of synthesized NPs. The average particle size for pristine β-PbO nanoparticles is estimated to be 0.52 μm. The SEM micrograph image of Co doped is shown in figure 7(b). Thus, the very tiny particles with different morphological shapes such as an irregular morphology and nanorod-like shape are observed. Each particle is agglomerated with inter-particle distance. Thus, it has formed a void-like at the interface of agglomerated particles. The average size of Co doped is 0.08 μm which is the smallest particle size among other synthesized nanoparticles. As shown in figure 7(c), the Cu doped NP has an irregular and flake-like shape of particles which are agglomerated with 0.13 μm average size of particles. Ni-doped β-PbO has nanorods and orthorhombic morphological shapes as shown in figure 7(d). The hexagonal rod-like shapes are also observed. The average size of Ni-doped β-PbO NP is 0.1 μm. The Li doped has almost similar particle distributions to the undoped β-PbO as shown in figure 7(e). As it is explained in XRD analysis, the Co2+, Cu2+, Ni2+ doping has shown shifts which may disturbs the crystal structure of pristine β-PbO. Thus, compared to Li+ doping, the Co2+, Cu2+, Ni2+ doping has shown more shifts in the crystal plane (111) and (020). Thus, the SEM morphology of Co2+, Cu2+ and Ni2+ doping is not the same with pristine β-PbO. In figure 7(e), the plate-like flake shapes are deposited on top of each other and form agglomerated morphological distribution with 0.3 μm average particle size. Generally, the average particle size of the doped nanoparticles decreased compared to the undoped β-PbO.

Figure 7. The SEM image of (a) undoped, (b) Co, (c) Cu, (d) Ni, and (e) Li β-PbO.
Download figure:
Standard image High-resolution imageThe SEM and EDX of Sn doped β-PbO is not included due to shortage of chemicals, however, from other characterization and photocatalytic degradation it is clear that Sn doping has great effect for the enhancement of photocatalytic activity of β-PbO.
3.5. EDX analyses
Figures 8(a)–(e) shows the EDX spectra of undoped and metals doped β-PbO NPs. From these spectra the required elements are emerged in undoped and metals doped samples. The atom and weight percentage of emerged elements in the spectra are shown by inset tables of figures 8(a)–(e). A small percentage of Al is presented in all materials which might be from the crucible used during calcination process. EDX cannot measure the elements of atomic number below 6, thus, in Li-doped spectra Li could not reveal. However, from UV–vis and XRD analysis, the incorporation of Li into the β-PbO NPs can be confirmed. For the undoped β-PbO, the Pb atom percentage is larger than the atom percentage oxygen as shown in figure 8(a).
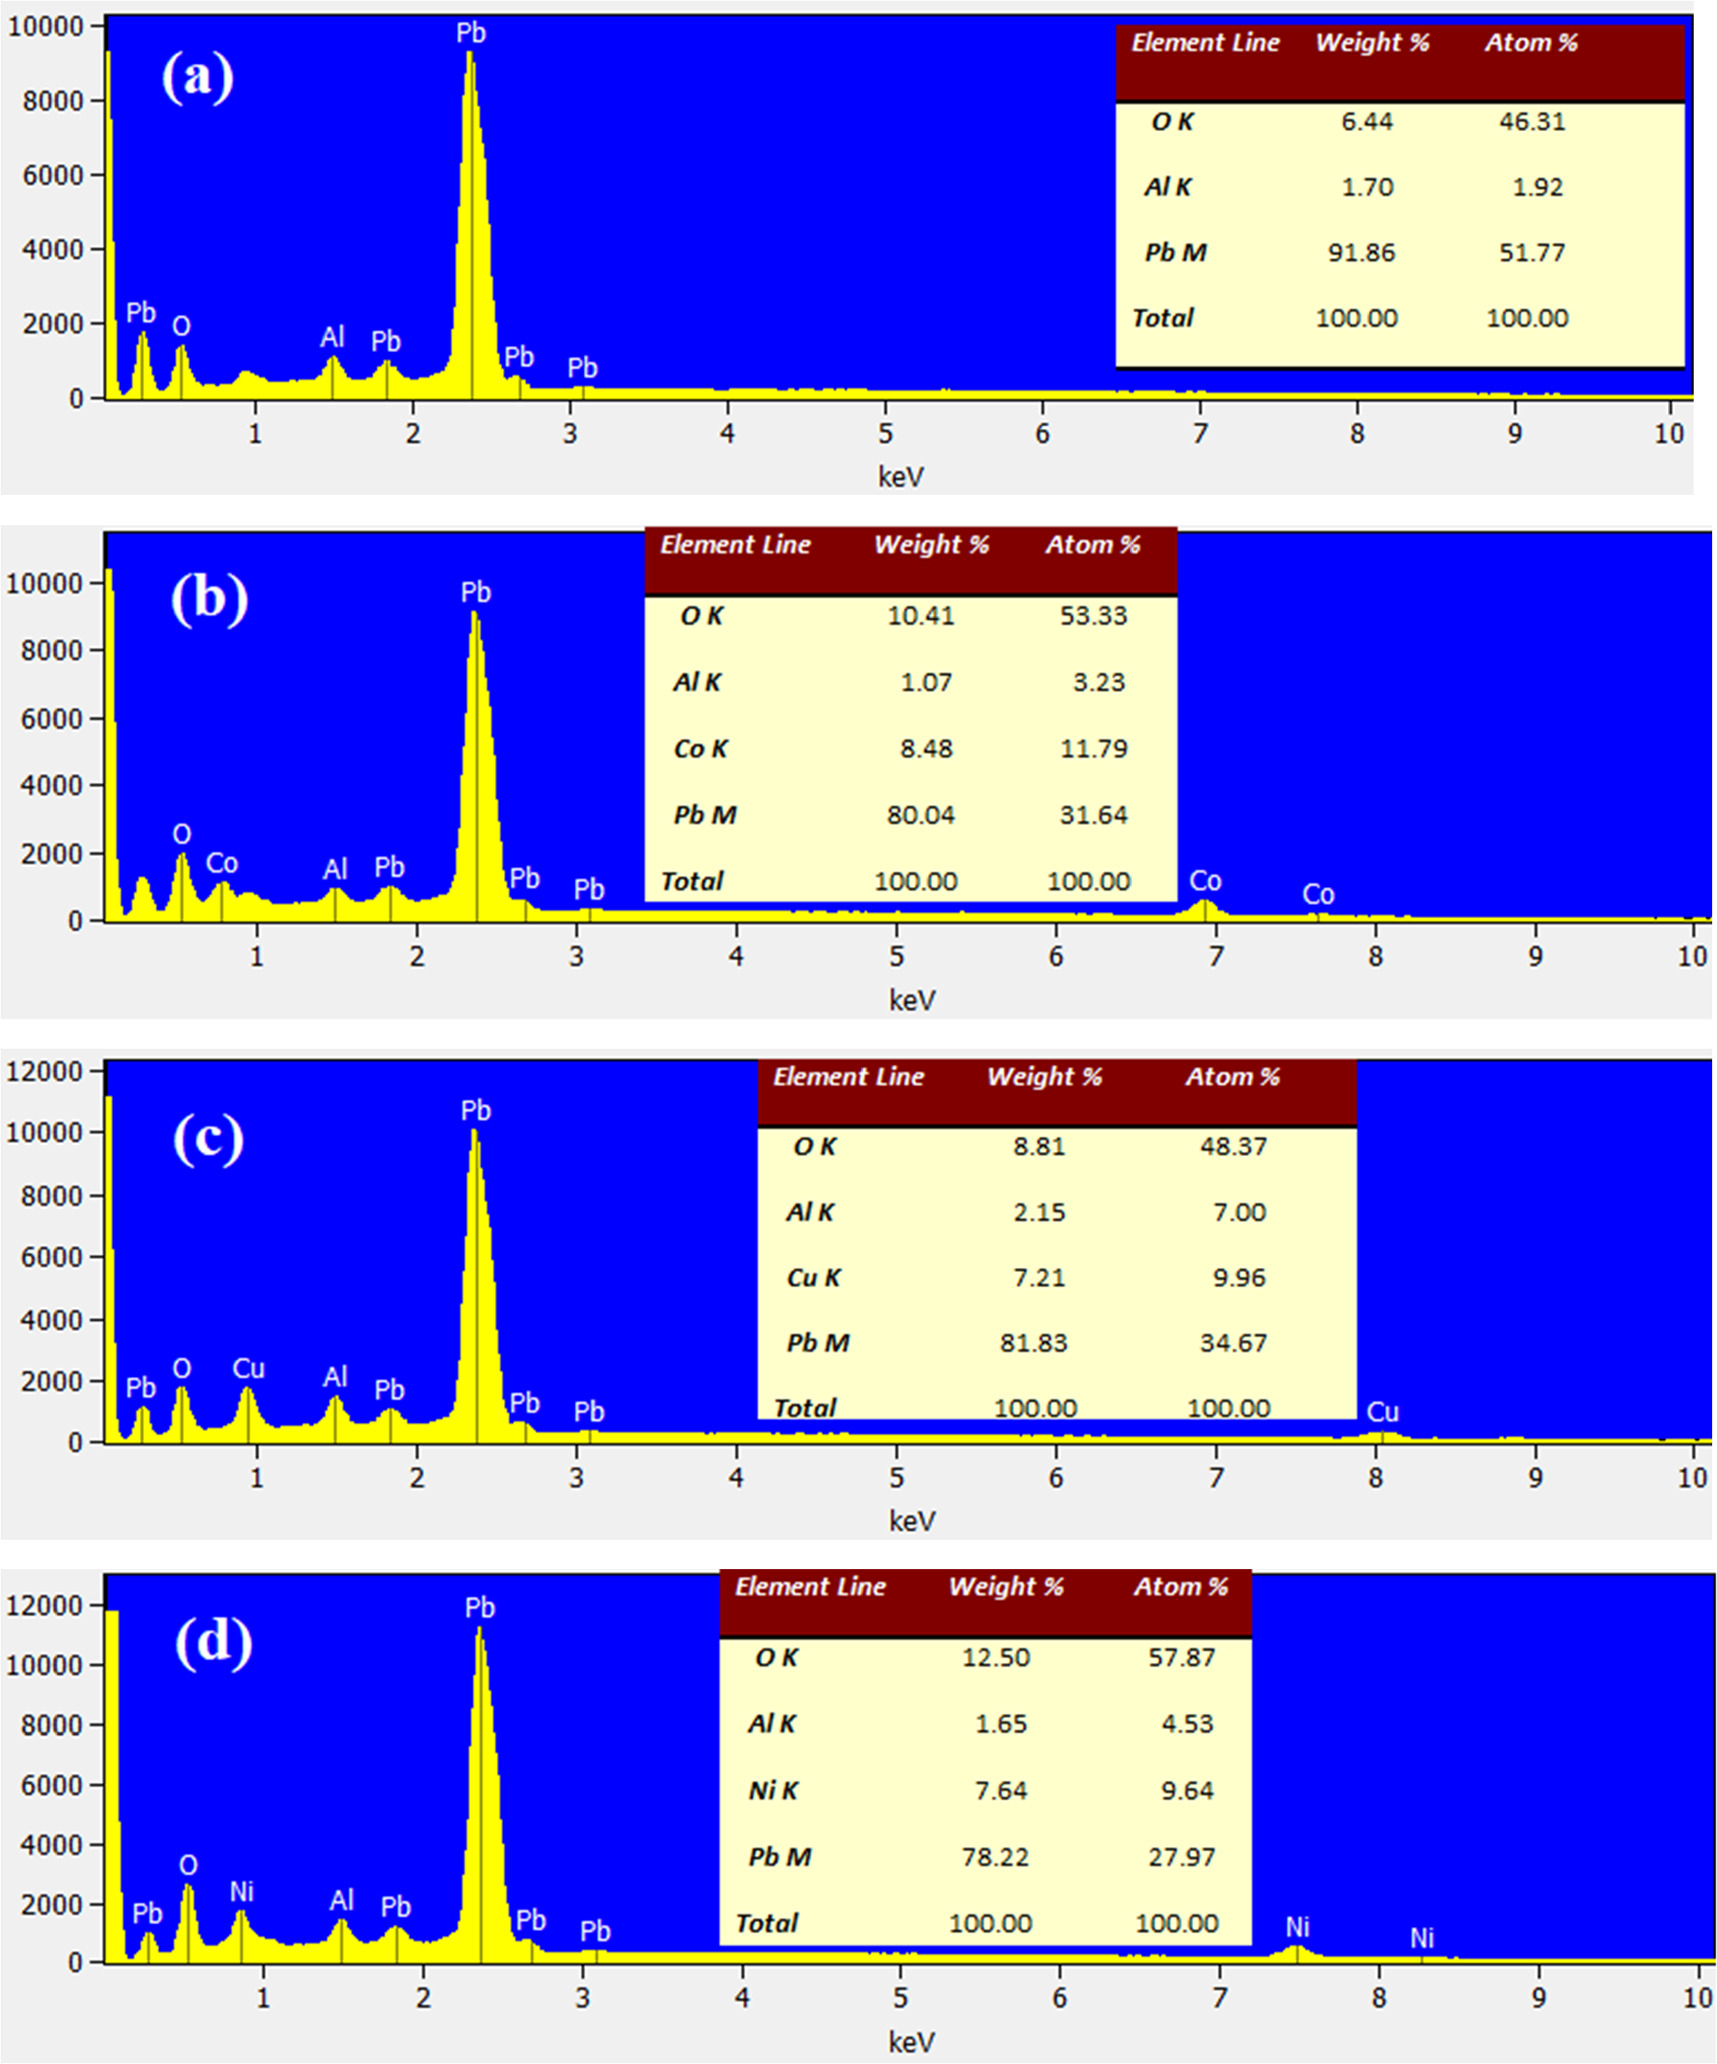
Figure 8. The EDX spectrum of (a) undoped, (b) Co, (c) Cu, and (d) Ni doped β-PbO NPs.
Download figure:
Standard image High-resolution image3.6. Photodegradation of Methylene blue dye
The photodegradation of methylene blue (MB) dye by using undoped and metals doped β-PbO as photocatalysts is carried out under the irradiation of visible light. The photocatalytic activity of pristine β-PbO and metals doped β-PbO was investigated under the same condition. Figure 9 shows the absorption spectra of MB dye at different time intervals while the presence of photocatalysts under visible light irradiation. The absorption characteristics peaks of MB dye at 664 nm were considered to monitor the photocatalytic degradation efficiency of pristine and metals doped β-PbO nanoparticles. The absorption peak emerged around 300 nm is the absorption corresponds to benzene ring, whereas the 664 nm absorption peak is correspond to the heteropoly aromatic MB dye linkage [31]. It can be observed that at a maximum wavelength of 664 nm, the absorbance progressively decreases as irradiation time increases. This shows that the MB dye is successfully decolorizing on the surfaces of photocatalysts with increasing time in 20 min intervals until 80 min reached. Figure 10 shows the decolorization of MB dye in the presence of Co-doped β-PbO at different irradiation times. The decrease in absorption intensity of MB dye centered at 664 nm in the presence of photocatalysts is due to the loss of chromophoric groups, which are responsible for its color [32]. It is evident from figures 9(a)–(f) that all metal doped β-PbO showed enhanced photocatalytic activity toward the degradation of MB dye compared to pristine β-PbO. The concentration of photoinduced holes and electrons increases due to the induced impurity levels in the doped β-PbO the concentration of photogenerated electrons and holes increases, thereby improving the photocatalytic performance of β-PbO. The photodegradation efficiency of undoped and metals doped β-PbO is calculated by equation (5) [33]:

where C0 is MB dye absorption before illumination and C is MB dye absorption after light illumination at different times.
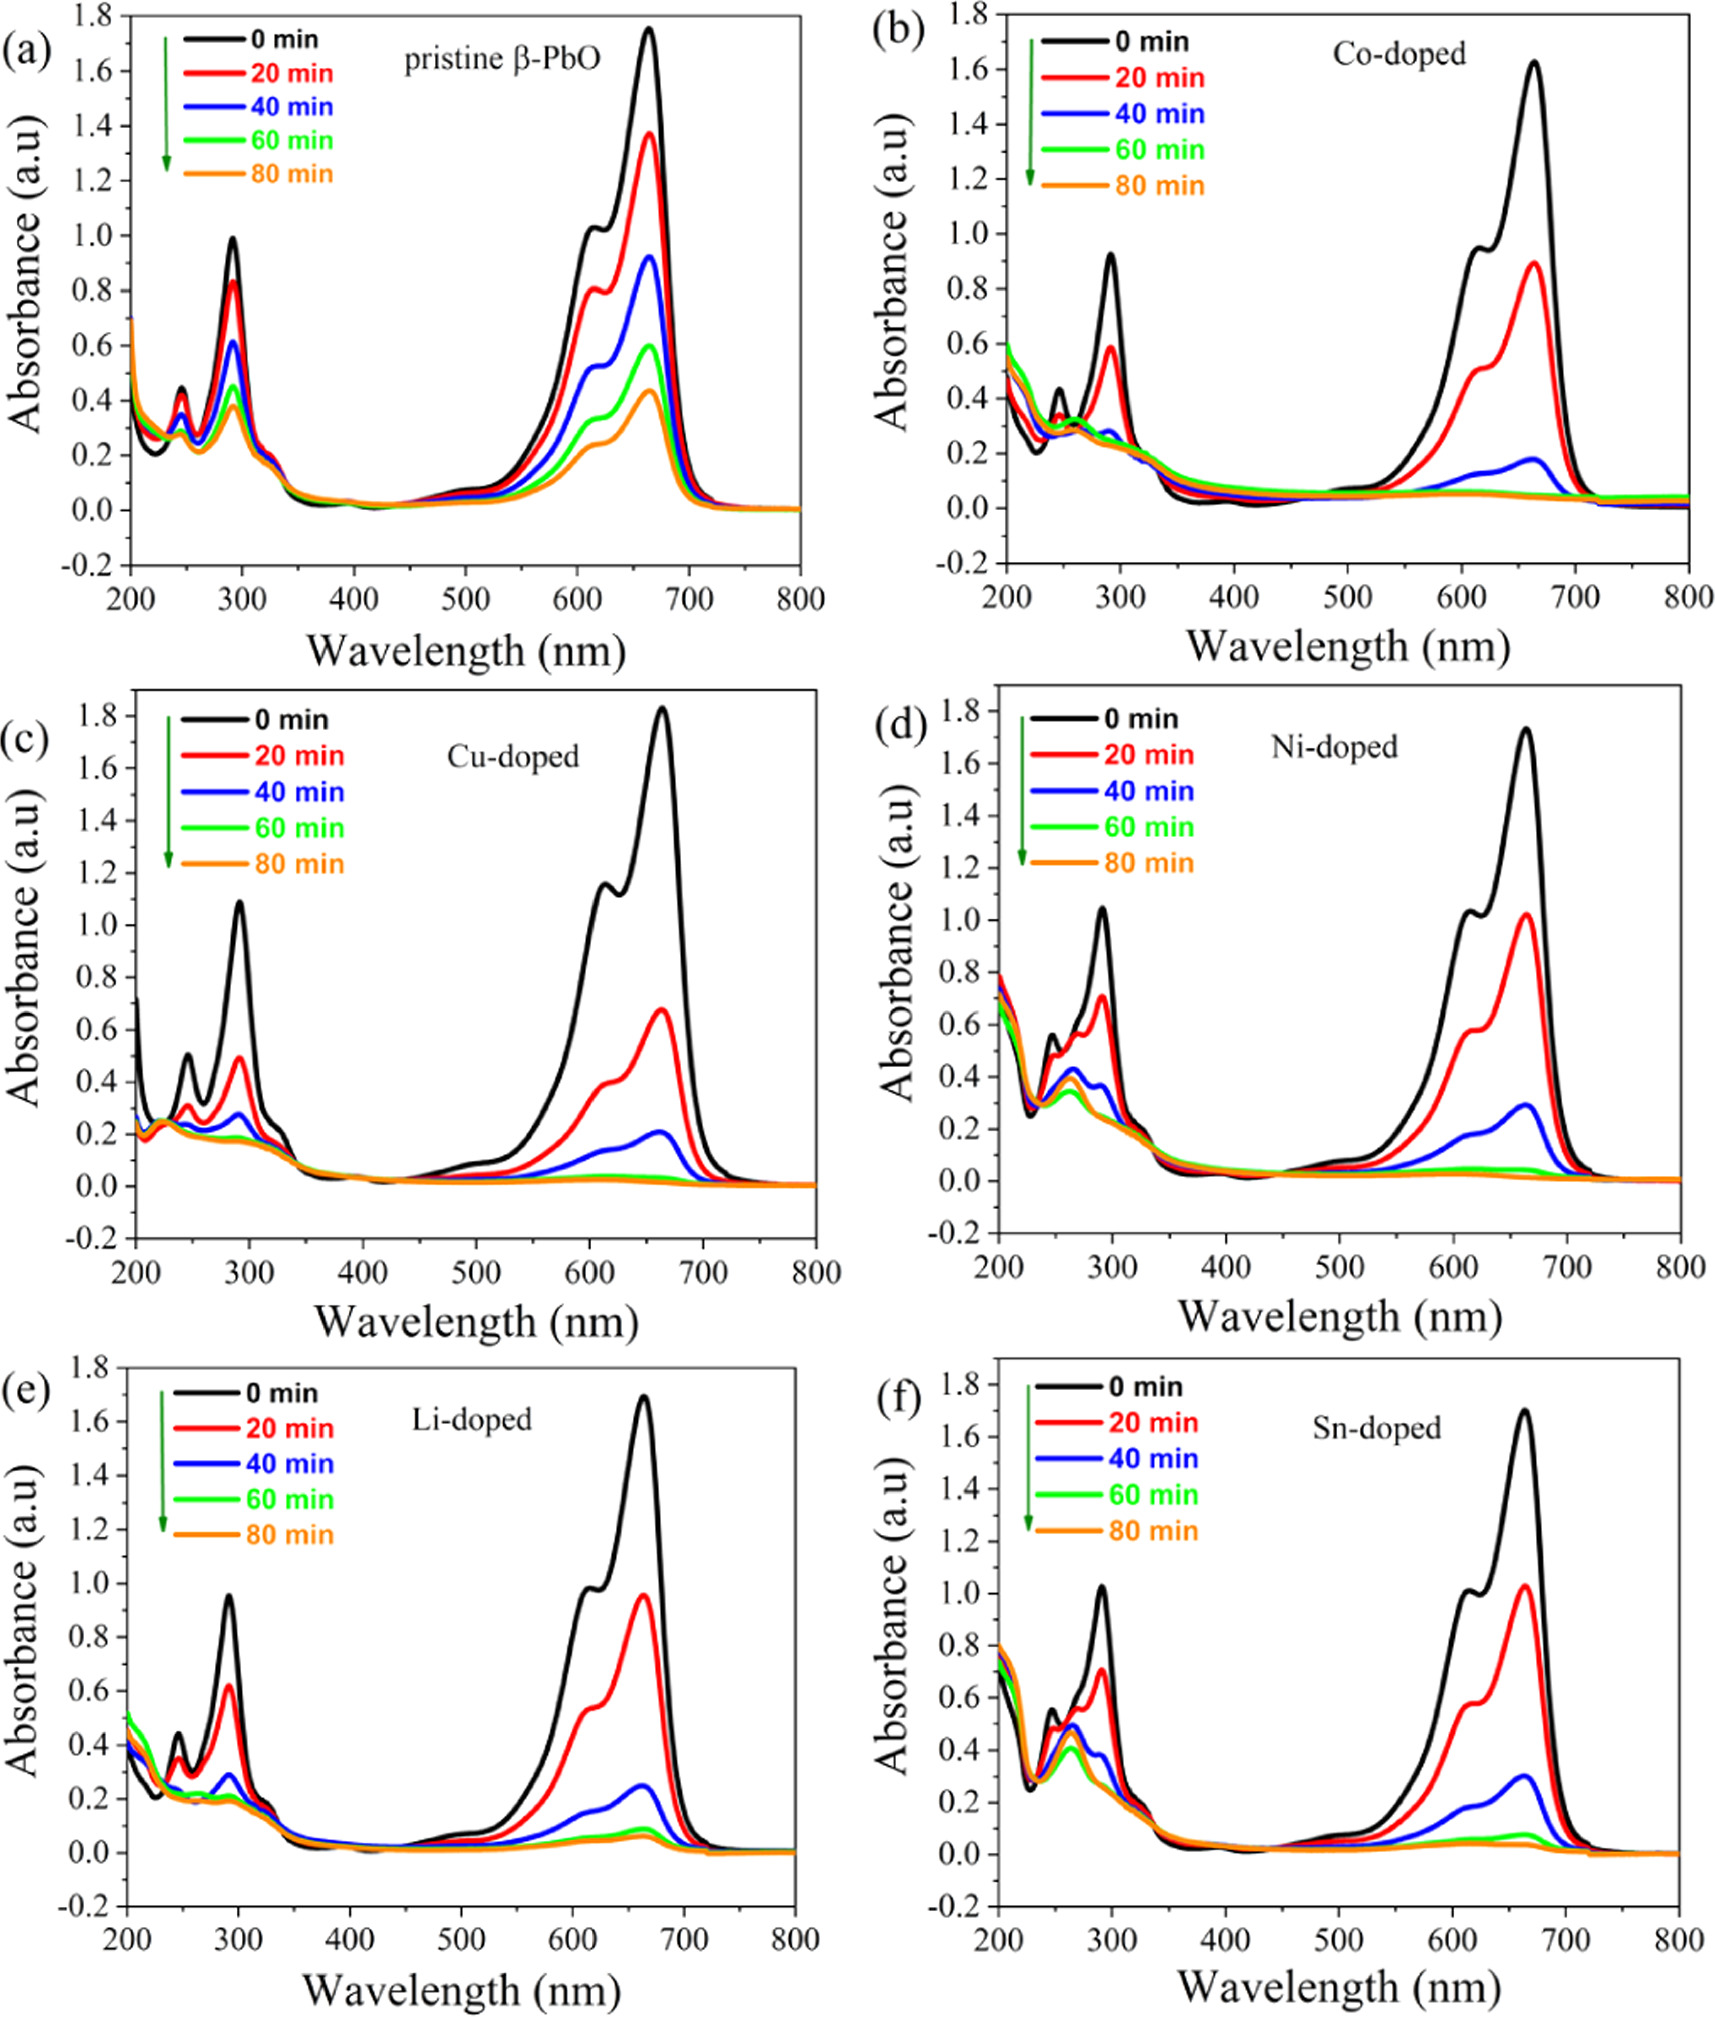
Figure 9. The absorption spectra of methylene blue dye at different irradiation time in the presence of (a) undoped β-PbO, (b) Co, (c) Cu, (d) Ni, (e) Li, and (f) Sn doped β-PbO.
Download figure:
Standard image High-resolution image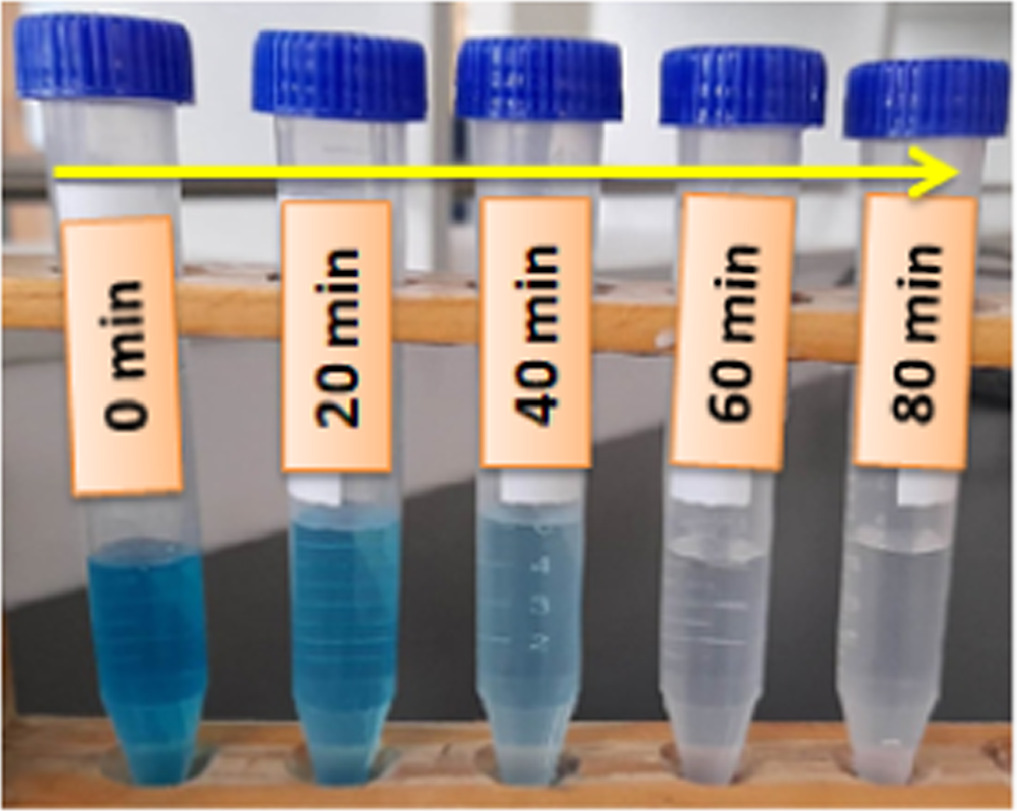
Figure 10. Methylene blue dye decoloration in the presence of Cu doped β-PbO.
Download figure:
Standard image High-resolution imageAfter doping, the photocatalytic activity is enhanced in all doped photocatalysts. Figure 11(a) shows the photodegradation efficiency of undoped and metals doped β-PbO at different irradiation time intervals. The photocatalytic activity trend for metals doped β-PbO for the degradation of MB dye lies in the order: Cu doped β-PbO > Co doped β-PbO > Ni doped β-PbO > Sn doped β-PbO > Li doped β-PbO, respectively, showing Cu-doped β-PbO with highest photocatalytic activity. Thus, as explained in PL analyses, when the PL intensity increases the recombination rate increases and the photocatalytic activity of samples decreases and vice versa. Pristine β-PbO affords 75.13% degradation after 80 min of irradiation, while all doped β-PbO with similar doping content (0.1 M) showed enhanced photocatalytic activity under similar conditions. The enhanced photocatalytic activity after doping may be attributed to bandgap narrowing, higher carrier concentrations, reduction of carrier recombination rate, and higher surface area than pristine β-PbO. Doping of β-PbO nanoparticles with different metals leads to the creation of intermediate energy states, which reduces the recombination of photogenerated charge carriers due to enhancing the charge separation sufficiently, thereby improving photocatalytic activity. Thus, dopants present in β-PbO can act as electron and hole trapping to reduce the recombination of photogenerated electrons and holes. The reduction of dopant ions on the surface of β-PbO can also be attributed to the improved photocatalytic performance of metals doped β-PbO. Consequently, when dopants are absorbed on the surface of β-PbO, they can absorb or release electrons which can support charge separation and shows enhanced photocatalytic activity by scavenging electrons by oxygen at the surface. For instance, Li is monovalent, and it accepts one electron to be reduced to a Li atom which supports the charge separation and acts as a reduction site. The enhanced photocatalytic activity of metal-doped β-PbO compared to pristine β-PbO can also be due to lighter harvesting in the visible region, which facilitated sufficient energy for the degradation of MB dye. Morphology of the synthesized nanoparticles may also have effects on the photocatalytic performance of β-PbO. After metal doping the morphology of pristine β-PbO is changed specifically in Co, Ni, and Cu doped β-PbO. Particle size distribution is also reduced in the doped nanoparticles. The pristine β-PbO nanoparticles are agglomerated and formed interconnected flake-like morphologies and its surface is smooth, which decreases the amount of dye adsorbed onto its surface. If the MB dye adsorbed onto the photocatalyst surface reduced the photodegradation efficiency is low. In metals doped the surface of nanoparticles is rough with porosity and small size particle distribution is observed. Thus, the MB dye sufficiently adsorbed on the surface of photocatalysts, thereby enhanced photocatalytic performance. In Li doped β-PbO the particles morphology is almost similar pristine β-PbO, but unlike pristine β-PbO the surface of particles is rough and able to adsorb MB dye. Furthermore, the comparative of photodegradation efficiency of our work with other catalysts is provided in table 3.
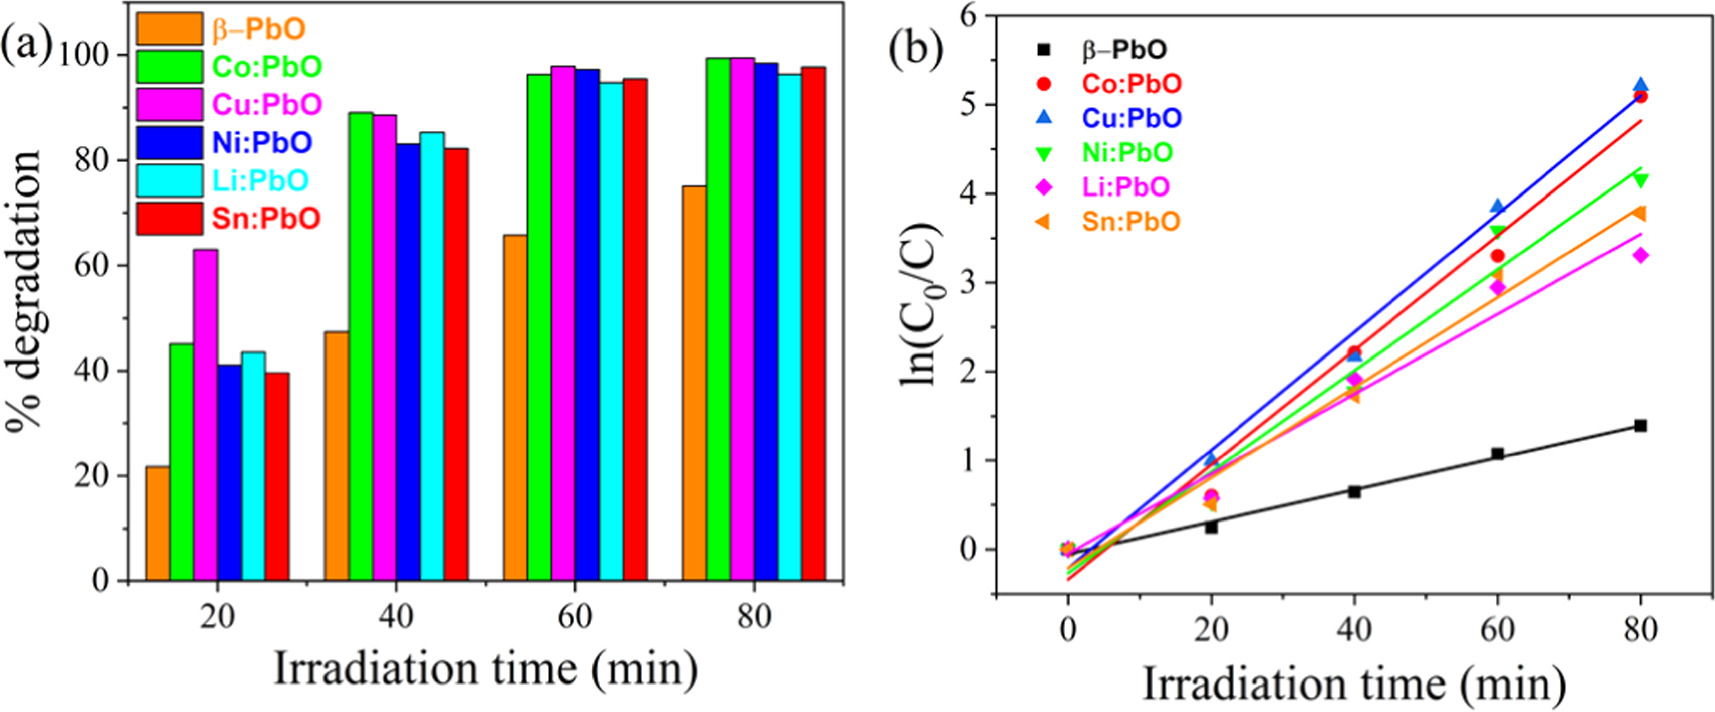
Figure 11. (a) Bar diagram of photodegradation of MB dye at different irradiation time under the irradiation of visible light by using undoped, Co, Cu, Ni, Li and Sn doped of β-PbO photocatalysts; (b) the plots of pseudo-first-order kinetics in the presence of undoped and metals doped β-PbO.
Download figure:
Standard image High-resolution imageTable 3. The photodegradation efficiency comparison of the present study with other photocatalysts.
| Catalysts | Synthesis method | Organic pollutant | Light | Reaction time | Degradation efficiency (%) | References |
|---|---|---|---|---|---|---|
| Pristine β-PbO | Precipitation | MB dye | Visible light | 80 min | 75.13 | Present study |
| Cu-doped β-PbO | Precipitation | MB dye | Visible light | 80 min | 99.45 | Present study |
| Pristine α-PbO | Co-precipitation | MB dye | Visible light | 100 min | 94.76 | [19] |
| Cu-doped α-PbO | Co-precipitation | MB dye | Visible light | 100 min | 98.50 | [19] |
| Ni doped PbO | Hydrothermal | MB dye | Visible light | 180 min | 91.11 | [12] |
| TiO2 | --- | MB dye | UV light | 3 h | 97% | [35] |
| Zrand Ag co-doped TiO2 | Sol–gel | MB dye | Visible light | 30 min | 95 | [36] |
| ZnO | Precipitation | MB dye | Solar light | 120 min | 38. 63 | [37] |
| Sb-doped ZnO | Sonochemical | MB dye | Solar light | 120 min | 91.22 | [37] |
| magnetized TiO2-SiO2 | Sol–gel | MB dye | LED lamp | 75 min | 97.66 | [38] |
| g-C3N4/Cu2O | --- | MB dye | Visible light | 120 min | 81 | [39] |
| ZnO/CuO | Pechin | MB dye | Solar light | 120 min | 93 | [40] |
| CuO-NaBH4 | Precipitation | MB dye | UV light | 10 min | Total degradation | [41] |
| Zn-doped TiO2 | Sol–gel | MB dye | Visible light | 60 min | 99.64 | [42] |
The photocatalytic degradation of MB dye could be fitted well suggesting pseudo-first-order kinetics. The degradation rate constant MB dye was determined by using equation (6) [34]:

where k is rate constant, and t is time of irradiation
The rate constant  is obtained from slope of lnC0/C versus time. Figure 11(b) illustrates the linear regression curve fit of the natural logarithm for the concentration of MB dye at different irradiation times. The rate constant and correlation coefficient of undoped and metals doped β-PbO are shown in table 4. It can be observed that the rate constants of different metals doped β-PbO was higher than that of pristine β-PbO nanoparticles and followed the photocatalytic activity trend as mentioned above, with the highest value for Cu-doped β-PbO nanoparticles. Materials with high rate constant have high photodegradation efficiency. The MB dyes half-life while it irradiated during the presence of undoped and metals doped β-PbO is given in table 4.
Table 4. k, correlation coefficient (R2) and half-life time for the photodegradation of MB dye with different photocatalysts.
| photocatalysts | k (min−1) | R2 | MB dye half-life (min) |
|---|---|---|---|
| undoped β-PbO | 0.01805 ± 8.77509E-4 | 0.99 | 38.44875346 |
| Co:β-PbO | 0.06443 ± 0.00552 | 0.98 | 10.77137979 |
| Cu:β-PbO | 0.06637 ± 0.00357 | 0.99 | 10.45653157 |
| Ni:β-PbO | 0.0569 ± 0.00612 | 0.97 | 12.19683656 |
| Li:β-PbO | 0.04495 ± 0.0046 | 0.97 | 15.43937709 |
| Sn:β-PbO | 0.05072 ± 0.00425 | 0.98 | 13.6829653 |
3.6.1. pH effect and reusability
In heterogeneous photocatalysts, the pH of the reaction mixture plays a great role because the surface charge properties of photocatalysts and the adsorption properties of organic pollutants on the surface of photocatalysts can be dictated [32]. The effect of pH on the degradation of MB dyes in the presence of pristine β-PbO was examined in pH 4, 6, 8, and 10, as shown in figure 12(a). The degradation efficiency increases with increasing pH values, and the highest degradation efficiency is attained at pH 10 after 80 min. It is why we carried out the pH of the suspension to 10 throughout all photocatalysis experiments. The increased degradation efficiency under alkaline pH could be expressed based on electrostatic attraction between the cation MB dye and anion photocatalysts, which facilitates the adsorption of MB dye on the surface of photocatalysts. The reusability of the photocatalysts experiment was carried out by selecting Cu-doped β-PbO by reusing the photocatalyst for three consecutive cycles. Before applying for the next cycle, the photocatalyst was washed with distilled water and ethanol thoroughly to remove impurities and dried in an oven at 100 °C for 5 h. As shown in figure 12(b), even after three cycles, it showed degradation efficiency greater than pristine β-PbO. The loss of the original degradation efficiency during recycling is due to the loss of some amount of photocatalyst while washing and drying.
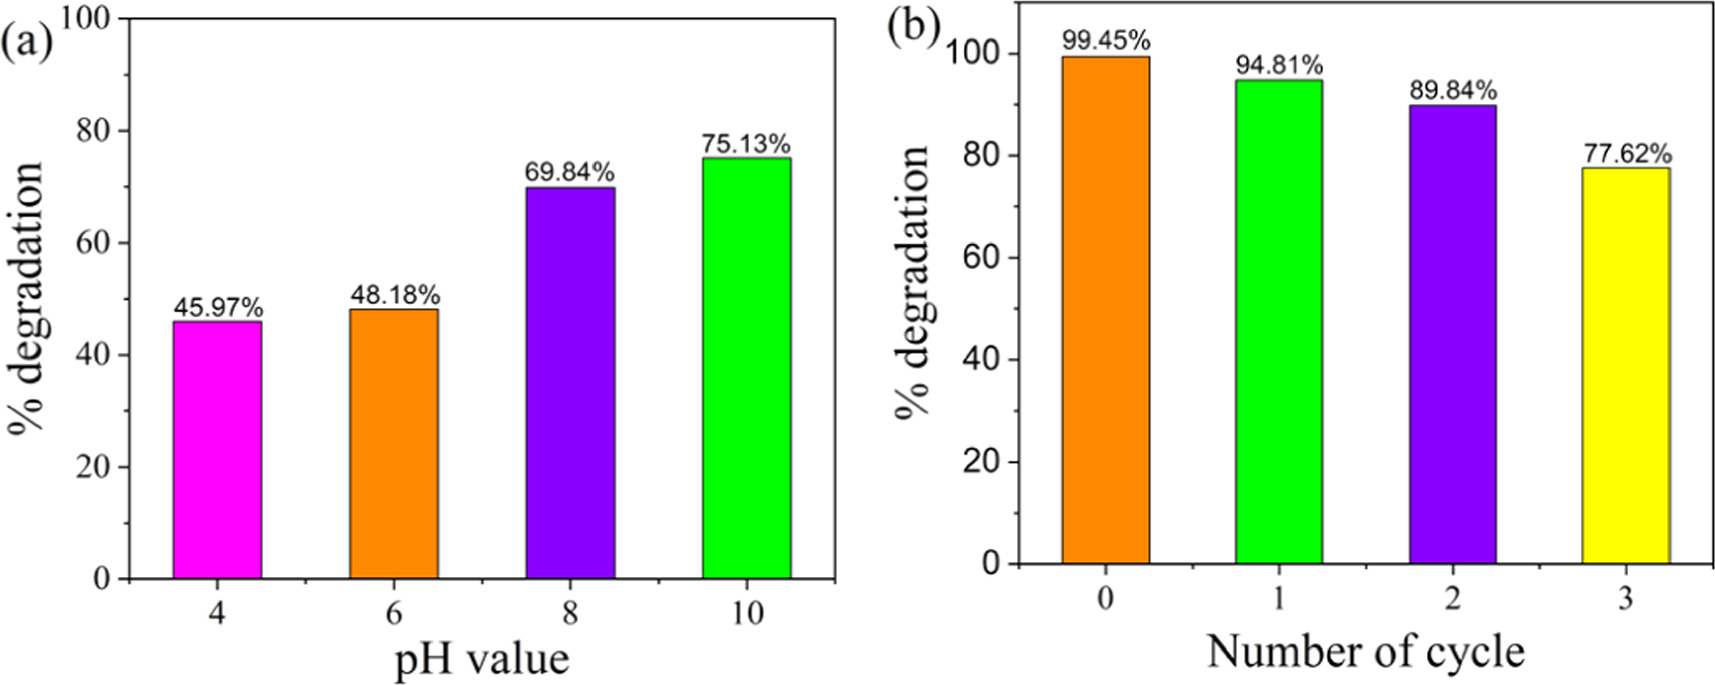
Figure 12. (a) pH effect on the photodegradation of MB dye in the presence of pristine β-PbO; (b) the reusability test of Cu-doped β-PbO for the photodegradation of MB dye.
Download figure:
Standard image High-resolution image3.6.2. Trapping experiment and MB photodegradation mechanisms
To ascertain the major reactive species involved in the degradation of MB dye using Co-doped β-PbO nanoparticles, a series of radical species trapping experiments have been employed. Disodium ethylenediaminetetraacetate (EDTA-2Na), ascorbic acid (AA) and isopropyl alcohol (IPA), and have been to trap holes ( ), superoxide anion and hydroxyl radical (
 ) radical (
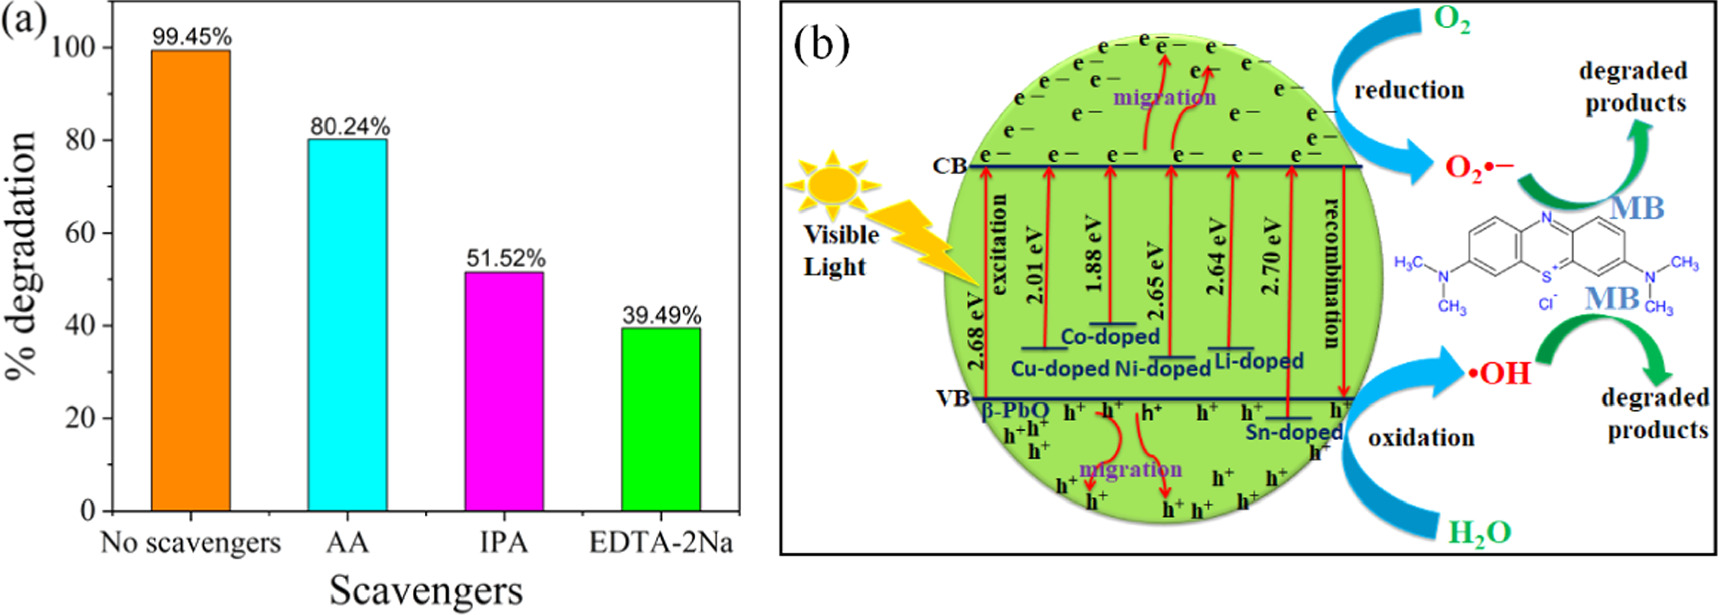
 ), respectively. Zhou et al [43] used the same scavengers to determine the active species participate in the degradation of tetracycline over the Z-scheme AgI/(Na,F)–C3N4 composites. Figure 13(a) presents the percent degradation of MB dye in the presence of different scavengers using Co-doped β-PbO nanoparticles under visible light irradiation within 80 min. The figure indicates that the scavengers-free photodegradation process exhibited maximum degradation efficiency, whereas the photodegradation in the presence of scavengers shows a decreased degradation percentage. The result indicates that the EDTA-2Na and IPA-assisted photocatalytic system exhibits a low percent of degradation with the EDTA-2Na assisted shows much more low percent of degradation than IPA. Thus, hydroxyl radicals and holes play a great role in the degradation of MB dye with holes being actively involved in the degradation process. However, the photodegradation of MB dye is slightly reduced, while the addition of AA indicates that O2•− involves a minor role in the degradation of MB dye. Based on the abovementioned results and reported literature, a possible photocatalytic mechanism for MB dye degradation over undoped β-PbO and metals doped β-PbO photocatalysts under the irradiation of visible light is proposed and presented in figure 13(b). The synthesized materials have bandgap that lies in the visible region which can response the visible light irradiations. However, the bandgap of different metals doped β-PbO decreased compared to pristine β-PbO except slight increase in Sn-doped β-PbO. This is due to the impurity level of dopants that were introduced to narrow the bandgap of pristine β-PbO, which contributed to improving the photocatalytic performance of β-PbO NPs. When the prepared photocatalyst absorbs energy equal to or greater than its bandgap, the electron gets sufficient energy to be excited from the valence band (VB) of the prepared photocatalysts to the conduction band (CB) of the photocatalyst and simultaneously leaving holes (vacancy) in the VB of photocatalysts. Thus, photoinduced holes and electrons are created. In the pristine β-PbO, the photogenerated electron–hole pairs recombine rapidly, hence decreasing the photocatalytic activity of pure β-PbO nanoparticles. In metal doping β-PbO, the photogenerated electrons can be trapped by the dopant that serves as electron trapping, and the photogenerated electrons and holes are separated well. The photogenerated electrons (
 would produce
  by reacting with oxygen. Meanwhile, holes (
 in the VB would undergo charge transfer to the water molecules or hydroxyl group adsorbed on the surfaces of photocatalysts and produces
  The generated radicals and holes during the photocatalysis process would react with MB dye molecules adsorbed on the surfaces of photocatalysts, and the MB dye could be successfully degraded. The degraded byproducts such as H2O and CO2 formed during the reaction between active species and MB dyes are non-harmful.
Figure 13. (a) The effects of AA, IPA and EDTA-2Na scavengers on the photodegradation of MB dye in the presence of Cu-doped β-PbO photocatalyst; (b) Bandgap energy diagram of undoped, Cu, Co, Ni, Li and Sn doped β-PbO photocatalysts and the mechanisms of photodegradation of MB dye.
Download figure:
Standard image High-resolution image
The photodegradation process can be given by the following reactions:


4. Conclusion
Photocatalytic degradation of organic pollutants by using semiconducting oxides has attracted great attention in current time. In this work, pure β-PbO and metals (Co, Cu, Ni, Li, and Sn) doped β-PbO NPs are synthesized via chemical precipitation and characterized by different characterization techniques. The XRD results of pristine and metals doped β-PbO showed a high purity β-PbO phase. The XRD patterns showed shifts in doped materials compared to pristine β-PbO, which is attributed to the shrinks and extension of the lattice constants. From UV–vis DRS analysis, the obtained band gap was 2.68 eV, 1.88 eV, 2.01 eV, 2.65 eV, 2.64 eV, and 2.70 eV for undoped, Co, Cu, Ni, Li, and Sn doped β-PbO, respectively. In the doped materials, the lowest PL emission peak intensity shows the lowest photogenerated electrons and holes recombination, thereby enhancing photocatalytic performance. The SEM micrograph morphology analysis showed the non-uniformly distributed particles. The morphology of undoped β-PbO showed a smooth surface, whereas in metals doped rough surfaces were revealed. EDX analysis confirmed the presence of the expected elements in both undoped and metal-doped NPs compositions. The photocatalytic performance of the doped materials exhibited significant enhancement upon the introduction of different metals into β-PbO. After 80 min of irradiation, the doped photocatalysts achieved degradation efficiencies of 99.45%, 99.39%, 98.44%, 96.34%, and 97.71% for Cu, Co, Ni, Li, and Sn-doped β-PbO, respectively. In contrast, pristine β-PbO only achieved a degradation efficiency of 75.13% under the same irradiation time. Several factors contribute to the enhanced photocatalytic activity of β-PbO through metal doping, including increased surface roughness, narrowing of the band gap, creation of impurity states, increased specific surface area, elevated carrier concentration, and reduced carrier recombination in the catalysts.
Acknowledgments
We acknowledge Oda Bultum University and Adama Science and Technology University for their materials support. Dr Fekadu Gashaw acknowledges financial support from Addis Ababa University through thematic research project Grant number: Ref. LT/PY-242/2021.
Data availability statement
All data that support the findings of this study are included within the article (and any supplementary files).