
Abstract
Layered hybrid perovskites (LPKs) are promising as alternatives or additives to 3D metal halide perovskites for optoelectronic applications including photovoltaic cells, LEDs and lasers due to their increased stability. However, high exciton binding energies in these materials mean that excitons are the majority species under the operating conditions of many devices. Although the efficiency of devices that incorporate LPKs has been increasing, much is still unknown about the interplay of excitons and free charge-carriers in these materials, which is vital information for understanding how optoelectronic properties dictate device efficiency. In this work, we employ optical pump/THz probe spectroscopy (OPTP) and visible transient absorption spectroscopy (TAS) to analyse the optoelectronic properties and charge-carrier dynamics of phenylethylammonium lead iodide (PEA)2PbI4. By combining these techniques, we are able to disentangle the contributions from excitons and free charge-carriers. We observe fast cooling of free charge-carriers and exciton formation on a timescale of ∼400 fs followed by slower bimolecular recombination of residual free charge-carriers with a rate constant k2 ∼ 109 cm3s−1. Excitons recombine via two monomolecular processes with lifetimes t1 ∼ 11 ps and t2 ∼ 83 ps. Furthermore, we detect signatures of exciton–phonon coupling in the transient absorption kinetic traces. These findings provide new insight into the interplay between free charge-carriers and excitons as well as a possible mechanism to further understand the charge-carrier dynamics in LPKs.
Export citation and abstract BibTeX RIS

Original content from this work may be used under the terms of the Creative Commons Attribution 4.0 licence. Any further distribution of this work must maintain attribution to the author(s) and the title of the work, journal citation and DOI.
1. Introduction
Layered hybrid perovskites (LPKs) have emerged as a viable solution to the long term stability issues that affect their prototypical counterparts, three-dimensional (3D) metal halide perovskites [1–6]. LPK is a term used to describe a range of quasi-2D, pervoskite-like structures containing alternating layers of metal halide octahedra and larger organic cations such as phenylethylyammonium (PEA+) or butlyammonium (BA+). The most widely studied structures are the Ruddlesden-Poppper phase LPKs with the general formula, A'2An−1BnX3n+1 (where A' = bulky organic cation such as PEA+ or BA+; A = small organic cation such as methylammonium; B = Pb2+, Sn2+ or other metal cation; and X = halide) [7]. These structures are comprised of layers of corner-sharing metal halide octaherda sandwiched between bilayers of the bulky organic spacer cations as shown in figure 1 for a typical n = 1 structure (i. e. a structure with no small organic cation). The metal halide layers are electrostatically attracted to the bulky organic cations, whilst these bulky spacers interact with each other via van der Waals forces [7].
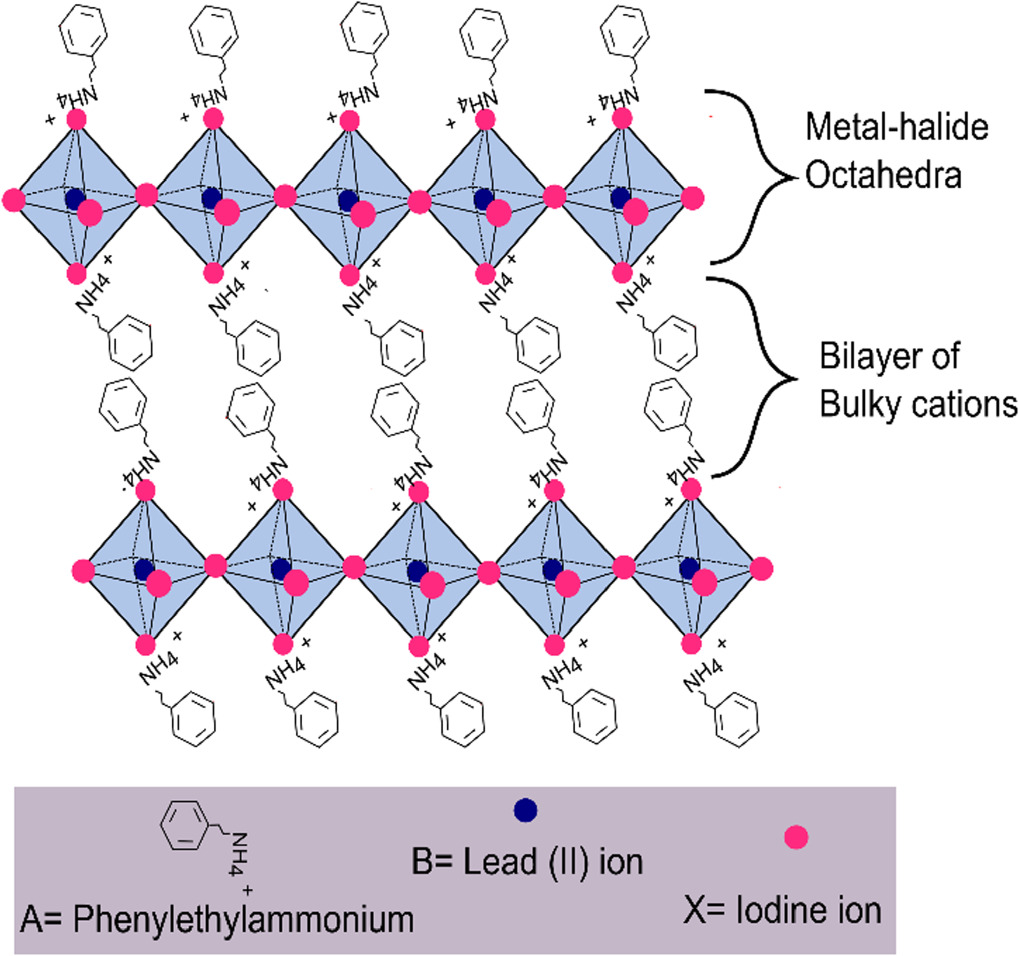
Figure 1. Structure of phenylethylammonium lead iodide (PEA)2PbI4.
Download figure:
Standard image High-resolution imageWhile the addition of large, hydrophobic cations in LPKs is key to their improved stability [1, 8, 9], their inclusion significantly changes the LPK's optoelectronic properties compared to 3D perovskites. Due to both an energy level and dielectric mismatch between insulating layers of the organic cations (εorganic ≈ 2) and the metal halide layers (εperovskite ≈ 3), they form natural quantum well-like structures, which lead to confinement effects [10–13]. As a result, LPKs exhibit exciton binding energies (Eb) as high as 270 meV [14] compared to 3D perovskites which have exciton binding energies ranging from 2 to 62 meV [15–18]. The ratio of free charge-carriers to excitons has been estimated for the popular Ruddlesden–Popper LPK (PEA)2PbI4 using the Saha equation; assuming an excitation density of 1018 cm−3, the calculated fraction of excited states that exist as free carriers is only ≈ 1%, suggesting that the dominant excited state species present are excitons rather than free carriers [19, 20]. It is also important to note that the exciton fraction is a function of carrier density, and decreases to 50% for an excitation density of about 1014 cm−3 [20]. For context, solar cells under AM 1.5 conditions have lower carrier densities at 1015–1016 cm−3 [21] but higher carrier densities of 1015 cm−3 or greater are required for applications in LEDs and lasing [22]. Furthermore, the accuracy of the Saha equation is questioned for layered perovskites in a recent work Motti et al which found discrepencies between the free charge-carrier density predicted by the Saha equation and the experimentally obtained photoconductivity results [23].
Due to excitonic effects, LPKs have higher recombination rates that result in their diffusion lengths being much shorter (i.e. 60 nm [10]) compared to 3D perovskites (1–3 μm) [24, 25]. This presents an issue when adapting LPKs into the planar device structures used in solar cells, as diffusion lengths of several hundreds of nanometers are required [26, 27]. As a result, LPK-based solar cells have much lower power conversion efficiencies (ranging from 12%–17.8%) [8, 28–31] compared to cells incorporating 3D perovskites (25%) [32, 33] due to their poorer optoelectronic and charge transport properties [1, 34–37]. However, work done to control crystal orientation such as processing techniques [8, 38], solvent selection [39, 40], additive usage [41, 42] and cation engineering [28, 43, 44] has allowed efficiencies to reach 21% in the formamidinium (FA) based LPK ((4FPEA)2(FA)4Pb5I16, n = 5) giving hope that these limitations can be overcome [44]. Nevertheless, more work is required to understand charge-carrier dynamics and charge transport mechanisms to reach the Schockley - Queisser limit (33.7%) [45]. Additionally, LPKs have shown to be a promising material for light-emitting diodes (LEDs) due to their quantum-well structure, high exciton binding energy, and high PL quantum yields (PLQYs) [46]. For more information on the development of LPKs for devices, the reader is referred to detailed review articles on the topic [7, 47, 48].
Studying the charge-carrier dynamics and the role of excitons in LPKs is pivotal in realising their full potential in commercial applications. However, important questions remain about the nature of excitons and free carriers in these materials. Although the interplay between free charge-carriers and excitons has been explored previously in LPKs and other excitonic perovskite systems, there is still not a consensus in the field on the underlying mechanisms of carrier generation and relaxation. Additionally, a range of phenomena have been investigated, including exciton–phonon coupling, polaron formation, and the existence of biexcitons [7, 49–52]. Due to their short excited state lifetimes, these materials are often studied using ultrafast spectroscopy techniques, most commonly transient absorption spectroscopy (TAS) [7, 49–52]. One issue with this technique in particular is that the spectral features of excitons and free-carriers can overlap, making their assignment and thus the determination of operative mechanisms difficult [7, 53].
A complimentary spectroscopic technique well positioned to help disentangle these features is optical pump/terahertz probe spectroscopy (OPTP). Used to analyze many halide perovskites [7, 10, 19, 20, 54–56], it preferentially measures charged, mobile species such as free charge-carriers but is not sensitive to excitons in the same manner because they are electrically neutral, which allows for the analysis of free charge-carriers dynamics separately from excitons.
In this work, we therefore employ both OPTP and TAS to analyse the dynamics of free charge-carriers and excitons in (PEA)2PbI4. Combining both techniques allows us to unambiguously assign spectral features and dynamic processes to either excitons or free charge-carriers. Through this investigation, we observe fast carrier cooling of free carriers and exciton formation in ∼400 fs followed by slower bimolecular recombination processes. Excitons are longer lived, exhibiting two distinct monomolecular recombination pathways on timescales of ∼10 ps and ∼100 ps. Additionally, we detect the presence of carrier-phonon coupling. Overall, our findings provide a clearer picture of carrier dynamics in LPK material which will be useful for future device design and optimisation.
2. Experimental
2.1. Sample preparation
Thin films of (PEA)2PbI4 were fabricated by spin-coating onto both glass and crystalline quartz substrates for terahertz and transient absorption spectroscopy measurements, respectively.
2.1.1. Precursor preparation
For the preparation of the precursor solutions, 99.99% (trace metal basis) PbI2 and 98% tetrahydrothiophene 1-oxide (THTO) were purchased from TCI chemicals. Extra dry 99.8% dimethylformamide (DMF) and extra dry 99.5% chlorobenzene (CB) were purchased from Acros Organics. 2-Phenylethylamine (99%) was purchased from Alfa Aesar. Poly(methyl methacrylate) (PMMA) with Mw ≈ 120,000 was purchased from Sigma Aldrich.
Phenylethyl ammonium iodide (PEAI) was synthesised by adding dropwise 26 ml HI (57% wt) to 20 ml phenylethylamine in 40 ml ethanol. The white precipitate was filtered and washed with a 1:5 ethanol/diethyl ether mixture. The material was further recrystallized from ethanol and washed with diethyl ether under a nitrogen atmosphere to give white crystals with 80% yield.
To prepare the precursor solution for the OPTP measurements, 161.4 mg of PbI2 and 174.4 mg of PEAI were dissolved in 400 μL DMF/THTO (3:1). The solution was then heated at 100 °C for 1 h, cooled to room temperature, and filtered through 0.45 μm Hydrophilic PTFE filters.
To prepare the precursor solution for the TAS measurements, 0.22 M solution of (PEA)2PbI4 was prepared in solution of DMF:THTO in a 3:1 (v:v). The solution was heated at 100 °C for 1 h and left to cool to room temperature which was then filtered through a 0.45 μm hydrophilic PTFE filter.
2.1.2. Film deposition
Thin films of (PEA)2PbI4 were prepared on either quartz or glass. Both the glass and quartz substrates were cleaned with 2% solution of Hellmanex in water. They were then washed with de-ionized water, acetone, and ethanol, and finally blow-dried with compressed air. Additionally, an oxygen plasma was used to clean the substrate surface for 15 min immediately prior to the spin-coating.
Thick films for OPTP measurements were prepared on z-cut quartz by spin-coating 75 μl of the precursor solution at 3000 rpm for 45 sec, followed by annealing under N2 at 65 °C for 15 min and 100 °C for 5 min. Films were coated with PMMA by spin coating a 50 mg ml–1 solution in CB at 1000 rpm.
Thin films for transient absorption measurements were prepared on a glass substrate which was cut into 25 mm × 25 mm. 75 μl of the precursor solution was spin coated onto the glass substrate at 6000 rpm for 45 sec, followed by annealing under N2 at 65 °C for 15 min and 100 °C for 5 min. The thin films were removed from hotplate and left the cool room temperature before being coated with PMMA. The PMMA was spin coated with a 50 mg ml–1 solution in CB at 1000 rpm.
2.2. Time-resolved spectroscopy
The main time-resolved techniques used in this study are terahertz spectroscopy and transient absorption spectroscopy. As such their experimental details are discussed below. Supporting characterisation techniques were also utilised including scanning electron microscopy (SEM), x-ray diffraction (XRD), steady-state UV–vis absorption, photoluminescence (PL), and time-resolved PL. More specific information about these techniques can be found in sections S1-S4 in the supporting Information (SI).
2.2.1. Terahertz spectroscopy
The primary light source for the optical pump-terahertz probe (OPTP) setup is an ultrafast Ti:Sapphire amplifier (Newport Spectra Physics, Spitfire Ace) which generates 40 fs pulses at a repetition rate of 1 kHz and with a centre wavelength of 800 nm. A portion of this pulse was fed into an optical parametric amplifier (TOPAS Prime, Light Conversion) where the frequency mixer generates a tuneable pulse in the visible/IR spectral regions (235–15000 nm). Wavelengths of either 410 nm or 514 nm were used to photoexcite the samples directly (i.e. on the front surface and not through the substrate), with the wavelengths carefully chosen to ensure selectivity over the dominant excited state species immediately after excitation. The terahertz pulse was generated via the inverse spin hall effect using a spintronic emitter (T-spin1, TeraSpinTec, thickness 0.5 mm), excited using a portion of the original 800-nm beam [57]. At the sample position, the THz probe beam radius (σ) was 330 μm, and the beam radius for the 410 nm and 514 nm pump beams were 713 μm and 1230 μm, respectively.
THz radiation was detected via electro-optic sampling using a 2.0 mm thick  ZnTe crystal, a pair of balanced photodiodes, and a high-precision oscilloscope (Pico Technology, PicoScope 4262) for data acquisition. The terahertz and optical pump beams were chopped at 500 Hz and 250 Hz, respectively.
Using the OPTP setup, time-resolved dynamics were measured by fixing the probe delay at the peak of the THz pulse and measuring the change in THz transmission (∆T/T) as a function of the pump–probe delay time. The signal was maximised by optimising the pump and terahertz probe overlap using a GaAs reference sample. Frequency-dependent photoconductivity spectra were measured by fixing the pump–probe delay time and measuring the full THz waveform.
The same OPTP set-up was used for the terahertz time-domain spectroscopy (THz-TDS) measurements of dark THz absorption spectra. For these measurements, the optical pump beam was blocked, and a quartz substrate was used as a reference.
All measurements were performed at room temperature, in nitrogen atmosphere and in a transmission geometry.
2.2.2. Transient absorption spectroscopy (TAS)
TAS measurements used the same amplified laser system as OPTP measurements (Newport Spectra Physics, Spitfire Ace), which had a 1 kHz repetition rate and 40-fs pulses centered at 800 nm. Also similarly to OPTP, the optical excitation pulse was created using an optical parametric amplifier (TOPAS Prime, Light Conversion). The excitation pulse was modulated using a 500 Hz Chopper. For the probe, a white light continuum (330–730 nm) was generated by focusing the 800 nm beam into a vertically translating 2 mm thick CaF2 window. The probe was delayed using a gold retroreflector mounted on a delay stage that modulated the path length of the white light generation beam. Both the pump and probe pulses were spatially overlapped in a near colinear geometry, and the white light probe was then collimated and passed to a fibre-coupled spectrometer (Avantes). The sample was photoexcited at 410 nm and 514 nm with beams having sizes sigma (radius, σ) of 300 μm and 660 μm, respectively, and the white light probe (measured at 560 nm) had a sigma value of 120 μm. The measurements were performed in transmission geometry.
3. Results and discussion
3.1. Sample characterization
Thin films of (PEA)2PbI4 on quartz and glass were prepared and optimised for OPTP and TAS measurements, respectively (See Experimental - section 2.1). Both samples were then analysed using a variety of techniques to evaluate their composition, purity, and comparability. The thickness of the samples was evaluated with scanning electron microscopy (SEM), as shown in figure S1 in the supporting Information. We found that the thickness of the sample deposited on quartz was 1.8 μm (±0.36 μm) (Shown in figure S1(a)). This value is much thicker than that for the sample deposited on glass (shown in figure S1(b)), which had a thickness of 125 nm (±25 nm). The thicker film was used to optimize optical absorption and thus signal for OPTP measurements, and the thinner film was selected to avoid saturation for TAS measurements.
Past studies on LPKs have shown that their layers can often preferentially align either parallel or perpendicular to the surface of the substrate on which they are grown [1, 8, 58]. To determine the preferential orientation within our films, x-ray diffraction (XRD) measurements were performed on the (PEA)2PbI4 films on quartz and glass. Figures S2(a) and (b) show the XRD patterns of the LPK films on quartz and glass, respectively. Figure S2(c) compares the XRD pattern of (PEA)2PbI4 on quartz with the theoretical pattern modeled using single crystal data. The overlap in the XRD patterns confirms that the crystals are predominantly in the (001) orientation such that the lead-iodide octahedra layers are parallel to the substrates [10].
The composition of the LPK samples was further confirmed by analysis of their optical absorbance (UV–vis) and steady-state photoluminescence (PL) spectra as seen in figure 2 for the film on quartz. The absorption spectrum displays a strong and sharp excitonic absorption with a peak at 514 nm and a continuum absorption feature which is clearly distinguished from the exciton peak starting around 490 nm. The absorbance of the LPK sample on glass displays similar features (figure S3).

Figure 2. Steady-state absorption (black) and photoluminescence (red) spectra of (PEA)2PbI4 deposited on a quartz substrate.
Download figure:
Standard image High-resolution imageThe PL spectrum of the sample on quartz displays a sharp emission line at 530 nm, which corresponds to the excitonic emission [10, 59, 60]. For the sample on glass (figure S4), this peak is shifted to 522 nm and has a tail towards longer wavelengths. This shift is attributed to the thicker LPK film exhibiting increased photon reabsorption [61].
To determine if there are any differences in trap state population between the two films, we performed time-resolved PL measurements as described in detail in section S4 in the SI. The results reveal that the PL decays for both films have similar average lifetimes and thus indicate that the trap state populations are similar and that the films should therefore be comparible in other time-resolved measurements.
3.2. Optical pump-terahertz probe (OPTP)
To investigate free charge-carriers in (PEA)2PbI4, we performed optical pump terahertz probe (OPTP) measurements. The photoinduced differential transmission of THz radiation (∆T/T) is proportional to the photoconductivity (σ) of the film, which is in turn linearly dependent on the charge-carrier density (n) and the effective charge-carrier mobility (μ) [10, 62].
As excitons are an uncharged, bound species, they only strongly absorb THz radiation under resonance conditions [62, 63]. For (PEA)2PbI4, the exciton binding energy range is between 193–270 meV [14, 18–20, 64–67], and the corresponding resonant feature would be situated between 46.6–65.3 THz. With a bandwidth of 2–16 THz, Burgos-Caminal et al were able to observe the low frequency tail of a Lorentzian line-shape towards the higher frequency end of their measurement window which they associated with this exciton resonance [19, 55]. As we are probing with a narrower and much lower bandwidth at a relatively low frequency (0.5–3.5 THz), we expect that the excitonic feature would be far enough away from this frequency range to not observe any resonant excitonic contributions.
To confirm that we are only observing free-charge carriers and not excitons, photoconductivity spectra between 0.5–3.5 THz were obtained at excitation wavelengths of 410 and 514 nm (see SI, figure S6). In both cases, the real and imaginary photoconductivity components have a free charge-carrier (Drude-like) response that has been observed in the THz photoconductivity spectra of perovskites including MAPbI3 and LPKs [23, 55, 68]. There is also no evidence of a resonance feature, confirming that we are likely probing only a free-carrier response.
Having confirmed that our OPTP measurements are probing free carriers, we proceed by estimating the effective mobilities and analysing the charge-carrier dynamics after photoexcitation into both continuum (λexc = 410 nm) and excitonic states (λexc = 514 nm). Figure 3 shows the decay dynamics when (PEA)2PbI4 is excited at 410 nm and 514 nm at fluences ranging from 36–182 μJcm−2. Additional representations of these dynamics as well as dynamics obtained following photoexcitation at 450 nm are included in section S6 in the SI.
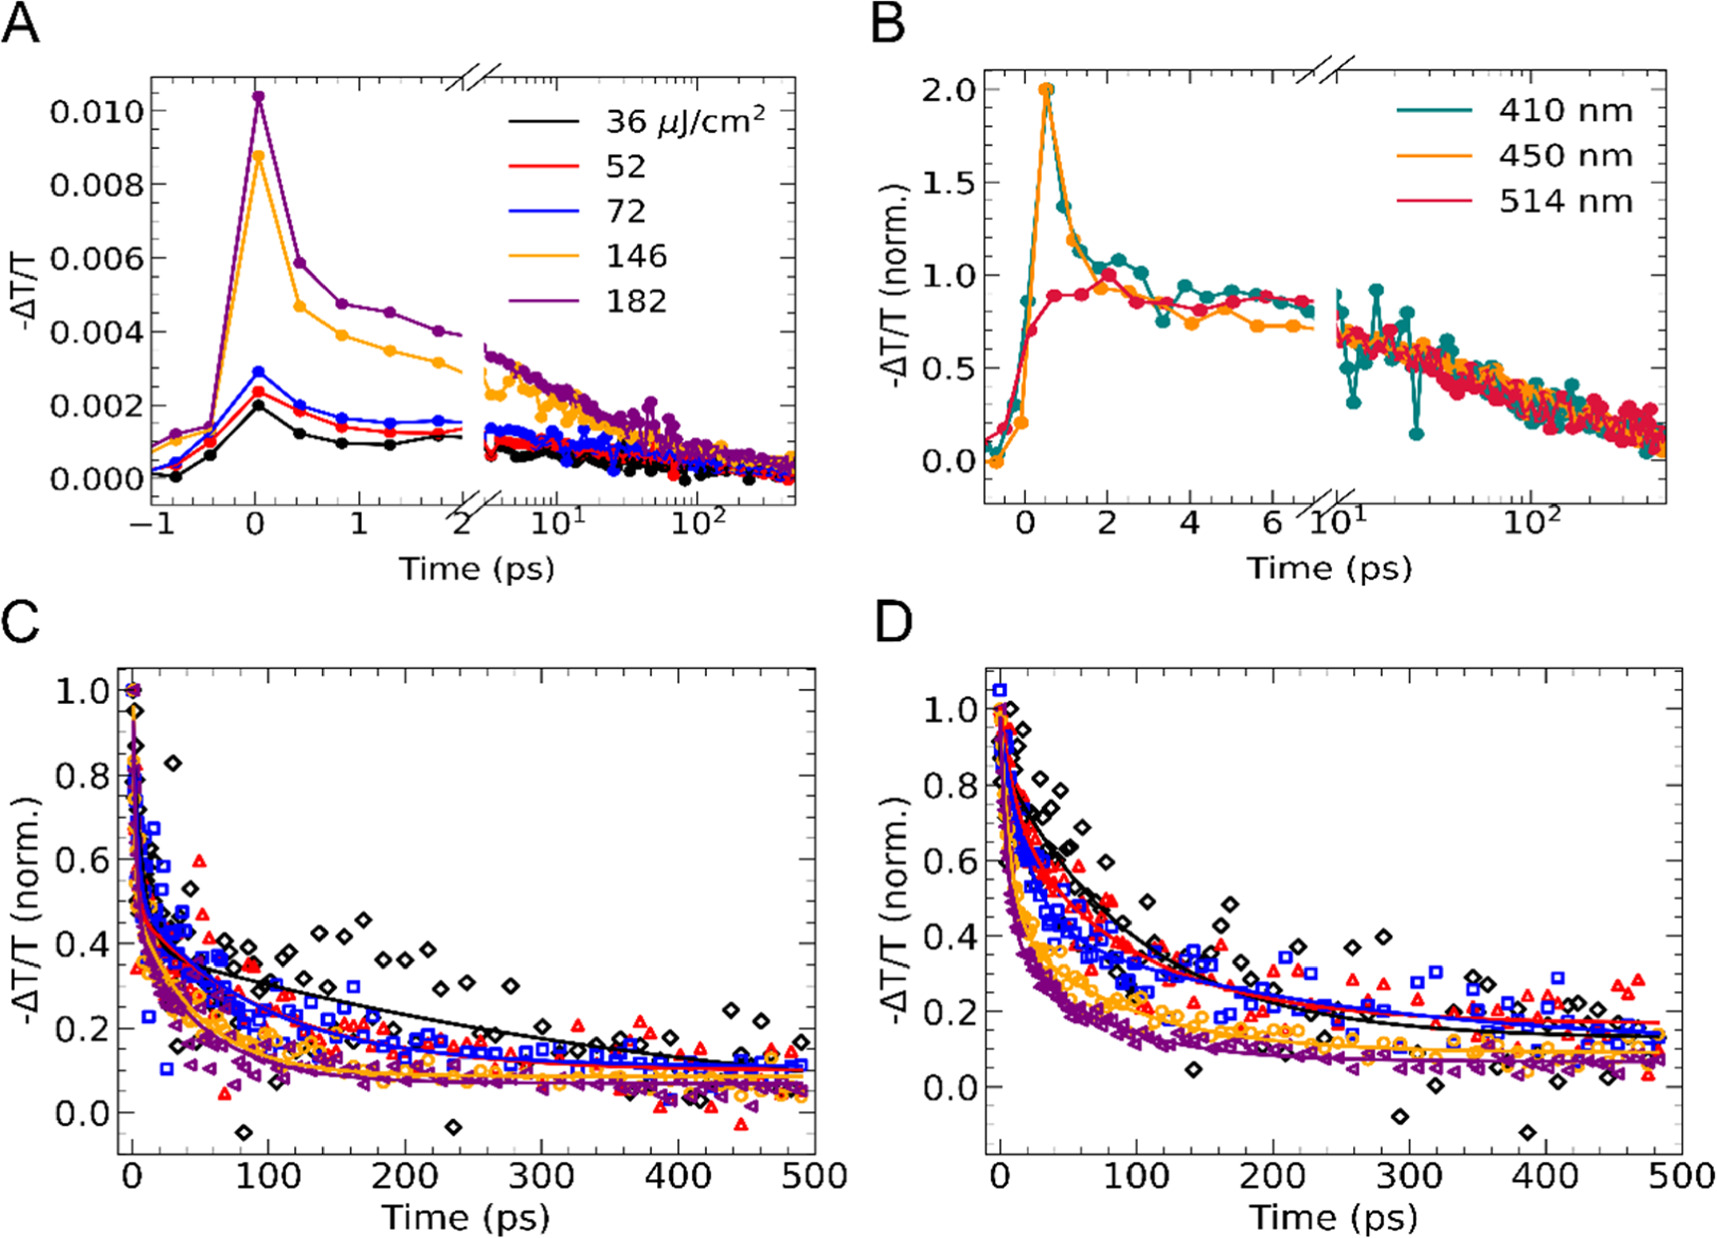
Figure 3. OPTP transients measured for (PEA)2PbI4. (a) OPTP decay photoexcited at 410 nm with fluences ranging from 36–182 μJ/cm2 . The split axis highlights the fast decay in the first picosecond following photoexcitationfirst ps. (b) Comparison between decay traces obtained with photoexcitation at 410 and 514 nm at a fluence of 146 μJ/cm2. (c) Normalised decay traces following 410 nm excitation with the first 2 ps removed. Fluences range from 36–182 μJ/cm2 and the same colour scheme is used as in part (a). Fit lines are shown as solid lines. (d) Normalised decay traces following 514 nm excitation. Fluences range from 36–182 μJ/cm2, and the same colour scheme as in part (a). Fit lines are shown as solid lines.
Download figure:
Standard image High-resolution imageFrom the differential absorption amplitude (-∆T/T) immediately after photoexcitation (i.e., before charge-carrier recombination has occured), the effective charge-carrier mobility φμ can be calculated as described in section S7 in the SI. For excitation at 410 nm, it can be assumed that φ ≈ 1 at early times since the excitation energy is well above the excitonic absorption feature and an equilibrium between excitions and free carriers has not yet been established [20]. For (PEA)2PbI4 excited at 410 nm, we find the effective charge-carrier mobility to be 5.8 ± 0.9 cm2 V−1s−1 , consistent with other reports in literature [10, 20, 23]. Similarly, photoexciation at 450 nm yeilds a charge-carrier mobility value of 5.4 ± 0.2 cm2 V−1s−1
An effective charge-carrier mobility of 1.9 ± 0.5 cm2 V−1s−1 is estimated from the decay traces following resonant exciation to the excitonic states at 514 nm. This value is somewhat suprising considering that the free-carrier concentration should be much lower here and closer to its equilibrium value, so we would expect the charge-carrier mobility to be significantly lower. This discrepency between the expected mobility and the what is predicted by the Saha equation was also mentioned in the work by Motti et al and was attributed to a sustained, long-lived free charge-carrier population being present [23].
One possibility to explain the presistence of free-carriers is that the photoexcitation density is above the Mott density where excitons dissociate due the presence of a reduced exciton binding energy caused by screening effects [19]. The Mott criteria (nc ) is expressed as follows [69]:

where aB is the exciton Bohr radius. Using aB = 1.35 nm [70]. We estimate the Mott transition to be 1.4 × 1019 cm−3 which is higher than the highest carrier density of 2.24 × 1018 cm−3 used in this study (see section S8 in SI). We can therefore confirm that we are exciting below the Mott transition.
Another possible explaination for the high mobility value obtained at 514 nm excitation can be understood, however, by considering the overlap between the broadband spectrum of the ultrafast laser pulse and the contributions to the steady-state absorption spectrum from the continuum and excitonic states as determined by a fit to the Elliot model (section S9 and S10 in the SI), which is typically used in literature to model the aborption spectrum in semiconductor materials including halide perovskites (17 {Singh, 2016 #121, 20, [71–73].
With 410 nm excitation, the OPTP decay traces exhibit a fast relaxation component in the first 1–2 ps followed by slower decay on a 0.4 ns (400 ps) timescale (figure 3(a)). Previous studies on materials with high exciton binding energies such as metal dichalcogenides, quantum dots and LPKs have attributed similar fast decays to carrier cooling and exciton formation [19, 74–80]. Comparing the results of exciting into the continuum at 410 nm and at the excitonic resonance at 514 nm leads us to a similar assignment for PEA2PbI4. As shown in figure 3(b), fast dynamics are not observed when exciting at 514 nm, similar to the results seen by Burgos-Caminal et al obtained using a higher frequency THz probe [19, 54]. At 514 nm, carriers are resonantly excited into the excitonic sub-band and the minority of free carriers is generated near the band edge. The slower, longer-lived features of the 514 nm and 410 nm kinectics exhibit similar timescales, suggesting a similar recombination process for a minority population of free charge-carriers. To highlight these longer timescale dynamics, normalised decay traces for which the first picosecond has been removed are shown in figures 3(c) and (d). These dynamics also exhibit a fluence dependence, where the total recombination is faster at higher fluences, which indicates the presence of higher order processes such as bimolecular and Auger recombination [10].
To further understand the charge-carrier recombination mechanism in (PEA)2PbI4, we fitted the decay traces after the first 2.5 ps to the following charge-carrier recombination equation (see section S11 in SI):

where nFC is the free charge-carrier density, k1 is the monomolecular recombination rate constant, k2 is the bimolecular recombination rate constant, k3 is the Auger recombination rate constant and, φ photon-to-charge-branching ratio. We then extrapolate the fits to t = 0 ps and fit the residuals to a single exponential to obtain the exciton formation rate constant kFC-Ex . The results of the global fits are given in figures S10 (a) and (b).
The kinetics of the OPTP traces at 410 nm and 514 nm yielded effective bimolecular recomination rate constants (φk2) of 9.38 × 10⁻⁹ cm3 s−1 and 8.86 × 10⁻⁹ cm3 s−1. This value agrees well with literature as bimolecular reocombination rates constants for (PEA)2PbI4 have been shown to vary between 2 × 10⁻⁸ cm3 s−1 and 9.0 × 10⁻⁹ cm3 s−1 [10, 20]. The similarity in bimolecular rate constants further confirms the similar kinetics between the traces at 410 and 514 nm from 2.5 ps onwards as seen in the figure 3(b). Additionally, a kFC-Ex value of 3.16 × 10¹² s−1 (lifetime of 316 fs) was attained. Similar values of around 350 fs have been reported for excitonic materials such as metal dichalcogenides [74–79].
3.3. Transient absorption spectroscopy (TAS)
We complement our OPTP measurements with transient absorption spectroscopy (TAS) experiments. As with OPTP, the sample was photoexcited at 410 and 514 nm (exciting into the continuum and excitonic bands, respectively), with fluences ranging from 36–182 μJ/cm2 (figure 4). The change in absorption of the white light probe (in mOD) was measured as a function of delay time between the optical pump and white light probe, enabling the resolution of spectral features in the 450–570 nm region.
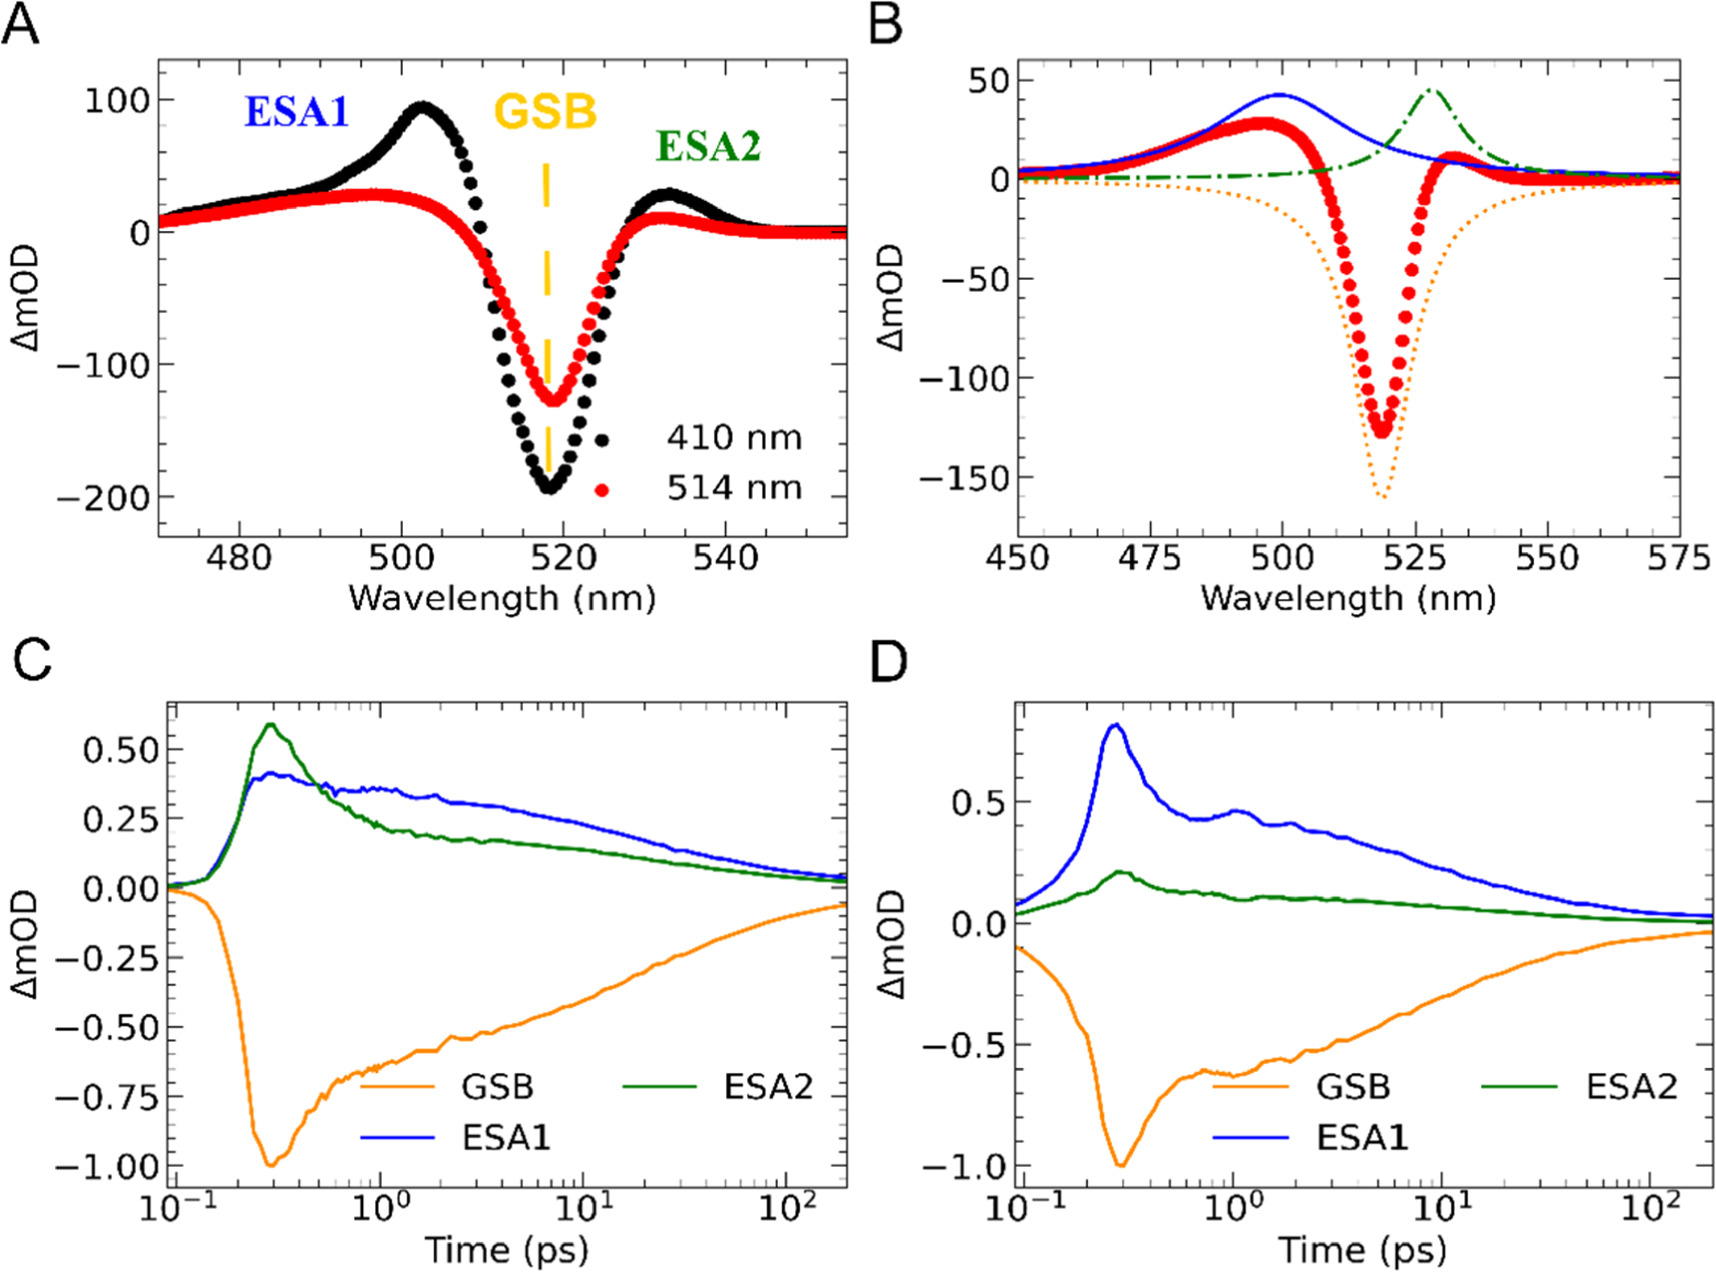
Figure 4. (a) Transient absorption spectra (∼500 fs) of (PEA)2PbI4 photoexcited at 410 nm (red) and 514 nm excitation (black) at 186 μJ/cm2. (Inset fig: Transient absorption spectra at 410 nm (red) and 514 nm (black) normalised to the ground state bleach (GSB)). (b) Representative TA spectrum (∼1ps) showing the total spectrum and the 3 fitted Lorentzian peaks. (c) Kinetics obtained for global fit under 410 nm excitation. (d) Kinetics obtained for global fit under 514 nm excitation.
Download figure:
Standard image High-resolution imageRepresentive transient absorption spectra for both continuum (410 nm) and excitonic (514 nm) excitations are shown in figure 4(a) (see figures S11 and S12 for the rest of the kinetic transients). In both cases, the transient spectra are composed of two positive features on either side and a stronger negative feature centered at 519 nm. The peak centroid of the negative feature (approminately at 519 nm) is in good agreement with the position of the excitonic feature of the same sample in the steady-state UV–vis (approximately 514 nm), strongly suggesting it originates from bleaching of the the excitonic absorption, in agreement with previous reports [12, 30, 37, 38, 44]. It is thus assigned to a ground state bleach (GSB). The two positive excited-state absorption peaks—which are assigned to excited state absorption (ESA) features and labeled ESA1 and ESA2— exhibit peaks at at roughly 490 nm and 525 nm, respectively.
While the assignment of the GSB to the excitonic absorption is well understood [51], the assignment of the ESA bands is more controversial with features generally being attributed solely to excitons and with no general consensus on the recombination mechanisms. For example Giovanni et al assigned the origins of the ESA2 band to be due to excitons and ultrafast (sub-ps) exciton spin relaxation [51]. Fu et al assigned the ESA components in (PEA)2PbI4 to excitonic contributions but instead proposed that its cause was exciton-induced linewdith broadening [81]. Furthermore, a similar conclusion was given by Ni et al in which the ESA features in BAPbI4 (BA = butylammonium) and HAPbI4 (HA = hexylammonium) were also described to have exciton origins, but from exciton–phonon coupling [49]. Deng et al, however, report that both free carriers and excitons contribute to the observed spectra. In this work, they ascribed the ESA features in BAPbI4 to be due to both the excitonic (1st and 2nd order) and free carrier (Auger recombination) populations [52]. Collectively, these studies emphsize the lack of agreement in the assignment of bands and the need for further investigation into other species that may be contributing to the kinentics.
Although both the ESA1 and ESA2 bands are present under continuum and excitonic excitation (see figures S11 and 12), the ESA2 band is markedly smaller with excitonic excitation than when the continuum is excited. This difference suggests that the ESA2 band is dominated by free carrier effects but also highlights the difficulty with assigning these bands to any one species since a significant amplitude is obsereved when the free carrier concentration should be low.
Futhermore, the kinetics of the ESA2 band contain an oscillatory component that is overlaid upon the relatively slower decay profiles (figure S12 (b)). We find this oscillatory component to be significantly more pronounced when the 514 nm excitonic band of the perovskite is excited in comparison to the continumm excitation at 410 nm. Oscillations of this nature have been observed previously in both 3D perovskites such as MAPbI3 and quasi-2D LPKs such as (PEA)2PbI4 and assigned to carrier phonon coupling [82]. In addition, n = 1 LPKs have recently been shown to be capable of increased collective lattice motion as compared to their 3D and higher n-valued counterparts [83].Through Fourier analysis of the oscillations, which is described in the SI section S13, we observed frequency components consistent with our measurements of phonon modes using THz-TDS and previously reported Raman modes obtained for single-crystal (PEA)2PbI4 [51]. Given the strong enhancement of the mode under excitonic stimulation, we believe this feature likely arises due to exciton–phonon coupling.
To further analyse the kinetics, care must be taken to ensure that the kinetics at any particular wavelengths do not contain contributions from multiple bands as the features are broad and overlapping. To facilitate kinetic modelling of the TAS data to study the underlying dynamics, it is therefore necessary to deconvolute these overlapping spectral features.
Previous studies have attempted to disentangle transient spectra by fitting the GSB and ESA features with a series of fixed Lorentzian functions [44]. Whilst this approach yields approximately correct solutions for the amplitudes of the various transient features, it does not account for changes in the lineshape or peak position of the bands, which can result from processes such as carrier thermalization or bandgap renormalization [84, 85]. To better track the true amplitude of the spectral components within the material, we also use a set of three Lorentzian functions as seen in figure 4(b), but allow the positions and linewidths of the GSB and ESA1 bands to shift over time (See figure S16 in the SI).
The kinetics extracted from the modelling are presented in figures 4(c) and (d). We find that the kinetics for the ESA2 band for both the continuum (λex = 410 nm) and excitonic excitation (λex = 514 nm) are both biphasic in shape with a fast relaxation component in the first 1–2 ps accompanied with a slower component on a 0.2 ns (200 ps) timescales. These dynamics are similar to the results of the OPTP kinetics presented previously and suggest a link to free carriers in which the fast decay is associated with charge-carrier cooling and exciton formation and the slower component was assigned to bimolecular recombination.
Furthermore, the oscillatory behaviour observed in the single-wavelength kinetics, shown in the SI (section S12) is very weak in the amplitude of the reconstructed ESA1 band, instead manifesting itself as an oscillation in the peak centroid (figure S16).
To further explore the link between the ESA2 band and the free carrier population we fit the kinetics of the ESA2 band using equation (1) and an extrapolation, which we have previously used to model free carrier behaviour in our OPTP data (see section S16 for details). The results of the fittings for kFC-Ex and k2 for the ESA2 band are presented in table 1. For kFC-Ex, we find excellent agreement with the OPTP data as both rates are on the order of 1012 s−1 (i.e. < 400 fs). Additionally, we find the effective bimolecular rate constants (φk2) of the ESA2 band TAS and OPTP at λexc = 514 nm and λexc = 410 nm to be statistcally close (between 1.9–9.4 × 10⁻⁹ cm3s−1). The results for k2 fitting further supports the conculsion that dynamics observed for the ESA2 band in TAS can be mostly attributed to free carriers rather than excitons.
Next, we move our attention to the ESA1 and the GSB bands. Figure S19 shows the TA colour map of (PEA)2PbI4 for the first 10 ps at 410 nm with a fluence of 146 μJ/cm2. In this figure, we plot the peak position as a function of time and observe the ESA1 band redshifts on a sub-2ps timescale. This behaviour agrees with previous studies on other 2D material such as MoS2 in which they assign this redshift to carrier thermalisation and bandgap renormalisation [39]. Using the fitting model discussed earlier in section 3.4, we are now able to model the peak dynamics of the of the ESA1 band. The results of this fitting are displayed in figure S14 (b).
Table1. Recombination rate constants obtained from fitting OPTP and ESA2 TAS kinetics.
| Method | λex (nm) | Spectral feature | kFC-EX [1012 s−1] | φk2 [10−9 cm3s−1] |
|---|---|---|---|---|
| OPTP | 410 | — | 3.16 ±0.3 | 9 ±2 |
| OPTP | 514 | — | — | 8.86 ±1.86 |
| TAS | 410 | ESA2 | 3.79 ±0.09 | 1.88 ±0.88 |
| TAS | 514 | ESA2 | 5.46 ±0.4 | 5.16 ±2.32 |
When looking at extracted kinetics for the ESA1 and GSB in figures S20–24, there is no fluence dependence present, which is in contrast to obeservations for the ESA2 and OPTP data. This suggests that there is another species that is dictating the dynamics instead of free carriers and further supports the excitonic origins of the ESA1 and GSB bands. Due to this lack of fluence dependence, using the same fitting for the ESA2 band for the ESA1 and GSB bands would not be appropriate. We instead fit the dyanamics using a biexponential model as it provides the best fit without over parametising, and the results of the fit are shown in table 2 (for the full data set and explanation of the fitting see section S16 in the SI). We find that the time constant t1 for the ESA1 (14.20 ps ± 0.85) and the GSB bands (14.66 ps ± 0.86) at λexc = 410 nm to be statistically close (table 2). We find this is also the case for the time constant t2 at λexc = 410 nm (105.52 ps ± 9.71 versus 107.43 ps ± 9.67) for the ESA1 and GSB, respectively. Similar results are obtained at λexc = 514 nm (see section S16 in the SI). This similarity in the ESA band and the GSB has beeen observed previously in other layered perovskites such as (BA)2PbI4 (BA = butylammonium) [86].
Table 2. Recombination parameters for ESA1 and GSB fittings at 410 nm.
| ESA1 | GSB | |
|---|---|---|
| A (mOD) | 0.65 ± 0.02 | 32.1 ± 1.2 |
| t1 (ps) | 14.20 ± 0.85 | 14.66 ± 0.86 |
| B (mOD) | 0.42 ± 0.03 | 21.2 ± 1.3 |
| t2 (ps) | 106 ± 10 | 107 ± 10 |
Following from this, based on the lifetimes and behaviour of the GSB and ESA1 dynamics we tentatively assign t1 exciton–exciton annihiliation, which has been reported to be ∼10 ps in other LPK material including (PEA)2PbI4 [51, 87]. The t2 rate constant would be attributed to monomolecular (geminate) recombination which has a reported lifetime of ∼100 ps [51].
Overall, this kinetic analysis further supports that OPTP data is useful for disentangling excitonic and free carrier contributions in the TAS data. Figure 5 gives an overview of the various processes when the LPK is photoexcited at 410 nm. In the first ∼150–350 fs, free carriers are photoexcited into the continuum and then relax to band edge and form excitons. The excitons then relax further via exciton–exciton annihilation (t1 ∼ 11 ps) and monomolecular (geminate) recombination (t2 ∼ 83 ps) processes. Simultaneously, there are some free carriers that do not form excitons and recombine through bimolecular recombination at a rate on the order of ∼109 cm3s1.

Figure 5. Model of exciton formation and recombination in (PEA)2PbI4. The pathway on the left involves the formation of excitons, whereas the pathway on the right highlights bimolecular recombination of free charges.
Download figure:
Standard image High-resolution image
4. Conclusion
In summary, we have used a combination of OPTP and TAS to elucidate the ultrafast free carrier and exciton dynamics of (PEA)2PbI4. We were able to assign the GSB band to the exciton aborption, the ESA1 and ESA2 at 410 nm originates from mostly the excitonic population with the free carrier population contributing at earlier times. At an excitation wavelength of 514 nm we were also able to assign features to similar origins. From this we have created a model to describe the charge-carrier dynamics taking place in LPK (PEA)2PbI4 (figure 5) and have quantified the lifetimes of both free charges and excitons. Lastly, we were also able to confirm the origins of the ocillations observed in the early times of the signal to be assigned to be exciton–phonon coupling. Future research should further develop the model presented by considering factors such as carrier-thermalisation, and bandgap renormalisation.
By presenting a clearer picture of the carrier dynamics in (PEA)2PbI4 and in particular distinguishing excitons from free carriers, this work will aid in the design and optimization of optoelectronic devices based on similar materials. Furthermore, the methodology presented, mainly the combination of OPTP and TAS, serves as a model for future studies of excitons and free carriers in LPKs and other excitonic materials.
Acknowledgments
RLM and NPG acknowledge funding from the UK Engineering and Physical Sciences Research Council (EPSRC) under grant EP/V001302/1. The majority of the equipment used in this work was housed within the Research Technology Platforms at Warwick. David Walker acknowledges funding from EPSRC grant EP/V007688/1, and PD acknowledges funding from EPSRC grants EP/S031103/1, EP/T010568/1. The authors thank Michael Staniforth for assistance with TAS measurements.
Data availability statement
The data cannot be made publicly available upon publication because no suitable repository exists for hosting data in this field of study. The data that support the findings of this study are available upon reasonable request from the authors.
Supplementary data (1.5 MB DOCX)