
Abstract
The localized surface plasmon resonance (LSPR) regulation of semiconductor oxide nanocrystals (NCs) in the near-infrared region (0.8–2.5 μm) of the solar spectrum has attracted much attention for its potential in applications such as electrochromism and sensing. However, the LSPR modulation properties of doped semiconductor oxide NCs in the mid-infrared region (2.5–25 μm) have rarely been reported. Here, we synthesized aluminum-doped zinc oxide (AZO) NCs with various nominal Al doping contents (1–20at%). The LSPR absorption peaks of these films were regulated between ∼3.8 and 6.57 μm depending on the doping content. AZO NC films with 1at% nominal Al doping and a 1316 nm film thickness exhibited the highest electrochemical infrared absorption regulation, achieving 35.9% regulation at 3–5 μm and 32.5% at 7.5–13 μm. The infrared absorption regulation mechanism of the AZO NCs involved changes in the LSPR absorption intensity caused by electron injection/extraction into/from the surface depletion layer of the AZO NCs. After applying different voltages, the AZO NC film on the Al substrates exhibited different apparent temperatures, demonstrating its potential applications in infrared displays and camouflage.
Export citation and abstract BibTeX RIS

Original content from this work may be used under the terms of the Creative Commons Attribution 4.0 licence. Any further distribution of this work must maintain attribution to the author(s) and the title of the work, journal citation and DOI.
1. Introduction
The localized surface plasmon resonance (LSPR) of metal nanoparticles has been used in biomedical applications, sensors, catalysis, and surface-enhanced spectroscopy [1–5]. Unlike metal nanoparticles, the LSPR of doped semiconductor nanocrystals (NCs) can be modulated by changing the doping content. In addition, the LSPR of semiconductor NCs can be dynamically regulated through the reversible electrochemical injection/extraction of electrons, providing new opportunities for manipulating light. Previous studies reported an indium tin oxide (ITO) NC film that achieved plasmonic electrochromism in the near-infrared region (800–2200 nm) by electrochemically controlling the shift in the LSPR absorption peak [6–8]. The ITO NC film could be used to selectively regulate the near-infrared solar spectrum of smart windows. The same group also reported that aluminum-doped zinc oxide (AZO) NCs exhibited the same selective regulation characteristics in the near-infrared spectrum as ITO NCs [9]. Maho et al reported on the near infrared regulation performance of ITO NC with different doping (5%-15%). ITO NC with 15% tin doping exhibited 40% spectral regulation at 1900 nm [10]. In another study, ITO NC films prepared using a sol–gel process exhibited 42% transmittance modulation at 2000 nm, and it was verified that the near-infrared regulation of ITO NCs involved plasmonic electrochromism rather than a traditional electrochemical redox process [11]. It was also reported that F/In-co-doped cadmium oxide (FICO) NCs had LSPR absorption peaks located in the near-infrared band of 1528–2176 nm depending on the In and F dopant contents [12]. The near-infrared spectra of the FICO NCs could be dynamically and reversibly regulated through electrochemical capacitive doping.
The LSPR regulation of doped semiconductor NCs occurs mainly in the near-infrared band (800–2500 nm), and there are few reports on the LSPR regulation of NCs in the mid-infrared band (2.5–25 μm). In this study, we synthesized AZO NCs with various nominal Al dopant contents (1at%, 3at%, 5at%, 10at%, and 20at%). The doped AZO NC samples are henceforth labeled AZOX, where X is the nominal Al doping concentration. Undoped ZnO NCs were prepared as the control sample. The morphology, composition, and LSPR peak positions of the AZO NCs were analyzed with respect to the Al dopant content. We investigated the effects of the morphologies and Al doping contents of the AZO NCs and the film thickness of the AZO NC film on the mid-infrared spectra regulation properties of the AZO NC film. Furthermore, we analyzed the mechanism of the mid-infrared spectral regulation of the AZO NCs and demonstrated the application of AZO NC films in infrared camouflage and infrared displays.
2. Experimental section
2.1. Materials
Zinc acetate dihydrate (Zn(CH3COO)2·2H2O, 99%), oleylamine (OLA, 70%), and oleic acid (OA, 90%) were purchased from Sigma-Aldrich. Aluminum acetylacetonate [Al(Acac)3, 99%] and oleyl alcohol (80%–85%) were obtained from Alfa Aesar. Lithium bis(trifluoromethanesulfonyl)imide (LiTFSI, 98%) and tetraglyme (98%) were purchased from J&K Scientific. Toluene was purchased from Sinopharm Co., Ltd. An Al sheet (25 mm × 25 mm × 1 mm) was purchased from Wenghou Materials Co., Ltd.
2.2. Synthesis of AZO NCs
The method for the synthesis of the AZO NCs was based on a slight modification of the method presented by Wainer et al [13]. In a typical synthesis, 2.4 mmol of metal precursors (Zn(CH3COO)2·2H2O and Al(Acac)3) and 2.4 ml of OA were loaded into a 50 ml three-neck round-bottom flask (RBF). The nominal Al doping concentration (Nd) is defined as:

where n is the number of moles of each metal used. Doped AZO NCs are labelled as AZOX, where X is the nominal Al doping concentration. The metal precursor and OA were magnetically stirred under vacuum at 110 °C for 20 min. The RBF was then filled with N2 and OLA (2.4 ml) was injected. The precursors were further stirred under vacuum at 100 °C for 5 min and maintained at this temperature under a N2 atmosphere for further use. Oleyl alcohol (16 ml) was loaded into another RBF and connected to a heating mantle. The RBF was heated to 280 °C under a flowing N2 atmosphere. Next, 2.4 ml of the precursor solution was loaded into a glass syringe connected to a 12-gauge needle and slowly injected into hot oleyl alcohol at a rate of 0.15 ml min−1 and left to react for 1 h. The reaction mixture was then cooled under a N2 atmosphere. Ethanol (20 ml) was added to the reaction mixture and the AZO NCs were separated by centrifugation at 9000 rpm for 5 min. Subsequently, the AZO NCs were dispersed in toluene. After two cycles of dispersion in toluene (2 ml) and precipitation in ethanol, the AZO NCs were dispersed in 1 ml of toluene.
2.3. Preparation of AZO NC films
A spin-coating technique was used to prepare the AZO NC films. The Al sheet was cleaned via sonication sequentially for 15 min in acetone, 15 min in de-ionized water, and 15 min in ethanol. Next, 35 μl of an AZO NC suspension (∼50 mg ml−1) was spin-coated onto the Al sheet at an initial speed of 1000 rpm for 60 s followed by 4000 rpm for 20 s. Several spin coats were performed to increase the thickness of the AZO NC films. The samples were heated at 300 °C for 30 min in a N2 environment to increase the adhesion between the AZO NCs and the substrate.
2.4. Electrochemical measurements
The AZO NC film around the edge of the Al substrate was scraped away to expose the conductive Al surface. Next, 0.1 mm thick Ag wires as connection leads were adhered to the edge of the Al substrate using conductive silver paste. The Al sheet sample coated with the AZO NC film was immersed in a 1 M LiTFSI/tetraglyme electrolyte solution for electrochemical measurements. A Pt mesh electrode served as the counter and reference electrodes. The Ag wire and Pt mesh electrodes were connected to the PARSTAT 4000 Advanced Electrochemical System (Princeton Applied Research). The sample was driven at a potential of –2.5 V or +2.5 V versus the Pt reference electrode. After applying the voltage for 5 min, the sample was removed from the electrolyte. The sample was then wiped using the cleanroom wiper cloth, and the infrared absorptivity and infrared thermal images at different voltages were acquired.
2.5. Characterization
The AZO NC suspension was diluted 50 times and one drop was placed on an ultrathin carbon-coated copper grid. Transmission electron microscopy (TEM) was conducted using a JEOL JEM-2100F microscope operating at 200 kV. The diameters of the AZO NCs were analyzed using the Nano Measurer 1.2 software. The surface and cross-sectional morphologies of the AZO NC films were analyzed using field-emission scanning electron microscopy (FE-SEM; TESCAN MIRA) at a beam energy of 20 keV. The thicknesses of the AZO NC films were measured using a Bruker Dektak XT Profiler.
Elemental analysis was performed using inductively coupled plasma optical emission spectrometry (ICP-OES, Agilent 720ES). The Al content of the AZO NCs was determined after digesting the AZO NCs in concentrated HCl. To analyze the crystal structure of the samples, x-ray diffraction (XRD) patterns of the dried AZO NC powders were collected using a Rigaku Smartlab diffractometer equipped with a Cu Kα radiation source operating at 40 kV and 20 mA.
Various spectral analyses of the samples were performed. First, the AZO NC suspensions were dripped into the slit of two BaF2 infrared-transparent substrates. The LSPR absorption peaks of the AZO NCs were analyzed through their infrared transmission spectra using Fourier transform infrared (FTIR) spectroscopy (Bruker Vertex 70). The infrared absorptivity of the AZO NC films under different voltages was analyzed using FTIR spectroscopy with a mid-infrared integrating sphere reflection module (Bruker A562).
After applying a voltage to the electrolytic cell, the Al sheet coated with the AZO NC film was removed from the electrolyte, and the film was wiped using a cleanroom wiper cloth. The sample was then placed on a 42 °C heat plate. Long-wave infrared (LWIR, 7.5 to 14 μm) images were recorded using FLIR T1050sc. The FLIR Tools V 5.6 software was used to analyze the LWIR image data.
3. Results and discussion
3.1. Morphology and composition of AZO NCs
The LSPR peak position of doped semiconductor NCs depends on their elemental composition and dopant concentration [14–16]. It has been widely reported that the LSPR absorption peak of AZO NCs lies in the mid-infrared band, providing the possibility of LSPR regulation in this band [14, 17, 18]. The LSPR frequency (ωsp) is proportional to the bulk plasmon frequency (ωp), which varies with the square root of the carrier concentration (n) [19]:


where e is the electron charge, m* is the effective mass of the electrons, εm is the permittivity of the environment, and ε0 is the permittivity of free space. By controlling the Al dopant content in the AZO NCs, the carrier concentration of the AZO NCs can be regulated, and the LSPR peak position of the AZO NCs can be modulated. Therefore, we synthesized AZO NCs with different nominal Al dopant contents (1–20at%).
Zinc acetate and Al(acac)3 reacted with OA at ∼100 °C, forming zinc oleate and aluminum oleate. The precursors were further modified with OLA to form complexes, which improved their reactivity for the formation of AZO NCs. We studied the morphology and size distribution of AZO NCs with different nominal Al dopant contents. The ZnO NCs had pyramidal shapes with an average diameter of 11.91 ± 5.97 nm (figures 1(a), 2(a)), which is different from the previously reported spherical and elongated shapes [17, 20]. AZO1, AZO3, and AZO5 showed similar spheroidal and pyramidal shapes (figures 1(b)–(d)), and their diameter distributions were similar to those of the ZnO NCs (figures 2(a)–(d)). When the nominal Al doping content was further increased to 10at% and 20at%, the morphology of the AZO NCs became predominantly spherical (figures 1(e), (f)), which may be due to the etching of the NC surface by excess Al3+ ions. The diameters of AZO10 and AZO20 were 8.25 ± 3.31 nm and 9.09 ± 2.48 nm, respectively (figures 2(e), (f)), which are smaller than those of undoped ZnO NCs. This is attributed to two main factors. First, the zinc oleate contents in the AZO10 and AZO20 precursors were lower than those in the ZnO NCs. Second, the excess Al3+ in AZO10 and AZO20 etched the surfaces of the NCs.
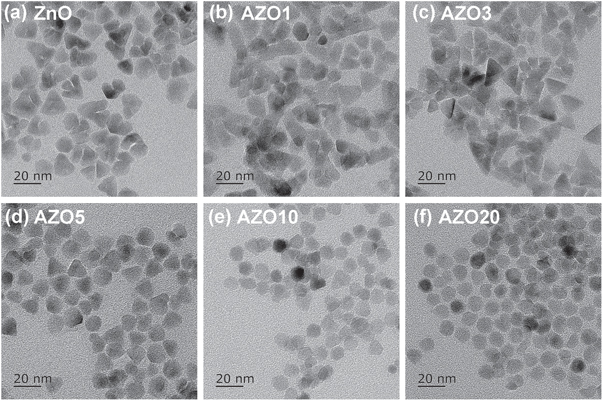
Figure 1. TEM images of (a) ZnO and (b–f) AZO NCs with various nominal Al contents: (b) 1at%; (c) 3at%; (d) 5at%; (e) 10at%; and (f) 20at%.
Download figure:
Standard image High-resolution image
Figure 2. Statistical distribution of the diameters of (a) ZnO NCs and (b–f) AZO NCs with various nominal Al contents: (b) 1at%; (c) 3at%; (d) 5at%; (e) 10at%; and (f) 20at%.
Download figure:
Standard image High-resolution imageAs expected, the dopant content in the AZO NCs increased as the nominal Al content increased, but the doping efficiency decreased from 92% (AZO1) to 21.6% (AZO20) (figure 3(a)). In the AZO NCs, Al3+ ions occupy substitutional sites in the ZnO lattice [21]. However, the crystal radius of Al3+ ions (0.39 Å) is smaller than that of Zn2+ ions (0.60 Å), which induces an increase in the inhomogeneous strain and the associated free energy cost to forming a substitutional defect on a Zn2+ site[17]. Therefore, it is increasingly difficult to dope the lattice of the AZO NCs with more Al3+ ions, resulting in a gradual decrease in the doping efficiency with increasing nominal Al content. The structural implications of the Al dopant in the AZO NCs were analyzed using XRD (figure 3(b)). AZO NCs with various Al doping contents showed similar wurtzite phases without other crystalline phases [such as gahnite (ZnAl2O4) and alumina (Al2O3)) [22].

Figure 3. (a) Experimental Al dopant content [Al/(Al+Zn)at%] measured using ICP-OES and Al doping efficiency as a function of the nominal molar dopant content of Al. The dotted lines serve as a guide for the eye. (b) XRD patterns and (c) LSPR absorption peaks for AZO NCs synthesized with 1–20at% nominal Al dopant contents compared to that of undoped ZnO.
Download figure:
Standard image High-resolution imageThe LSPR absorption peaks of the AZO NCs were studied using FTIR spectroscopy. The ZnO NCs did not exhibit any significant LSPR absorption peaks. The AZO NCs with 1–20at% nominal Al doping content exhibited LSPR absorption peaks with peak positions between ∼3.8 and 6.57 μm (figure 3(c), table 1). The carrier concentrations of the AZO NCs were calculated using the LSPR frequency according to the modified Drude–Lorentz theory [20, 23]:

where ω is the angular frequency of the LSPR peak maximum, me is the effective mass of the electron, and ε∞ is the high-frequency dielectric constant. The carrier concentrations were in the range of 5.42 × 10¹⁹–1.62 × 1020 cm−3 for the AZO NCs synthesized with various nominal Al contents (table 1), which are consistent with previous results for AZO NCs [13, 20, 21].
Table 1. Experimentally determined dopant contents, carrier concentrations, and LSPR absorption peak positions of ZnO and AZO NCs.
| Experimental dopant content (at%) | Carrier concentrations (cm−3) | LSPR peak positions (μm) | |
|---|---|---|---|
| ZnO | 0 | — | — |
| AZO1 | 0.92 | 5.42×10¹⁹ | 6.57 |
| AZO3 | 1.36 | 7.84×10¹⁹ | 5.46 |
| AZO5 | 2.16 | 9.58×10¹⁹ | 4.94 |
| AZO10 | 3.06 | 1.30×10²⁰ | 4.24 |
| AZO20 | 4.31 | 1.62×10²⁰ | 3.80 |
3.2. Mid-infrared absorption modulation properties of AZO NCs
We first investigated the mid-infrared absorption modulation performance of AZO nanocrystals with different Al doping levels and obtained the optimal Al doping amount. Then, using the AZO NCs with the optimal Al doping amount, we investigated the influence of different film thicknesses on the modulation performance of mid-infrared absorption for optimal film thickness. The ZnO, AZO1, and AZO5 NC suspensions were spin-coated onto the Al sheet to prepare NC films with similar film thicknesses (∼1000 nm). The NCs were tightly packed on the Al sheet to form NC films, as shown in figure 4(a). The ZnO NC films did not exhibit significant infrared absorption regulation properties owing to the lack of an LSPR peak (figure 4(b)). The absorptivity regulation (Δα) values of the AZO1 NC films at 3–5 μm and 7.5–13 μm were 35.5% and 30.7%, respectively (figure 4(c)). Compared to the AZO1 NC films, the AZO5 NC films exhibited a lower Δα at 7.5–13 μm (Δα7.5–13 μm = 23.5%). This is because the LSPR peak position of the AZO5 NC films was 4.94 μm, whereas the LSPR modulation of the AZO5 NC films mainly occurred at 3–5 μm with Δα3–5 μm = 30.1%. The Δα7.5–13 μm of the AZO5 NC films was lower than that of the AZO1 NC films because the LSPR absorption peak of AZO5 had a tail in this range. The AZO10 and AZO20 NC films exhibited similar Δα values as AZO5. According to Wien's displacement law:

where b = 2898.8 ± 0.4 μm·K, λm is the black-body radiation peak wavelength, and T is the blackbody absolute temperature. Objects near ambient temperature mainly radiate energy in the infrared atmospheric window of 7.5–13 μm. The AZO1 NC film exhibited optimal absorptivity modulation at 7.5–13 μm. Therefore, AZO1 was selected for further investigation. The absorption peaks of the AZO NC films at 5.57, 7.20, 8.46, and 9.51 μm were the absorption peaks of the LiTFSI electrolyte.
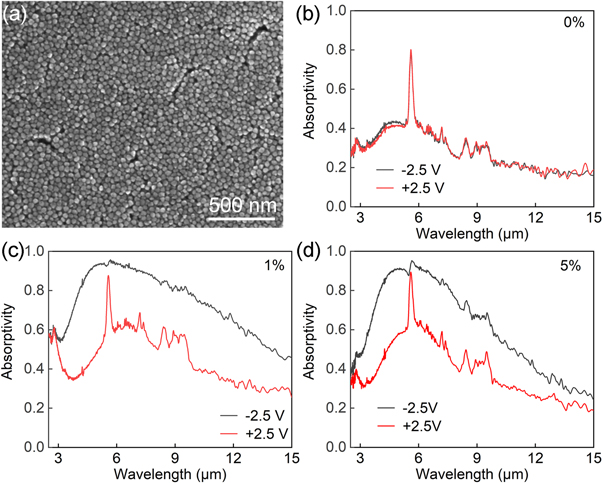
Figure 4. (a) Surface morphology of a spin-coated AZO NC film. Absorptivity versus wavelength for (b) a ZnO film and AZO NC films with (c) 1at% and (d) 5at% nominal Al content after the application of ±2.5 V voltage.
Download figure:
Standard image High-resolution imageThe effect of the film thickness on the absorptivity regulation properties was investigated using AZO1 NC films with different thicknesses (∼414, ∼808, ∼1316, and ∼1698 nm) prepared by increasing the number of spin coating cycles (figure 5). For the thinnest film (∼414 nm), the LSPR absorption of the AZO1 NC film was weak [origin state; figure 5(a)). After applying a voltage of –2.5 V, the LSPR absorption of the AZO1 NC film did not increase significantly; therefore, the Δα of the thinnest AZO1 NC film (∼414 nm) was small (<10%; figure 6(a)). As the film thickness increased, the LSPR absorption of the AZO1 NC film increased [origin state; figure 5(b)). After applying a voltage of –2.5 V, the absorption of LSPR was significantly enhanced; therefore, the absorptivity modulation values of the AZO1 NC film at ∼808 nm were Δα3–5 μm = 33.7% and Δα7.5–13 μm = 30% [origin state; figure 5(b)). With a further increase in the film thickness to ∼1316 nm, the absorptivity modulation values of the AZO1 NC film further increased to Δα3–5 μm = 35.9% and Δα7.5–13 μm = 32.5% (figure 5(c)). For the thickest film (∼1698 nm), the LSPR absorption saturated [origin state; figure 5(d)). Although the LSPR absorption increased drastically after applying a voltage of –2.5 V, the Δα did not increase further because of the high initial LSPR absorption intensity of the AZO1 NC films [origin state; figure 6(d)). Therefore, the AZO NC film with a 1% nominal Al doping amount and a film thickness of 1316 nm has the largest mid-infrared absorption modulation amount, which is 35.9% and 32.5% at 3–5 μm and 7.5–13 μm, respectively.
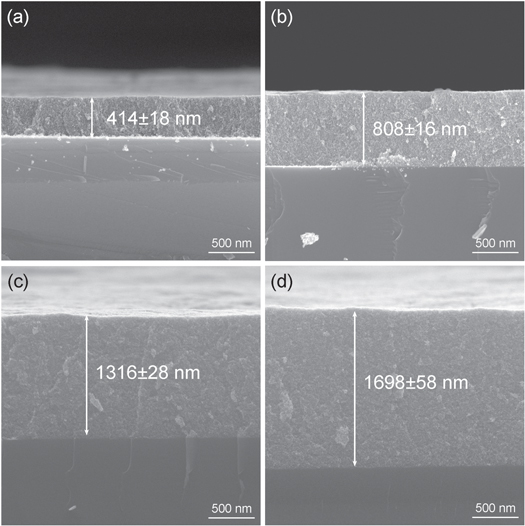
Figure 5. SEM images showing the film thicknesses of the AZO1 NC films obtained using (a) 5; (b) 10; (c) 15; and (d) 20 spin-coating cycles.
Download figure:
Standard image High-resolution image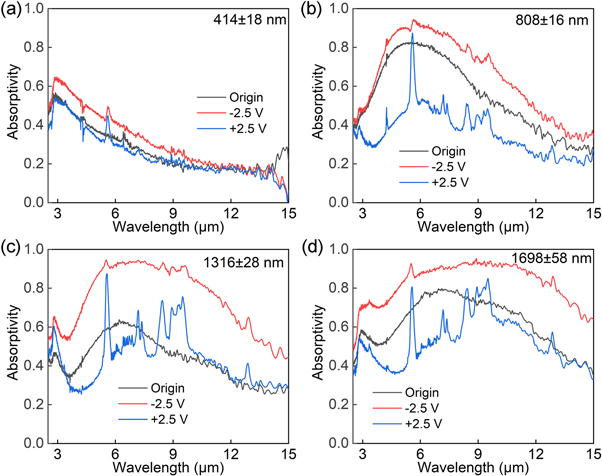
Figure 6. Absorptivity modulation of the AZO1 NC films obtained using (a) 5; (b) 10; (c) 15; and (d) 20 spin-coating cycles.
Download figure:
Standard image High-resolution image3.3. Mechanism and application of infrared absorptivity modulation of AZO NCs
We used the AZO1 NC films to study the infrared absorptivity regulation mechanism of the AZO NCs and demonstrated their application scenarios. The cyclic voltammogram of the AZO1 NC film was rectangular, similar to that of a double-layer capacitor (figure 7(a)) [24]. This indicates that the absorptivity regulation of the AZO NC film is a capacitive charging/discharging process, similar to the near-infrared absorptivity regulation of ITO NCs, which involves the injection/extraction of electrons. In traditional electrochromic materials, the electrochromic mechanism usually involves a redox reaction [25, 26]. However, no redox reaction occurred in the AZO NC films during infrared absorptivity regulation, which was supported by the lack of redox absorption peaks in the cyclic voltammograms (figure 7(a)). The mid-infrared absorptivity modulation of the AZO NCs was mainly caused by the intensity change of the LSPR absorption peak, which was different from that of conventional near-infrared doped semiconductor NCs, and was controlled by a shift in the LSPR peak position [6, 9, 27].

Figure 7. (a) Cyclic voltammograms of an AZO1 NC film (sweep rate: 50 mV s−1, Pt reference and counter electrodes). (b) Photograph of an AZO1 NC film on the Al sheet (c) infrared thermal images of an AZO1 NC film under ±2.5 voltages. The sample was placed on a 42 °C hot plate.
Download figure:
Standard image High-resolution image
The changes in the LSPR peak intensity and frequency during infrared absorptivity regulation can be explained by the surface depletion layer of the AZO NCs. The surface depletion layer refers to the surface region of an AZO NC where the carrier concentration is significantly different from that in the interior and is formed because the Fermi level is pinned to the surface potential through an applied voltage [28]. When a negative voltage is applied to the AZO NCs, electrons are injected into their depletion layer on the surface of the AZO NCs. An increase in the number of electrons leads to an increase in the LSPR absorption intensity of the AZO NCs, which causes the AZO NC film to exhibit high infrared absorptivity. When a positive voltage is applied to the AZO NCs, electrons are extracted from their surface depletion layer. This results in the weakening of the LSPR absorption of the AZO NCs and an increase in their transmittance. The AZO NC films exhibited the high infrared reflection properties of the Al sheet substrate, which was a low infrared absorptivity state.
Figure 7(b) shows the photograph of an AZO1 NC film on the Al sheet. After applying a voltage of ±2.5 V, the sample was placed on the hot plate. After 2.5 V voltage is applied, the sample exhibited a low apparent temperature (35.6 °C) due to its low infrared absorption state (figure 7(c)). The sample does not exhibit infrared camouflage properties (figure 7(c)). After applying a voltage of –2.5 V, the sample exhibited a high apparent temperature (40.5 °C) due to its high infrared absorption state. The apparent temperature of the sample was close to the background, resulting in an infrared camouflage effect. Different apparent temperature changes in the sample under positive and negative voltages can also be used for infrared displays.
4. Conclusions
We expanded the spectral regulation range of doped oxide NCs from near-infrared to mid-infrared. AZO NC films with 1at% nominal Al doping and 1316 nm film thickness exhibited the best mid-infrared absorptivity regulation properties, with infrared absorptivity regulation values of 35.9% at 3–5 μm and 32.5% at 7.5–13 μm. The infrared absorptivity was regulated by the change in the LSPR absorption intensity caused by electron injection/extraction in the surface depletion layer of the AZO NCs. The infrared absorptivity regulation characteristics of the AZO NC films can be applied in infrared camouflage, infrared displays, and may other infrared radiation regulation related fields.
Acknowledgments
This work was supported by the National Natural Science Foundation of China (grant number 52073303), Natural Science Foundation of Hunan Province (grant number 2021JJ10049), and the Postgraduate Scientific Research Innovation Project of Hunan Province (grant number CX20210054).
Data availability statement
All data that support the findings of this study are included within the article (and any supplementary files).