
Abstract
In this paper, Al-7%Si-0.6%Mg-X%Ce (X = 0, 0.1 and 0.2) casting alloys were prepared by vacuum induction furnace. Using optical microscopy (OM), x-ray diffractometer (XRD), scanning electron microscopy (SEM), energy spectrometry (EDS), differential scanning calorimetry (DSC) and transmission electron microscopy (TEM), the microstructures of the experimental alloys were studied, and the mechanism of refinement and modification of the alloy were discussed. Results show that for Al-Si alloy, AlCeSi2 is formed by adding cerium element into aluminum alloy. Furthermore, with the increase of cerium addition, α - Al dendrite arms decrease, the AlCeSi2 was formed, and the growth of iron-rich phase was hindered, respectively. Also, the areas of eutectic of α-Al + Si were decreased, due to the supercooling increasing of the alloys. In addition, the α-Al grains were refined, because existing of heterogeneous nucleation core supplied by AlCeSi2, and component supercooling caused by cerium adding. Moreover, the formation of AlCeSi2 consumed to some silicon elements, which leaded to size and amount reduction of eutectic silicon. The formation of high-density stacking fault can induce silicon modified, and the formed high-density stacking fault was produced by cerium as impurity element into silicon.
Export citation and abstract BibTeX RIS

Original content from this work may be used under the terms of the Creative Commons Attribution 4.0 licence. Any further distribution of this work must maintain attribution to the author(s) and the title of the work, journal citation and DOI.
1. Introduction
Al–Si–Mg casting alloys were widely used in aerospace, military and automotive fields because of their light weight, excellent casting properties, good fatigue and corrosion resistance, and high specific strength [1–5]. However, due to the coarse size of α-Al grains and slab-like eutectic silicon in Al–Si–Mg casting alloy, which the mechanical properties of the alloy were reduced, and its application range was limited [6, 7]. It is an effective method of improving the mechanical properties to refine microstructures by adding alloying element in the Al–Si–Mg casting alloys. As we known, rare earth elements can not only refine α-Al grains, but also play a role of modifying eutectic silicon. Besides, both hydrogen content and some impurity elements of aluminum melts can be reduced by adding rare earth elements, and then the comprehensive performance of Al–Si–Mg alloy can be improved. Thus, to research and development of high strength and toughness aluminum alloy, rare earth elements were commonly used as alloying elements [8–10].
At present, the use of rare earth elements to develop aluminum alloy refinement and modification has become a research hotspot. Adding trace amounts of Y [11], Mn, Mo [12, 13], La and Zr [14, 15] to hypoeutectic Al-Si alloys can change the morphology of the alloy, reduce the size of eutectic Si, and refine α-Al dendrites. Among the various available rare earth elements, Ce has become a good candidate element for microalloying of Al-Si casting alloys in terms of cost and demand in the metallurgical market [16–21]. Cai Yuzhou [22] et al added Ce in the Al-7Si-0.35Mg alloy, two phases of Ce-23Al-22Si and Al-17Ce-12Ti-2Si-2Mg were formed in the alloy, and the eutectic Si was well obtained. The addition of Ce reduces the eutectic nucleation temperature; He Yi [23] et al added Al-Ce master alloy to molten aluminum and found that it can refine the α in industrial pure aluminum grains, the Al11Ce3 phase generated in the alloy can be used as heterogeneous nucleation particles during α-Al solidification, thereby promoting grain refinement and improving the mechanical properties of the alloy; Liu Chunhai [24] et al after adding rare earth Ce into Al-7Si-0.7Mg-0.2Fe alloy, a Ce-rich rare earth phase appears in the alloy. Rare earth Ce can refine the α-Al grains, reduce the secondary dendrite arm spacing, and at the same time refine the eutectic Si, making its morphology change from lath-like to fibrous. In conclusion, it can be seen from the above literature reports that Ce-containing compounds were formed, after adding rare earth element Ce into Al- Si-Mg alloy. Also, eutectic nucleation temperature was decreased, secondary dendrite arm spacing was reduced, eutectic of α- Aland Si was refined, and mechanical properties of the Al alloy was improved. However, the structures of Ce-containing compounds are not unified in Al–Si–Mg–Ce alloys, such as the binary or ternary Ce-containing compounds. And the mechanism of refinement and modification of Al–Si–Mg–Ce alloy should be explored deeply. Therefore, it is necessary to further clarify the structure of the Ce-rich phase and reveal the action mechanism in Al–Si–Mg alloys with Ce addition.
Based on this, the effect of rare earth Ce on the microstructures of Al–Si–Mg alloys are systematically studied in this paper. Moreover, the existing form of rare earth element Ce is researched furtherly, and the mechanism of refinement and modification of the Al–Si–Mg–Ce alloy are discussed deeply. This work can be provide relevant theoretical understanding and experimental reference for the development of new aluminum alloys.
2. Materials and methods
In this work, the preparation of Al-7% Si-0.6% Mg-x% Ce (x = 0, 0.1 and 0.2) alloys were carried out with commercial high purity aluminum and Al-2%Ce master alloy. Based on our previous preparation works [25], the preparation process of this study is as follows: high purity aluminum and Al-2%Ce master alloy were melted at 750 °C. Then, the slag removing refining agent is added at 710 °C, and the mixture is continuously stirred for refining and slag removal. In addition, the moderate magnesium block was press into the alloy melt, which has been stood for 3–5 min. In order to further purify alloy melt, the argon gas was continuously blown for 3–5 min. Finally, the melt was casted in a steel ingot mold preheated at 200 °C. The composition of the alloy was tested by an OPTIMA700 DV inductively coupled plasma emission spectrometer, and the results are shown in table 1.
Table 1. Chemical composition of experimental alloy.
| Alloy code | Nominal composition(wt%) | Experimental composition(wt%) | ||||||||
|---|---|---|---|---|---|---|---|---|---|---|
| Ce | Mg | Si | Fe | Al | Ce | Mg | Si | Fe | Al | |
| 0%Ce | 0 | 0.6 | 7.0 | 0.1 | Bal. | 0 | 0.60 | 6.95 | 0.092 | |
| 0.1%Ce | 0.1 | 0.6 | 7.0 | 0.1 | 0.08 | 0.60 | 7.27 | 0.10 | Bal. | |
| 0.2%Ce | 0.2 | 0.6 | 7.0 | 0.1 | 0.13 | 0.58 | 6.91 | 0.098 | ||
The phases of the experimental alloy were analyzed by the x-ray diffractometer (XRD, D/MAX-2500/PC). The corresponding scanning parameters are the scanning angle (2θ)20°∼90°, scanning speed 3° min−1, step angle 0.02°, working voltage and current 40 kV and 100 mA, respectively.
The 10 mm × 10 mm × 10 mm samples were selected from the center of the as-casting Al alloys by wire cutting, then they were polished by sandpaper, until there is no scratch on the surface of them. The deep corrosion of the samples was carried out using Keller's solution. TEM samples were prepared by Twin - jet Electropolishing (DJ3000). An optical microscope (OM, Axio Imager A1m, Germany) was used and ten op-tical micrographs were selected for each sample, and Software image J is used for counting and size of α-Al grain size. Scanning electron microscope (SEM, U.S.A QUANTA FEG650) were used to observe the microstructure of the experimental alloy, and an energy dispersive spectrometer (EDS) was used to analyze the alloy. The microstructure in the experimental alloys was characterized by transmission electron microscopy (TEM, Thermo Scientific Talos F200X).
The endothermic or exothermic effects of materials during heating or cooling were measured by DSC (Seiko SII-TG/DTA6300). The scanning angle (2θ) in this experiment is 20°∼80°, the scanning speed is 3° min−1, the step angle is 0.02°, and the working voltage and current are 40 kV and 100 mA, respectively. The measured experimental results were analyzed using Jade 6.0 software.
The SII-TG/DTA6300 differential thermal analyzer was used to conduct the differential thermal gravimetry (TG-DTA) test of the experimental alloy. The experiment needs to use argon as the protective gas. The heating rate is 10 °C min−1, and the measurement range is 0 °C ∼ 700 °C.
3. Results
3.1. Experimental alloy phase (XRD) analysis
Figure 1 shows the XRD results of the 0% Ce, 0.1% Ce, 0.2% Ce alloys. As shown in figure 1, it can be seen that the alloys contain matrix α-Al(∀), eutectic Si(●). However, the diffraction peaks of Ce-containing compounds and Fe-rich phases were not found. It is due to lower content of Ce-containing compounds and from table 1 can be seen that the mass percentage content of Fe is almost less than 1% in the Al alloy, this results in less Fe-rich phases in the alloy. In order to determine the Fe-rich phases which present in the experimental alloys, the Fe-rich phases were further analyzed by SEM and TEM.
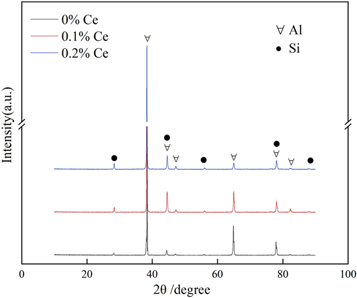
Figure 1. XRD results of experimental alloy.
Download figure:
Standard image High-resolution image3.2. OM, SEM and EDS analysis of experimental alloys
Figure 2 shows the OM microscopy of experimental alloys with different Ce contents. As shown in figure 2(a), it is mainly composed of α-Al and eutectic Si in Ce-free Al alloy. It can be found that the α-Al is in the form of course and irregular dendrites, and the eutectic Si is along the α-Al branches. Also, the grain boundaries are distributed in a semi-continuous network, and the range of eutectic of α-Al + Si is large. However, comparing to figure 2(a), after adding rare earth cerium, as shown in figures 2(b) and (c), it can be seen that α-Al dendrite arms become narrowing, the size of α-Al is smaller, and the range of α-Al + Si eutectic area is reduced. By comparing figures 2(b) and (c), as increasing of Ce contents, it can be found that the degree of grain refinement has hardly changed, and the size of eutectic Si does not change significantly.

Figure 2. OM micrographs of experimental alloys with different Ce contents (a) 0% Ce (b) 0.1%Ce (c)0.2%Ce.
Download figure:
Standard image High-resolution imageFigure 3 is the grain size and proportional histogram of α-Al obtained by using Software image J to statistically count 10 metallographic diagrams of each of the three experimental alloys. As shown in figure 3, the α-Al grain size distribution in the experimental alloy without rare earth Ce addition is uneven, the minimum size is 20 μm, the maximum can reach 170 μm, and the average grain size is 80.44 μm. After adding 0.1% rare earth Ce in the experimental alloy, α-Al is refined, the grain size distribution of α-Al becomes more uniform, its size is concentrated between 20–60 μm, and the average grain size is reduced to 47.21 μm. When the addition amount of rare earth Ce in the experimental alloy increases to 0.2%, the grain size of α-Al tends to increase, the grain size of α-Al is concentrated in the range of 30–70 μm, and the average grain size increases slightly to 52.15 μm, but it is still refined compared with the experimental alloy without rare earth Ce added. Therefore, when 0.1% rare earth Ce is added to the experimental alloy, the refining effect of α-Al grains is the best.
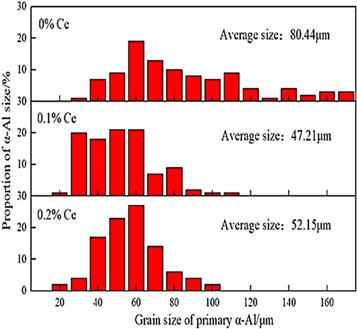
Figure 3. The grain size of α-Al size and its proportion in the experimental alloy.
Download figure:
Standard image High-resolution imageFigure 4 is the SEM micrograph of the deep etched experimental alloy eutectic Si. As shown in figure 4(a), in the experimental alloy without Ce, there is a single piece of flake eutectic Si. As shown in figures 4(b) and (c), after adding rare earth Ce to the experimental alloy, eutectic Si exhibits a fibrous structure.

Figure 4. SEM images of eutectic Si after deep corrosion of experimental alloy (a) 0%Ce (b) 0.1%Ce (c) 0.2%Ce.
Download figure:
Standard image High-resolution imageTo further determine the composition and structure of the second phase in the experimental alloy, the alloy was tested by EDS in this experiment. Figure 5 is the SEM micrographs and EDS mapping of the experimental alloy without rare earth addition. As shown in figure 5(a), there are bright white needle-like phases and dark gray flaky or massive phases in the experimental alloys. From the Mapping results in figures 5(b)–(e), it can be seen that the bright white needle-like phases are mainly composed of Al, Fe, and Si element enrichment, combined with the point scanning results of point A in table 2, it is determined that the phase is β-AlFeSi phase; the dark gray flaky phase is mainly enriched by Al, Si, Mg, and Fe (Si: Mg: Fe ≈ 6:3:1) combined with point B in table 2. From the point scan results, it was determined that the phase was the π-Al8Si6Mg3Fe phase.
Table 2. EDS results at points A and B in figure 5(a).
| Positions | Chemical compositions (wt%) | |||
|---|---|---|---|---|
| Al | Mg | Si | Fe | |
| A | 72.59 | 0.28 | 18.43 | 8.70 |
| B | 77.03 | 6.46 | 13.83 | 2.68 |
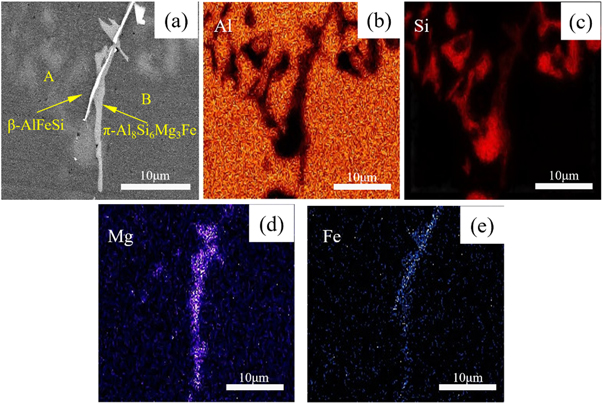
Figure 5. SEM and EDS results of the experimental alloy without adding rare earth. (a) EDS image (b)–(e) Mapping images of Al, Si, Mg, and Fe elements, respectively.
Download figure:
Standard image High-resolution imageFigure 6 is the SEM and EDS pictures of the Ce-containing experimental alloy. As shown in figure 6(a), a dark grey elongated phase and a bright bulky phase are present in the experimental alloys. Figure (b)–(f) are the Mapping results of the box-selected area in figure 6(a). It can be seen that the gray strip-like phase is mainly enriched by Al, Si, Mg and Fe elements. Combined with the point scanning results of point C (Si: Mg: Fe ≈ 6:3:1) shown in table 3, This phase was determined to be the π-Al8Si6Mg3Fe phase. At the same time, the bright bulk phase is mainly enriched by Al, Si, and Ce elements, and from the point scan results of point D, the atomic percentage content ratio of Ce and Si is about 1:2, confirming that this phase is AlCeSi2 phase [21, 26].
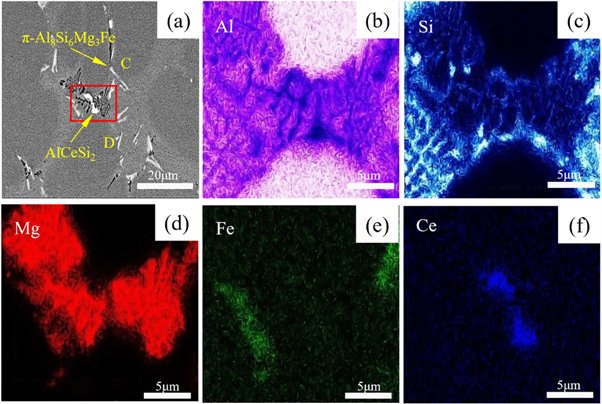
Figure 6. SEM and EDS results of experimental alloys containing Ce (a). EDS image (b)–(f) Mapping of the area in the red box of Al, Si, Mg, and Fe, Ce elements, respectively.
Download figure:
Standard image High-resolution imageTable 3. EDS results at points C and D in figure 6(a).
| Positions | Chemical compositions (wt%) | ||||
|---|---|---|---|---|---|
| Al | Mg | Si | Ce | Fe | |
| C | 76.55 | 7.00 | 14.37 | 0.04 | 2.05 |
| D | 80.05 | 0.47 | 13.48 | 6.80 | / |
3.3. DSC analysis of experimental alloys
As everyone knows, DSC is used to determine the changes that occur during coagulation, and the increase in subcooling is related to the refinement of tissue. Figure 7 shows the DSC curves of the three groups of experimental alloys. The heating and cooling rates were both 10 °C min−1. In the DSC Endothermic curve, peak 1 corresponds to the melting (solidification) of α-Al, and peak 2 corresponds to the binary eutectic reaction Al + Si → L (L → Al + Si). The DSC curve is processed by the definition of Mueller [27], that is, the initial melting temperature (the intersection of the steep tangent at the beginning of the melting endothermic curve and the baseline) is TM, and the initial nucleation temperature of the eutectic reaction is TN, then the degree of supercooling ΔT = TM−TN. The TM and TN values of eutectic Si in three groups of experimental alloys were obtained, and their respective ΔT values were calculated. The results were shown in table 4.
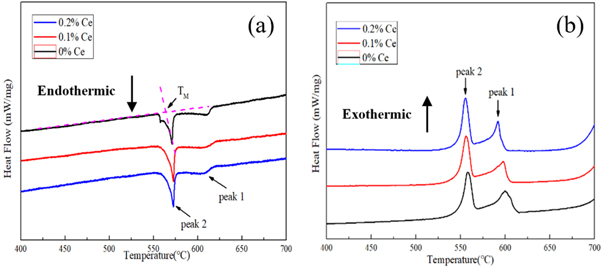
Figure 7. DSC curves of experimental alloys (a) Endothermic (b) Exothermic.
Download figure:
Standard image High-resolution imageTable 4. DSC characterization of experimental alloys.
| Alloy code | TM | TN | ∆T |
|---|---|---|---|
| 0%Ce | 566.80 | 566.15 | 0.65 |
| 0.1%Ce | 566.65 | 564.87 | 1.78 |
| 0.2%Ce | 566.46 | 564.80 | 1.66 |
It can be seen from table 3 that the addition of rare earth Ce in the experimental alloy reduces the initial nucleation temperature of the binary eutectic reaction and increases the degree of undercooling of the eutectic reaction at 0.65 °C,1.78 °C, and 1.66 °C, the undercooling of the experimental alloys with 0.1%Ce and 0.2%Ce additions increased by 1.13 °C and 1.11 °C, respectively, compared to the experimental alloys without rare earth Ce addition. The results show that the addition of Ce element leads to the increase of supercooling, refinement of microstructure.
To further understand the existence form of rare earth Ce in the experimental alloy, and to explore its refinement and modification mechanism of the experimental alloy, TEM analysis of the alloy was carried out in this experiment. Figure 8 is a TEM photograph of the rare earth phase in the experimental alloy. As shown in figure 8(a), there is a black massive rare earth phase with a size of about 4 μm in the experimental alloy. Figure 8(b) shows the diffraction spot (SAED) of the black bulk phase. After calibration, it is found that the black bulk phase is the AlCeSi2 phase, hexagonal system, and the crystal band axis is [0–21], which is consistent with the EDS results. The ratio of Si and Ce content is consistent.

Figure 8. Transmission photographs of AlCeSi2 phase in experimental alloy. (a)TEM image (b) SAED spots.
Download figure:
Standard image High-resolution imageFigure 9 is a TEM photograph of the experimental alloy eutectic Si. As shown in figure 9(a), there is an elongated eutectic Si with a concave–convex interface in the alloy, and the length is about 10 μm. Figure 9(b) is a high-resolution photo of a position on the strip-shaped phase in figures 9(a) and(c) is the Fourier-transformed diffraction spot (SAED) of the red-framed region in figure 9(b). As shown in figure 9(b), there are a large number of parallel stripes on the surface of eutectic Si, which correspond to the parallel blind lines in the diffraction spots in figure 9(c), and the diffraction spots are clear and sharp [0–11]. Figures 9(d)–(f) are the Mapping results of the elongated phase. The elongated phase is mainly enriched by Si element, and it can be observed that Ce element is solid dissolved on the eutectic Si.
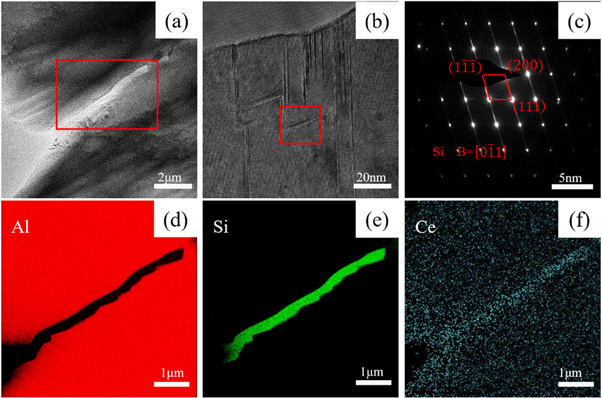
Figure 9. Transmission photograph of eutectic Si in experimental alloy. (a)TEM image (b) High-resolution photograph (c)SAED spots (d)–(f)Mapping image of Al, Si, and Ce elements, respectively.
Download figure:
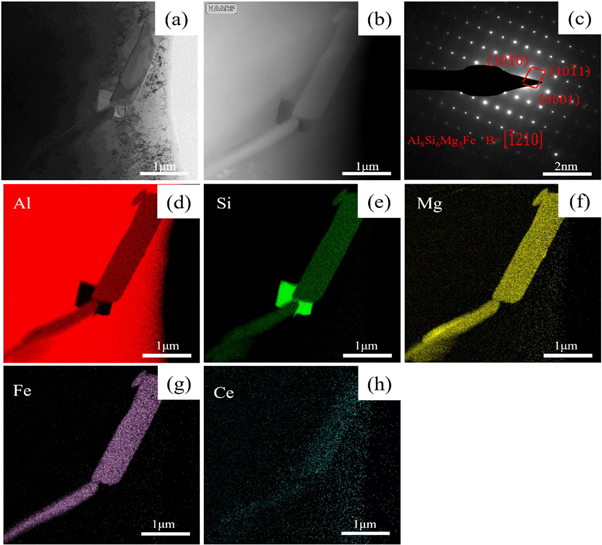
Standard image High-resolution imageFigure 10 is a transmission photograph of the iron-rich phase in the experimental alloy after adding rare earth Ce. As shown in figure 10(a), the alloy has two gray strip-like phases with a length of about 3 μm and a white bulk phase with a length of about 1 μm. Figure 10(c) shows the diffraction spot (SAED) at one point on the gray strip-like phase. After calibration, it is concluded that the gray strip-like phase is the Al8Si6Mg3Fe phase [19, 28], and the crystal band axis is [−1210]. Combined with the Mapping results in figures 10(d)–(g), it is found that Al, Si, Mg, and Fe are abundantly enriched in the gray elongated phase, which verifies that the elongated phase is Al8Si6Mg3Fe. By checking the PDF card, it can be seen that the Al8Si6Mg3Fe phase belongs to the hexagonal crystal system, which is a kind of π-Fe. As shown in figure 10(e), there is an obvious enrichment of rare earth Ce on Al8Si6Mg3Fe, which indicates that Ce element can be solid-dissolved on Al8Si6Mg3Fe, and it can also be observed that rare-earth Ce can be solid-dissolved on α-Al. It can be seen from figure 10(h) that only Si element is enriched on the white bulk phase in figures 10(a), (e), (d) that the white bulk phase is eutectic Si and it is determined.
Figure 10. Transmission micrographs of iron-rich phases in experimental alloys containing Ce. (a) Bright field image (b) HAADF-STEM image (c) SAED spots (d)-(h) Mapping image of Al, Ce, Fe, and Mg, Ce elements, respectively.
Download figure:
Standard image High-resolution image
4. Discussion
4.1. Refinement mechanism of α-Al
At present, the refining effect of rare earths is mainly reflected in two aspects, one is to promote the α-Al grain-shaped nucleus, and the other is to inhibit the growth of α-Al after nucleation. Heteromorphic nucleus theory holds that when the lattice type of the crystal nucleus in the cast metal is consistent with the α-Al matrix and the mismatch is less than 5%, it can be used as a particle of heterogeneous nuclei and plays a role in refining grains [29].
AlCeSi2 belongs to the hexagonal crystal system, [0–21] crystal belt axis, and its crystal structure is composed of CeSi2 (AlB2) and Al2CeSi2 (La2O3) [30], lattice constant a = 0.417 Å. The Al matrix is a face-centered cubic structure with a lattice constant a = 0.405 Å. The following formula [31] is used to calculate the lattice mismatch degree of the two:

where as is the lattice parameter of the α-Al phase; an is AlCeSi2 The lattice parameters of the phase; after calculation, the lattice mismatch between the α-Al phase and the AlCeSi2 phase is 2.96%, less than 5%, which can theoretically be used as the heterogeneous nucleation core of α-Al to refine the effect of the grain. In the solidification process of Al–Si–Mg experimental alloy, a small amount of AlCeSi2 phase is generated at 598 °C [26], and the initial nucleation temperature of the binary eutectic reaction is 564.87 °C from table 4, indicating that the AlCeSi2 phase is preferred to the eutectic Si nucleation, eutectic Si can rely on the growth of AlCeSi2 phase, the formation of AlCeSi2 phase can consume part of Si elements, AlCeSi2 inhibits the growth of eutectic Si, thereby refining eutectic Si. At the same time, the solubility of Ce in Al and Si is extremely small, and Ce will be enriched to the front of the solid–liquid interface to hinder the growth of surrounding α-Al grains (figure 9(f)), thus playing a role in refining the structure.
4.2. The modification mechanism of eutectic Si
At the same time, the impurity-induced twinning theory believes that the metamorphism of eutectic Si is closely related to the adsorption of impurity elements, and the impurity atoms adsorbed on the {111} close-packed surface of eutectic Si can cause stacking faults of Si atoms to form growth steps, resulting in eutectic Si metamorphism [32]. The high density of cross-step stacking faults observed in the high-resolution image of figure 9(b) corresponds to the parallel awn lines in the selected area diffraction pattern. The stacking fault is formed by the staggered arrangement of atoms in the stacking, which can be regarded as a twin with a thickness of one atom, and the rare earth Ce is distributed in the eutectic Si (figure 9(f)), indicating that Ce, as a surface-active element, can be adsorbed on eutectic Si as an impurity element. In addition, the ratio of impurity element atomic radius to Si atomic radius (r (modifier): r (silicon)) also has an important influence on the modification of eutectic Si. When r (modifier): r (silicon) = 1.646, the modification effect of eutectic Si is the best [33]. In this experiment, the ratio of the atomic radius (0.181 nm) of rare earth Ce to that of Si (0.117 nm) is 1.547, which is close to 1.646, which indicates that rare earth Ce can have a metamorphic effect on eutectic Si.
4.3. Influence of rare earth Ce on the iron-rich phase
Since the solid solubility of Fe in the Al-Si alloy is very low, Therefore, the existence of Fe in the aluminum alloy is basically in the form of reacting with Al and Si in the molten aluminum to form an Al-Fe-Si iron-rich phase. The two-dimensional morphology of β-AlFeSi is coarse needle-like, and π-Al8Si6Mg3Fe generally occurs in Al-Si alloys with Mg, and its morphology is usually block or Chinese character. It can be seen from figure 10(e) that the rare earth Ce can be solid-dissolved into the iron-rich phase and enriched at its tip, and the rare earth Ce will enter the iron-rich phase to change the composition of the iron-rich phase. At the same time, Ce will be adsorbed on the tip of the iron-rich phase, hindering its growth, resulting in changes in the morphology and distribution of the iron-rich phase, and passivation of its tip.
5. Conclusions
- (1)Experimental alloy made the grain size of α-Al is refined, and its morphology changes from dendrite to equiaxed by adding rare earth Ce. When the addition amount of rare earth Ce is 0.1%, the α-Al in the experimental alloy becomes fine. The crystallization effect is the best, and the average grain size is reduced from 80.44 μm to 47.21 μm. The AlCeSi2 phase formed in the experimental alloy has a lattice mismatch of 2.96% with α-Al, which can be used as a heterogeneous nucleation particle of α-Al to refine α-Al, and the rare earth Ce can be enriched to a solid state. The front of the liquid interface hinders the growth of the surrounding α-Al grains, thereby refining the grains.
- (2)After the rare earth Ce was added to the experimental alloy, the eutectic Si was refined and deteriorated. The undercooling degree of the binary eutectic reaction of the experimental alloy eutectic Si increases, the branches grow in all directions on the eutectic Si, and the size of the eutectic Si decreases. Rare earth Ce, as an impurity element, promotes the formation of high-density stacking faults on the eutectic Si and induces the deterioration of the eutectic Si. In addition, the AlCeSi2 phase formed in the alloy can consume part of the Si element, so that the amount of eutectic Si decreases and its size decreases.
- (3)Rare earth Ce is added to the alloy to form the AlCeSi2 phase, part of rare earth Ce is solid-dissolved into the α-Al matrix, and part of Ce is adsorbed to the eutectic Si {111} plane. Moreover, it can also be observed that the iron-rich phase elements in Ce are enriched at the tip of the iron-rich phase, which hinders its growth, passivates its tip, and reduces the adverse effect of iron-rich phase on the mechanical properties of the alloy.
Acknowledgments
Inner Mongolia Natural Science Foundation (2023LHMS05015); Basic scientific research project for universities directly under the Inner Mongolia Autonomous Region (JY20220237); Inner Mongolia Science and Technology Plan Project (201802029); Inner Mongolia Autonomous Region Major Science and Technology Project (zdzx2018031).
Data availability statement
All data that support the findings of this study are included within the article (and any supplementary files).