
Abstract
As a benchmark, the structural, electronic and optical properties of the three main phases of TiO2 crystals have been calculated using Hubbard U correction and hybrid functional methods in density-functional theory. These calculations are compared concerning the available experimental observations on pristine TiO2 crystals. Modified hybrid functionals, particularly the PBE0 functional with 11.4% fraction of exact exchange, are shown to provide highly accurate atomic structures and also accurate electronic structure data, including optical excitation energies. With DFT + U, accurate optical spectra are also possible, but only if the Hubbard U is applied on the O 2p electrons exclusively. Furthermore, both methods, the 11.4%-PBE0 hybrid functional and the DFT + Up scheme have been used to study TiO2 amorphous ultra-thin films, confirming the agreement of the two methods even with respect to small details of the optical spectra. Our results show that the proposed DFT + Up methodology is computationally efficient, but still accurate. It can be applied to well-ordered TiO2 polymorphs as well as to amorphous TiO2 and will allow for the calculations of complex titania-based structures.
Export citation and abstract BibTeX RIS

Original content from this work may be used under the terms of the Creative Commons Attribution 4.0 licence. Any further distribution of this work must maintain attribution to the author(s) and the title of the work, journal citation and DOI.
1. Introduction
Titania, TiO2, has an extremely wide range of applications, including the utilisation of solar energy for photocatalysis [1–10] and photovoltaics [10–12], as well as in electronic devices [13–15]. It exists in numerous polymorphs, the most common ones being rutile (R), anatase (A), and brookite (B) (see figure 1), found in natural minerals [16–19].

Figure 1. Atomic structures of the (a) rutile, (b) anatase, and (c) brookite polymorph of titania. Green and orange spheres represent Ti and O atoms, respectively. Polyhedra indicate the direct neighbourhood of each Ti atom defined by the nearest O atoms.
Download figure:
Standard image High-resolution imageThe electronic band gaps determined by photoemission for R- and A-TiO2 amount to 3.30 eV [20] and 3.47 eV [21], respectively. Furthermore, as concluded from work function measurements, the conduction band of R-TiO2 is about 0.2 eV above the one of A-TiO2 [22]. We are not aware of any photoemission measurements on B-TiO2. However, there are optical gap measurements for all three polymorphs: They are reported to be ∼3.0 [23–26], 3.4 [25–27], and 3.3 [28, 29] eV for R-, A-, and B-TiO2, respectively.
These gap sizes require additional efforts to sensitise TiO2-based materials for sunlight below the UV region of the electromagnetic spectrum [21, 30–34]. Corresponding experimental work is increasingly supported and guided by computational studies [33–38]. In particular, first-principles simulations provide valuable insight into the excitation processes in TiO2-based systems [21, 30, 31, 33, 35, 36]. However, the predictive power of density-functional theory (DFT), the methodology most frequently used in this context, is severely limited with respect to the accurate description of the electronic structure, e.g., the band gap [39–42]. While there are numerous approaches with superior predictive power, such as quantum chemistry methods [16], many-body perturbation theory [18, 39], or dynamical mean-field theory [43, 44], these methods are computationally too demanding for routine applications to complex titania-based systems. Therefore, there is a need for a versatile, computationally efficient and accurate methodology to address the titania electronic properties.
By correcting the on-site Coulomb and exchange energies of specific orbitals, the DFT+U method [45–47] is frequently considered to be a meaningful compromise between accuracy and computational expense. In recent years, this theory has been expanded to correct inter-site electronic hybridisations by DFT+U+V [48] and to account for the over-delocalisation of the electrons in the localised Hubbard manifold within density-functional perturbation theory [49]. A number of DFT+U studies were performed, where the U value was chosen such as to reproduce a specific TiO2 property known from either experiment or high-level theory [50–63]. Nevertheless, this approach is somewhat unsatisfactory. The accurate description of one specific property does not necessarily guarantee the accurate description of others. For example, the optimisation of Ud with respect to the energy of reduction of TiO2 to Ti2O3 fails to result in the correct band gap [50]. Similar results were also observed in [61]. Combining separate U parameters for Ti 3d and O 2p electrons can improve the description of the atomic structure and in particular the electronic band gap [62]. However, it gives rise to additional complexity and inconsistencies, particularly with respect to the calculated optical response [55, 56]. Very recently, Kirchner-Hall et al [63] performed an extensive benchmarking of DFT+U for various compounds, including R-TiO2 and noted that the calculated band gaps are extremely sensitive to the type of projector functions.
Hybrid DFT, which incorporates a fraction of the exact exchange (EEX) from Hartree–Fock theory, is another scheme, numerically more comprehensive than DFT+U, to address the shortcomings of DFT in describing titania, particularly concerning the prediction of single-particle excitation energies [18, 64–70]. Ko et al [71] examined the effect of the EEX fraction on the electronic structure of R- and A-TiO2. Landmann et al [18] calculated HSE-based optical absorption spectra for R-, A- and B-TiO2. Here, excitonic effects were included by solving the Bethe-Salpeter equation, and it was concluded that discrepancies between theory and experiment discussed in numerous earlier studies are due to the measurements rather than related to an insufficient theoretical description. Recently, hybrid DFT was also used to determine optical transitions and Franck Condon shifts in titania [70].
Here, we compare the accuracy of hybrid DFT with varying EXX-admixture with different Hubbard U correction schemes in describing TiO2 bulk crystals. We find that hybrid functionals with considerably reduced EXX fraction describe the optical absorption spectra of all TiO2 polymorphs best. In addition, we find that DFT + Up , (i.e., if the U values is applied on the O 2p electrons exclusively,) nearly perfectly reproduces the gold standard of the best hybrid functional. We also use DFT + Up and the optimized hybrid functional methods to study a TiO2 amorphous thin film structure. Here, we confirm that both methods give essentially the same results also in case of disordered TiO2 material. The structural, electronic and optical results of our calculations for titania crystals and amorphous thin films are presented and discussed in section 3. The remainder of this study covers the computational methodology described in section 2 and some concluding remarks stated in section 4.
2. Computational methodology
DFT within the generalised gradient approximation using the Perdew–Burke–Ernzerhof functionals (PBE [72] and PBEsol [73]) in conjunction with Grimme's D2 correction [74, 75] to account for dispersion interactions is the starting point of the present calculations. Here, the QUANTUM ESPRESSO implementation [76, 77] with norm-conserving pseudopotentials is used. The electron orbitals are expanded in a plane-wave basis with an energy cutoff of 150 Ry. Energy and force convergence criteria of 10−10 Ry and 10−6 Ry/bohr are applied to determine the structurally relaxed ground state. The Brillouin zone (BZ) sampling is performed using 8 × 8 × 12, 10 × 10 × 4, and 3 × 5 × 5 Monkhorst–Pack k-point meshes for R-, A-, and B-TiO2 unit cells, respectively.
The valence band (VB) and conduction band (CB) edges of titania are dominated by O 2p and Ti 3d states, respectively [18]. Therefore, a Hubbard correction is applied to these states. Here, we use the Dudarev rotationally invariant Hubbard U/J correction scheme [47].

where EDFT is the approximate DFT energy, while EU contains the additional Hubbard. It is given as

where  the effective Hubbard parameter,
  the total occupation of localised states σ at site I, and m and
  are magnetic quantum numbers. In the DFT+Up,d (DFT+Up+Ud) scheme, Ud parameter represents the screened on-site Coulomb interaction of Ti 3d electrons and Up
parameter accounts for the O 2p electrons.
are magnetic quantum numbers. In the DFT+Up,d (DFT+Up+Ud) scheme, Ud parameter represents the screened on-site Coulomb interaction of Ti 3d electrons and Up
parameter accounts for the O 2p electrons.
Furthermore, we account for exchange and correlation (XC) effects beyond (semi-)local DFT by using hybrid functionals, specifically PBE0 [78, 79] and HSE [80, 81], which contain a fraction α of EEX from the Hartree–Fock (HF) theory

and

Here the adjustable parameter μ controls the short-ranginess of the interaction in HSE. Note that HSE degenerates to the PBE0 hybrid functional for μ = 0. In the following, a value of 0.106 Bohr−1 is used.
The electronic structures calculated with PBEsol, PBEsol+Ud, PBEsol+Ud,p, and PBE0 are used to calculate the dielectric function within the independent-particle approximation [82], i.e., local field effects and electron-hole attraction are not considered [83]. Specifically, the tensor elements in the long-wavelength limit are calculated as

where β denotes the spatial direction. We follow the usual convention where the three-fold symmetry axis is identified with the z-direction, while the x-direction is perpendicular to the z-direction and lies in the plane spanned by the three-fold symmetry axis and one of the three equivalent basis vectors of the primitive orthorhombic unit cell. The sum runs over all valence and conduction band states and the wave vectors in the BZ. The transition dipole moments include the commutator with the nonlocal part of the pseudopotentials, Ω is the cell volume, and γ is the broadening. The Yambo package [84, 85] is used for the numerical calculations.
3. Results and discussion
3.1. Parametrization
First, the hybrid functionals, PBE0 and HSE, are used to account for XC effects beyond conventional DFT. As expected [71], the EXX fraction α has a strong influence on the band gap. As shown in figure 2, it increases nearly linearly with α. The strongest and weakest slopes are observed for A- and B-TiO2, respectively. The EXX fractions α of 11.4% and 16.3% in PBE0 and HSE, respectively, lead to the best simultaneous reproduction of the experimental band gaps of all titania polymorphs studied here.
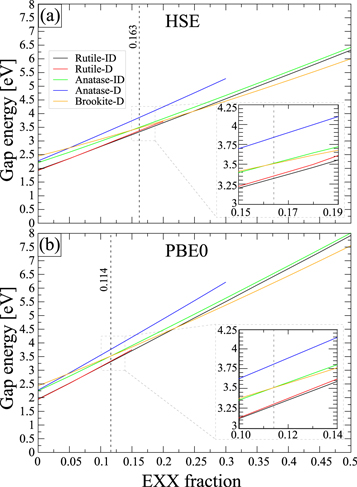
Figure 2. Calculated fundamental lowest direct (D) and indirect (ID) band gaps for R-, A-, B-TiO2 as a function of the EXX fraction α used in the respective hybrid DFT.
Download figure:
Standard image High-resolution imageAlternatively, we parametrise the U value for a sufficiently representative XC effect in TiO2 materials. Therefore, we start to find the Ud and Up values self-consistently for R-, A-, and B-TiO2 crystals by using the linear response method [86]. We found Ud values of 5.91, 5.97, and 5.95 eV for the respective Ti 3d states. However, the self-consistent determination of Up using linear-response theory leads to rather large (>18 eV) values unsuitable for calculating realistic band structures. This finding has already been reported earlier [87] and was attributed to the fact that linear-response theory is unsuitable for light elements application. On the other hand, Ud values alone are insufficient to reproduce the band gap of titania structures correctly. If Ud is increased to improve the band gap of titania structures, the band gap surprisingly decreases again for Ud > 7.5 eV. This behaviour is due to the partial hybridisation of Ti3d↔O2s and Ti3d↔O2p states; see also the projected density of states (PDOS) in figure 3(c). In addition, Ud alone causes the extension of bond length and lattice parameters; see table 1, figures 3(a), and S2(a). 2 Most importantly, a gradual deterioration of the optical spectrum is observed as Ud increases; see figure S2(c), (d) in (See footnote 3).
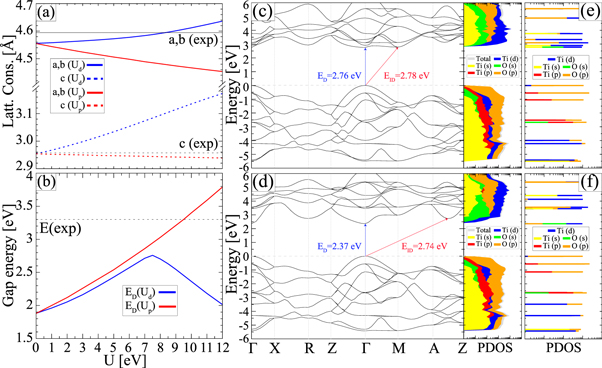
Figure 3. Lattice parameters (a) and fundamental band gap (b) of R-TiO2 crystal calculated as a function of the U values. Band structure and PDOS with considering Ud = 7.5 eV (c) and Ud = 10.0 eV (d). For both cases also the PDOS at the Γ point are given for Ud = 7.5 eV (e) and Ud = 10.0 eV (f).
Download figure:
Standard image High-resolution imageTable 1. Calculated unit cell parameters a, b, c (in Å) and volume V (in Å3) of R-, A- B-TiO2 in comparison to experiment. Ud values are equal to 5.91, 5.97, and 5.95 eV for the respective Ti 3d states of R-, A- B-TiO2; Up is equal to 4.2 eV for the respective O 2p states. Relative deviations are given with respect to the mean of experimental data.
| Method | Rutile | Anatase | Brookite | |||||||
|---|---|---|---|---|---|---|---|---|---|---|
| a = b | c | V | a = b | c | V | a | b | c | V | |
| PBEsol | 4.556 | 2.954 | 61.32 | 3.761 | 9.579 | 135.50 | 9.154 | 5.424 | 5.107 | 253.57 |
| −0.8% | −0.1% | −1.8% | −0.6% | +0.7% | −0.6% | −0.3% | −0.5% | −0.8% | −1.7% | |
| PBEsol+Ud | 4.578 | 3.052 | 63.96 | 3.834 | 9.657 | 141.95 | 9.240 | 5.488 | 5.239 | 265.67 |
| -0.4% | +3.2% | +2.5% | +1.3% | +1.5% | +4.1% | +0.6% | +0.7% | +1.7% | +3.0% | |
| PBEsol+Ud,p | 4.542 | 3.038 | 62.67 | 3.803 | 9.653 | 139.61 | 9.184 | 5.448 | 5.215 | 260.93 |
| −1.1% | +2.7% | +0.4% | +0.5% | +1.4% | +2.4% | +0.0% | −0.1% | +1.3% | +1.2% | |
| HSE | 4.563 | 2.953 | 61.48 | 3.707 | 9.949 | 136.72 | 9.202 | 5.418 | 5.109 | 254.72 |
| −0.7% | −0.1% | −1.5% | −2.1% | +4.6% | +0.3% | +0.2% | −0.6% | −0.8% | −1.2% | |
| PBE0 | 4.573 | 2.960 | 61.90 | 3.738 | 9.783 | 136.69 | 9.175 | 5.441 | 5.133 | 256.25 |
| −0.5% | +0.1% | −0.8% | −1.2% | +2.8% | +0.3% | −0.1% | −0.2% | −0.3% | −0.6% | |
| Experiments | 4.604 | 2.959 | 62.72 [88] | 3.787 | 9.518 | 136.50 [88] | 9.184 | 5.454 | 5.146 | 257.76 [88] |
| 4.587 | 2.954 | 62.15 [89] | 3.784 | 9.515 | 136.24 [90] | 9.180 | 5.457 | 5.158 | 258.39 [91] | |
| 4.593 | 2.959 | 62.42 [92] | 3.785 | 9.514 | 136.30 [92] | 9.184 | 5.447 | 5.145 | 257.38 [93] | |
Therefore, while using the Ud values determined via linear response for the Ti 3d electrons, the Up values are empirically determined such that a satisfactory direct band gap for the titania structures is obtained. This results in corrections of 4.20 eV for the O 2p electrons in R-, A- and B-TiO2, respectively. We briefly note here, that a value of 8 eV in an Up-only scheme will allow us to produce accurate dielectric optical spectra (for more details see below).
3.2. The pristine TiO2 crystals.
R-TiO2 and A-TiO2 belong to the tetragonal space groups P42/mmm (136) and I41/amd (141), respectively. B-TiO2 is orthorhombic with space group Pbca (61). R-, A- and B-TiO2 unit cell contain 6, 12, and 24 atoms, respectively. In all these titania polymorphs, TiO6 octahedra chains are formed (see figure 1) that consist of Ti4+ cations coordinated to six O2− anions. These octahedra are uniquely aligned in R- and A-TiO2, whereby varying orientation is responsible for the reduced symmetry in B-TiO2. At ambient conditions, R-TiO2 is the most stable phase while A- and B-TiO2 are metastable and transform to R-TiO2 when heated. However, A- and B-TiO2 are thermodynamically stable in titania nanoparticles with diameters below 11 nm, and in the range from 35 to 11 nm, respectively [96].
The lattice parameters of R-, A- and B-TiO2 are determined within PBEsol , PBEsol +Ud , PBEsol +Up,d , HSE, and PBE0; see table 1. It can be seen that PBE0 provides structural data in excellent agreement with experiment for all three titania polymorphs, while the HSE data are only of similar quality as the PBEsol calculations, suggesting that the short range feature of the HSE hybrid functional is of limited benefit in this case. The PBEsol+Ud calculations lead to a systematic overestimation of the lattice parameters by 1-4 %, which is improved by considering Hubbard corrections for the O 2p states. Based on the above evaluation, we refer to the PBE0 atomic geometries for band structure and optical response calculations as the 'gold standard' in the following.
In table 2, we compare the band gaps calculated for R-, A- and B-TiO2 with the experimental data. As expected, the DFT values underestimate the measured data considerably. A band gap widening by about 0.5-0.8 eV occurs upon including Hubbard corrections for the Ti 3d states. This widening results mainly from an upward shift of the conduction band. However, it is not sufficient to reproduce the experimental data. Moreover, in contrast to the experiment [23, 24], an indirect rather than a direct band gap is calculated for R-TiO2. The correct character of the rutile band gap is recovered, and excellent band gap values for all three polymorphs are obtained if Hubbard correction is considered for both the Ti 3d and O 2p states. The band gaps calculated within hybrid DFT agree with the PBEsol+Up,d values and the experiment within 0.05 eV. However, both types of hybrid functional, PBE0 as well as HSE, predict an indirect rather than a direct band gap for R-TiO2, in contrast to the PBEsol +Up,d (and +Up ) schemes, which are able to reproduce the experimental finding of a direct gap; see also figure S1 in (See footnote 3).
Table 2. Calculated direct (D) and indirect (ID) fundamental band gap (in eV) of titania in comparison to experimental data. Ud values are equal to 5.91, 5.97, and 5.95 eV for the respective Ti 3d states of R-, A-, and B-TiO2 in PBEsol +Ud and PBEsol +Up,d , where the Up value for the respective O 2p states is equal to 4.2 eV. In PBEsol +Up , Up is chosen equal to 8.0 eV so that the calculated optical absorption spectra reproduce the experimental ones.
| Method | Rutile | Anatase | Brookite | Amorphous thin-film |
|---|---|---|---|---|
| PBEsol | 1.88 (D) | 2.27 (D) | 2.40 (D) | 2.43(D) |
| 1.93 (ID) | 2.16 (ID) | |||
| PBEsol +Ud | 2.60 (D) | 3.08 (D) | 2.90 (D) | 2.98 (D) |
| 2.55 (ID) | 2.91 (ID) | |||
| PBEsol +Ud,p | 3.29 (D) | 3.87 (D) | 3.69 (D) | 3.37 (D) |
| 3.29 (ID) | 3.76 (ID) | |||
| PBEsol +Up | 2.91 (D) | 3.39 (D) | 3.50 (D) | 3.15 (D) |
| 2.95 (ID) | 3.32 (ID) | |||
| HSE | 3.34 (D) | 3.84 (D) | 3.50 (D) | 3.43 (D) |
| 3.31 (ID) | 3.52 (ID) | |||
| PBE0 | 3.31 (D) | 3.83 (D) | 3.49 (D) | 3.43 (D) |
| 3.29 (ID) | 3.51 (ID) | |||
| Experiment | 3.30 (D) [35] | 3.97 (D) [36] | — | — |
| — | 3.47 (ID) |
In addition, the electronic states below the VB edge (see band structures in figure S1 in (See footnote 3) are accurately depicted using PBEsol +Up,d or hybrid DFT. For R-TiO2, an upper valence bandwidth in the range of 5-6 eV was measured [97–100]. This is well reproduced by the present PBEsol +Up,d calculations, which determine a value of 5.90 eV in agreement with 5.93 eV determined with PBE0. Similarly, PBEsol +Up,d predicts a bandwidth of 4.81 eV for the upper valence band in A-TiO2, close to the measured 4.75 eV [101] and the PBE0 value of 4.93 eV. Previous quasiparticle and HSE calculations (with standard EXX fraction of 25%) resulted in bandwidths exceeding 6.5 and 5.5 eV, respectively [18, 21, 60, 102, 103]. For B-TiO2, a bandwidth of 5.05 and 5.09 eV is predicted within PBEsol +Up,d and PBE0, respectively. We are not aware of relevant experimental data. PBEsol +Ud calculations provide only slightly smaller bandwidths, with values of 5.42, 4.74 and 4.74 eV for R-, A-, and B-TiO2, which also fit to the experimental values, suggesting that the +U procedure at all does not alter this property considerably.
It also improves significantly (albeit not as much as the PBEsol+Up,d and PBE0) the band gap of titania structures, see table 2. Surprisingly, the bandgap of B-TiO2 is found to be almost identical (3.50 eV) with the corresponding value obtained by PBE0. The most notable difference is found in the remaining range of −7.0 to −4.5 eV, where the PBEsol+Up bands are over-downshifted in comparison to the PBE0 results, see figure 4.
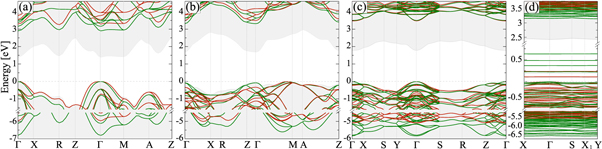
Figure 4. Band structures of R-, A- B- and thin film TiO2 calculated on the PBE+Up (green) and PBE0 (red) level of theory. The PBE band edges are shown as grey shaded areas. Up is taken equal to 8 eV in order optimize the optical absorption of R- and A-TiO2.
Download figure:
Standard image High-resolution imageThe surprising agreement of the +Up-only approach motivates us to apply this approach also to optical absorption spectra. In figure 5, the calculated imaginary parts of the dielectric functions of R-, A-, and B-TiO2 in ordinary and extraordinary polarisation are compared to the experiment. All calculations, apart from those based on PBEsol, account well for the onset energy of the optical absorption caused by O2p → Ti3d t2g inter-band transitions. PBEsol+Up,d fails also in the sense that the characteristic valley in the prominent two-peak structure tends to disappear or to become at least strongly underestimated.

Figure 5. Imaginary part of the complex dielectric function for R-, A- and B-TiO2 calculated within IPA based on the PBEsol, PBEsol+Up (Up = 8 eV), PBEsol+Up,d (Ud = 5.94 eV, Up = 4.2 eV) electronic structure in comparison to experimental data from [94] for rutile and [95] for anatase.
Download figure:
Standard image High-resolution imageHowever, PBE0 provides the best description of the line shape of the dielectric function, at least for low photon energies. PBEsol +Up resembles shifted PBEsol results. Interestingly, even some small peaks for E⊥c and E∥c are found in agreement with the PBE0 hybrid and the experiment. Furthermore, the calculated line shape for photon energies between 9-12 eV matches the measured optical spectra of A-TiO2 quite well. A similar behavior is also observed in the real parts of the dielectric functions, reflectivity and absorption results of R-, A-, and B-TiO2, see figures S3–S5 in (See footnote 3) [88].
3.3. Amorphous TiO2 thin film
R-, A-, and B-TiO2 are well-defined by their octahedral building blocks; nevertheless, the disorder-induced creation of under- and over-coordinated Ti atoms characterise the amorphous phase, defined by the truncation of Ti-O octahedral coordination. The crystalline phases' exceptional optical and catalytic capabilities have also sparked interest in amorphous TiO2 as a low-cost material for technological applications [104, 105]. Furthermore, amorphous titania serves as a generic forerunner in the hydrothermal treatment of different single-crystalline phases [106–109]. Amorphous titania thin film can be easily prepared using various experimental techniques [109–116].
For modeling an amorphous TiO2 thin film, we apply the following procedure: Starting from a structure built up by 6 unit cells B-TiO2, a 2 × 3 thin film is built up, periodically repeated in the lateral direction and separated by 15 Å vacuum in z-direction. In the first step, all atoms in the TiO2 thin film were allowed to relax freely, allowing expansion in the direction of the thin film's normal. Afterwards, 12 additional, stochastically distributed O atoms are inserted, and a molecular dynamics simulation is performed by heating up the structure to 500 K, whereby as-built O2 molecules are taken out until the structure is stabilised within a disordered quasi-amorphous structure. Single Ti atoms at the surface are removed to minimise the number of surface states. In the final step, the resulting structure containing 126 atoms (40 Ti and 86 O) is again fully relaxed. A geometric analysis of the resulting 1.1 nm thick, thin film structure confirms its amorphous character: Ti-O bond lengths between 1.83 and 2.13 Å. Standard TiO6-polyhedron building blocks occur with a fraction of about 60%, whereas fourfold, fivefold, and sevenfold coordinated units occur with a ratio of 4%, 29% and 7%, respectively (see also figure 6(a)). By the quite high percentage of under-coordinated Ti4+ ions, our model qualitatively matches the experimental synthesised 'glassy' ultra-thin film (∼2 nm) amorphous TiO2 [116].

Figure 6. (a) Polyhedra representation (2.5 Å Ti-O bond-length cutoff) of the TiOx building blocks for the 126-atom supercell of amorphous TiO2 thin film. TiOx building block fractions are TiO4 (4%), TiO5 (29%), TiO6 (60%) and TiO7 (7%). The thickness of the thin film is around 1.1 nm. (b) Imaginary part of the titania dielectric function calculated within IPA using PBEsol , PBEsol +Up (Up = 8 eV), PBEsol +Ud,p (Ud = 5.94 eV, Up = 4.2 eV) based on PBEsol relaxed crystal structure in comparison to PBE0 hybrid calculation. Notably, the surface states visible in the band structure (see figure 4(d)) do not show up in the calculated optical absorption spectra.
Download figure:
Standard image High-resolution image
A few (in our model two) under-coordinated surface oxygens also cause the almost flat (non-dispersive) bands in the lower half of the gap, reflecting strongly localized dangling bond (db) states. Besides these db-related gap states and other rather non-dispersive valence bands, reflecting the amorphous character of the structure, also some energy dispersive bands have been observed along the high-symmetry lines of the BZ, as seen in figure 4(d). This means that the loss of momentum conservation does not induce a HOMO-LUMO type energy gap in the disordered amorphous titania thin film. When analysing the band gap of amorphous titania thin film, its band gap is found to be close to the band gap in the B-TiO2 phase, see table 2. Furthermore, the optical anisotropy has been observed in the amorphous titania ultra-thin film, and its complex dielectric function acts as almost similar behaviour to the biaxial B-TiO2 phase, see figures 6(c) and (b). Based on the electronic band gaps and optical spectra, it can be concluded that there is a close relation between B-TiO2 and the amorphous titania. This observation confirms the significant results about the considerable resemblance of the atomic arrangement in amorphous samples with crystalline B-TiO2 [25, 117].
It is important to note that the characteristic valley in the prominent two-peak structure tends to disappear as soon as a U value (Ud ) is applied to the Ti 3d electrons. In PBEsol+Up,d, e.g., it keeps similarity with the PBE0 result, but in the spectral region below 7 eV exclusively. Only pure PBEsol +Up coincides with the PBE0 gold standard. In that case, even the tiny peak for E⊥c and E∥c at around 8.0 eV is in good agreement with the PBE0 hybrid. Notably and independently of the XC functional used, the optical properties of the amorphous titania thin film are not affected by surface defect states, i.e., the db-related gap states are not visible in optical spectra.
4. Conclusions
The structural, electrical, and optical characteristics of the three primary phases of TiO2 crystals were computed using Hubbard U correction and hybrid functional methods in density-functional theory. In light of the available experimental findings, these calculations were compared. It was demonstrated that modified hybrid functionals with reduced EXX fraction, especially the 11.4%-PBE0 functional, yield correct electronic structure data and highly accurate atomic structures. Furthermore, the optical spectra nicely agree with with the available experimental spectra; i.e., even details such as the small peaks around 7 eV for R- and A-TiO2 are also accurately described in both energetic position and intensity. By carefully evaluating the DFT+U method, we were able to show that DFT+Up, where the U-value is applied on the O 2p electrons exclusively, yields much more precise titania optical excitation energies than the standard DFT+Ud or the gap-correcting DFT+Up,d approach.
The ultra-thin amorphous layer of TiO2 was then studied with the same methods. Again, PBE0 is the gold standard for examining geometrical structures, electrical characteristics, and optical spectra. However, PBEsol+Up describes optical spectra very well, particularly if this is applied on PBE0 (or at least PBEsol) relaxed structures. The resulting still accurate but numerically less demanding approach can be thus generally applied, even for large disordered systems at much more efficient computational cost or for the calculation of nonlinear optical properties, which require a substantially increased numerical effort.
Acknowledgments
The Paderborn Centre for Parallel Computing (PC2) and the Höchstleistungs-Rechenzentrum Stuttgart (HLRS) are acknowledged for grants of high-performance computer time. We gratefully acknowledge funding from the Deutsche Forschungsgemeinschaft (DFG) under project numbers SCHM 1361/25, WI 2147/17, and TRR 142/3 (Project No. 231447078).
Data availability statement
All data that support the findings of this study are included within the article (and any supplementary files).
Conflict of interest
The authors declare no competing interests. All research has been carried out within an appropriate ethical framework.
Footnotes
- 2
Supplementary data 1.6 Mb