
Abstract
Mechanical strength and corrosion resistance are needed for Mg based BMs in the application of biomedical fields. In the present study, a high-strength biodegradable Mg-Gd alloys with an ultrafine microstructure successfully were prepared by equal channel angular pressing (ECAP). The high tensile strength of ECAPed Mg-Gd alloys was attributed to ultrafine DRX grains and fragmented secondary phases. During ECAP, the grain structure was refined by dynamic recrystallization (DRX), and the size of the DRX grains was approximately 300 nm. The secondary phase with lamellar structures was fragmented into fine particles of submicrometer size after ECAP process. As the number of ECAP passes increased, the distribution of the fragmented secondary phase has been changed into a uniform distribution. The corrosion rates calculated from the hydrogen evolution test demonstrated that the 8p-ECAP Mg-Gd alloy with an ultrafine microstructure possessed better corrosion resistance. Cell and osteogenesis induction experiments confirmed that Mg-Gd alloys processed by ECAP exhibited good biocompatibility. This study provides a new method for preparing high-strength Mg alloys with good corrosion resistance and biocompatibility.
Export citation and abstract BibTeX RIS

Original content from this work may be used under the terms of the Creative Commons Attribution 4.0 licence. Any further distribution of this work must maintain attribution to the author(s) and the title of the work, journal citation and DOI.
1. Introduction
Magnesium (Mg) and its alloys are representative materials in the fields of engineering and biomedical applications owing to their low density and superior biocompatibility [1–4]. For a few years, Mg-based products have been offered in the market owing to the tireless work of researchers [5–7]. Specially, many implants, such as vascular stents and screws, have been successfully fabricated from Mg alloys [8–11]. Numerous in vitro and in vivo trials promote Mg implants conduct or is going to conduct clinical studies.
At present, Mg alloys are mainly produced by casting and plastic deformation process. The forming processes play a key role in mechanical properties of Mg alloys [12]. As for biodegradable metals, mechanical requirements should be met: tensile strength >300 MPa, and elongation >15% [13]. According to previous researches, the tensile strength of cast and deformed Mg alloys is lower than 300 MPa [14]. This low strength indicates that it is difficult to apply biodegradable Mg alloys to load-bearing parts. Moreover, strength of biodegradable Mg alloys is related to the final size of biomedical products [15]. High-strength Mg alloys are more conducive for the preparation of stents and screws with smaller diameters [16]. This is beneficial for healing damaged tissues and organic matter.
In addition to their mechanical properties, the rapid degradation of Mg alloys is a big concern because of their low standard electron potential. Mg is susceptible to form Mg(OH)2 via combining with hydroxide ion in an aqueous solution. The formation of corrosion products is unable to prevent Mg substrate because their structure is not dense. The mechanical integrity of biodegradable Mg alloys is lost when they undergo rapid biodegradation. High-purity pure Mg has very good corrosion resistance, but its mechanical properties are poor [17, 18]. Therefore, it is vital to design and construct Mg-based implants with a good balance between mechanical properties and corrosion resistance.
Large-scale plastic deformation frequently causes grain refinement, secondary phase fragmentation, segregation elimination, and other processes that significantly increase the strength of metallic materials. Equal channel angular pressing (ECAP), in particular, has considerable potential in industrial spheres as a severe plastic deformation (SPD) technique that can generate bulk ultra-fine-grained (UFG) metallic materials without affecting the shape of the samples [19, 20]. Many researchers have thoroughly examined the corrosion behavior and processes of Mg alloys. It is challenging to realize the synergy between the excellent mechanical capabilities and good corrosion resistance of Mg alloys. One efficient method to reinforce Mg alloys is grain refinement using SPD. Grain refinement offers more limits that serve as physical barriers to corrosion, but an increase in the grain boundary density may act as a corrosion channel and accelerate corrosion [21, 22].
To illustrate the effect of the ECAP process on the mechanical properties, biodegradability, and biocompatibility of Mg alloys, a type of Mg-Gd alloy was prepared and systematically examined in the present work. The microstructural evolution of Mg-Gd alloys was investigated by altering the number of passes in the ECAP process. The tensile mechanical properties, corrosion behavior in the SBF solution, and viability of C3H10 and HUVEC cells were evaluated. These findings may offer guidance for the development of industrial SPD-processed Mg-based biomaterials with good corrosion resistance, high mechanical strength, and biocompatibility.
2. Materials and methods
2.1. Materials preparation
The as-cast Mg-Gd alloy ingot was made of 99.95% pure Mg metals, Mg-30 wt% Gd intermetallic alloy. Before melting, raw materials were required to remove surface oxides and preheat at 200 °C for 2 h. The temperature in furnance increased to 650 °C at a rate of 10 °C min−1. After melting in a low-carbon steel crucible under the protection of a mixed atmosphere of CO2 and SF6 (99:1), the molten metal was poured into a water-cooled copper mold with an inner diameter of 100 mm and length of 200 mm after melting in a low-carbon steel crucible. Prior to melting, the crucible and all iron instruments were coated with a protective layer to reduce the introduction of impurities. An inductively coupled plasma emission spectrometer (ICP) was used to determine the chemical composition of the alloy, which was Mg-5.2Gd (wt%). ECAP samples with diameters of 10 mm and lengths of 50 mm were cut from the ingot. ECAP was performed at 300 °C. Consequently, it is clear that this may readily implement multi-pass ECAP without having to remove the sample after each pressing pass. The number of ECAP in the current study was set to 8, 12, and 16. The die and sample were warmed and maintained together before the first pass and after four passes of ECAP.
2.2. Microstructural characterization
An Olympus BHM optical metallographic microscope (OM) and Sirion field-emission scanning electron microscope (SEM) equipped with a GENESIS 60S x-ray energy spectrometer was used to evaluate the microstructures of the as-cast and ECAP alloys (EDS). Mechanical grinding, polishing, and etching were used to prepare the metallographic and SEM samples (the etchant was 4 wt% nitric acid in alcoholic solution). The TEM samples were first ground to 50 μm using sandpaper and then thinned by twin-jet electron polishing in a 4 wt% perchloric acid alcohol solution. TEM observations were conducted using a Tecnai G2 transmission electron microscope.
Tensile tests of the as-cast and ECAP alloys were performed at room temperature using a CMT-5105 electronic universal testing machine at a strain rate of 10−3 s−1. Tensile samples with gauge dimensions of 20 × 3 × 2 mm were machined from both as-cast and ECAP alloys, with the loading direction parallel to the ECAP ram direction. Five parallel specimens were used and the mean values of the tensile characteristics for each processing state were computed.
2.3. Mechanical tests
Tensile tests of the as-cast and ECAP alloys were performed at room temperature using a CMT-5105 electronic universal testing machine at a strain rate of 10−3 s−1. Tensile samples with gauge dimensions of 20 × 2 mm × 2 were machined from both as-cast and ECAP alloys, with the loading direction parallel to the ECAP ram direction. Five parallel specimens were used and the mean values of the tensile characteristics for each processing state were computed.
2.4. In vitro degradation tests
The corrosion behaviors of the as-cast and ECAP alloys were investigated using hydrogen evolution tests and electrochemical analyses. Samples with an exposed area of 1 cm2 were subjected to both tests in an SBF solution. The detailed chemical composition of SBF is listed as follows: NaCl (8 g l−1), KCl (0.4 g l−1), CaCl2 (0.14 g l−1), NaHCO3 (0.35 g l−1), glucose (1 g l−1), MgCl2·6H2O (0.1 g l−1), MgSO4·7H2O (0.06 g l−1), Na2HPO4·12H2O (0.06 g l−1), KH2PO4 (0.06 g l−1), and the value of Ph should be kept at 7.4. The experiments for hydrogen evolution took place for 100 h in a water bath at a constant temperature of 37 °C. The equivalent PAH corrosion rates of the four alloys can be determined from the total hydrogen evolution volume using the following equation:
where A (cm2) is the exposed surface area of the specimen, ∆V is the total volume of hydrogen evolution, and t (days) is the immersion time. The samples were immersed for approximately 10 min in a chromic acid solution of 200 g l−1 CrO3 and 10 g l−1 AgNO3 to remove the corrosion products before characterization.
2.5. Cytocompatibility tests
CCK8 assay was used to measure cell proliferation. Cells were obtained from American type culture collection (ATCC, American), and seeded into 96-well culture plates (100 μl/well) at a density of 10000 cells ml−1, and after incubation for 12 h, the medium was replaced with extract, and normal Dulbecco's modified Eagle's medium (DMEM) +10% fetal calf serum (FBS) was used as the blank control. The cells were cultured at 37 °C for 3 days and 7 days respectively, and the medium was refreshed every 3 days. For CCK8 assay, cells were gently rinsed with phosphate-buffered saline (PBS) for three times, Cell Counting Kit-8 (CCK-8, DOJINDO, Japan) was diluted 10 times to the working concentration by DMEM, and then incubated with working solution of CCK8 (100 μl/well) for 2 h at 37 °C. The absorbance was measured at 450 nm using a microplate reader (Bio-Rad 680, USA), and each experiment was performed in six parallel wells. The cell viability was calculated using the following equation:
Where  and
and  are the absorbance values of the experimental and control groups, respectively [23].
2.6. In vitro osteogenic differentiation tests
For ALP staining, cells were seeded and cultured in the same manner. Based on the ALP assay, the extracts were diluted to 50% and 25% to prepare osteogenic induction solutions. The entire induction process lasted for 3 and 7 days, with the culture medium refreshed every 48 h. Matrix mineralization in osteoblast progenitor cells was determined by Alizarin Red staining (ARS). After 7 and 14 days of osteogenic induction, the cells were fixed with 3.7% formaldehyde, washed with PBS, and stained with 40 mM Alizarin Red (pH 4.1) according to the manufacturer's instructions [24].
3. Results
The microstructure of the as-cast Mg alloy is shown in the optical images in figures 1(a) and (b). The as-cast alloy exhibits dendritic grains (bright contrast) and a secondary phase (dark contrast). The secondary phases were discontinuously dispersed along the grain boundaries. The SEM image and associated EDS mapping are shown in figures 1(c) and (d), respectively. It can be observed that that the secondary phase exhibited lamellar structure. Maps of Mg and other alloying elements are shown in figure 1(d). It can be seen that Mg is absent from the secondary phase region, while Gd shows clear segregation in the secondary phase region. The distribution of alloying elements may represent the sites of the secondary phase because the majority of alloying elements are enriched within that structure.

Figure 1. Optical and SEM microstructure of as-cast Mg-Gd alloy. (a) Optical image with low magnification, (b) Optical image with high magnification, (c) SEM image, (d) corresponding EDS mapping.
Download figure:
Standard image High-resolution imageEDS point analysis was used to further evaluate the distribution of the alloying elements and distinguish the differences within the matrix and secondary phases in the as-cast Mg alloy. As shown in figure 2, the α, β, and γ regions were located in the Mg matrix, particle-shaped phase, and lamellar phase, respectively. In the secondary phase region, phases with lamellar structures and those resembling particles were observed using high-magnification electron microscopy. Elemental point analysis in region α revealed that the magnesium matrix had a trace of Gd, and higher proportions of Gd were concentrated in the secondary phase region. This difference in the elemental concentration is attributed to the solute element composition and solid solubility of these elements in the magnesium matrix. The two types of secondary phases with different morphologies had very similar alloying element contents, suggesting that they were in the same second phase.

Figure 2. SEM images of as-cast Mg-Gd alloy and corresponding EDS results with different region.
Download figure:
Standard image High-resolution imageThe SEM images of the microstructures of the deformed Mg alloys after ECAP are shown in figure 3. The steady improvement of the microstructure is encouraged by multipass ECAP. After eight passes of ECAP, the dendritic Mg grains in the as-cast Mg alloy were deformed and the secondary phases with lamellar structures were refined into small particles. The size and distribution of the secondary phases altered significantly as the number of ECAP passes increased. The particle phase ranged in size from sub-micrometers to 3 μm. Furthermore, the finest secondary phase was distributed during ECAP extrusion. The secondary phase distribution suggests that the microstructure of the Mg-Gd alloy processed by ECAP with low passes was not uniform. As the number of ECAP passes increased, the amount of fragmented secondary phase increased. As the holding temperature reached 300 °C, the fragmented secondary phase grew up during the holding temperature stage. However, when plastic strain was applied to the alloys, the growth of the secondary phase was blocked. Consequently, ECAP passes and holding times were used to establish the size of the secondary phase.

Figure 3. SEM images of Mg-Gd alloys processed by ECAP with different passes. (a) 8p at low magnification, (b) 8p at high magnification, (c) 12p at low magnification, (d) 12p at high magnification, (e) 16p at low magnification, (f) 16p at high magnification.
Download figure:
Standard image High-resolution imageFigure 4 shows the mechanical properties of the as-cast and ECAP-deformed Mg alloys. engineering stress-strain curves were obtained from the tensile experiments, which were performed at room temperature. The Mg alloys experienced ECAP deformation with different passes, showing the deformation behavior of elastic deformation followed by a slight strain hardening to a peak and then softening until fracture. The ultimate tensile yield strength of the 8p-ECAP Mg alloy was ∼420 MPa and its elongation was approximately 14%. When the number of ECAP passes was increased to 12, the tensile strength decreased to 390 MPa, but the elongation increased to 17%. As the number of ECAP passes continued to increase, the ultimate tensile strength barely changed and the elongation increased to 20%. As a result, the mechanical properties of the Mg alloys subjected to ECAP changed significantly with the number of ECAP passes. The increase in elongation may be attributed to the evolution of grain size and the uniform distribution of fragmented secondary phases.
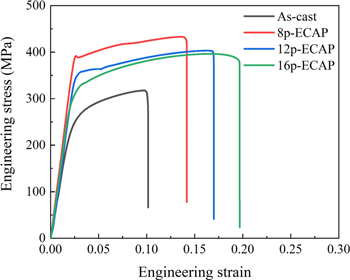
Figure 4. Typical tensile curves of as-cast and ECAPed Mg-5Gd alloys.
Download figure:
Standard image High-resolution imageFigure 5 shows the hydrogen volume evolutions and calculated corrosion rates of the as-cast and ECAP Mg alloys in three planes measured in the SBF solution for 100 h. As shown in figure 5(a), the hydrogen evolution volume increases with increasing immersion time. The increase in the hydrogen evolution volume is attributed to the lower standard electrode potential of Mg than that of Hydron. The calculated corrosion rates of the as-cast and ECAP Mg alloys first increased and then reached a steady state (figure 5(b)). At the beginning of the immersion experiment (less than 40 h), the corrosion rates of the ECAP Mg alloys were higher than those of the as-cast Mg alloy. With increasing immersion time, the corrosion rates of the 8p and 12p-ECAPed Mg alloy were close to those of the as-cast alloys, but 16-ECAPed Mg possessed the highest corrosion rate. The calculated corrosion rates indicated that the corrosion did not accelerate during long immersion periods after the ECAP process with low passes. However, increasing the number of ECAP passes increases the corrosion rate of Mg alloys.

Figure 5. Hydrogen evolution and calculated corrosion rate of Mg-Gd alloys immersed in SBF solution at 37 °C. (a) Hydrogen evolution volume, (b) Calculated corrosion rates.
Download figure:
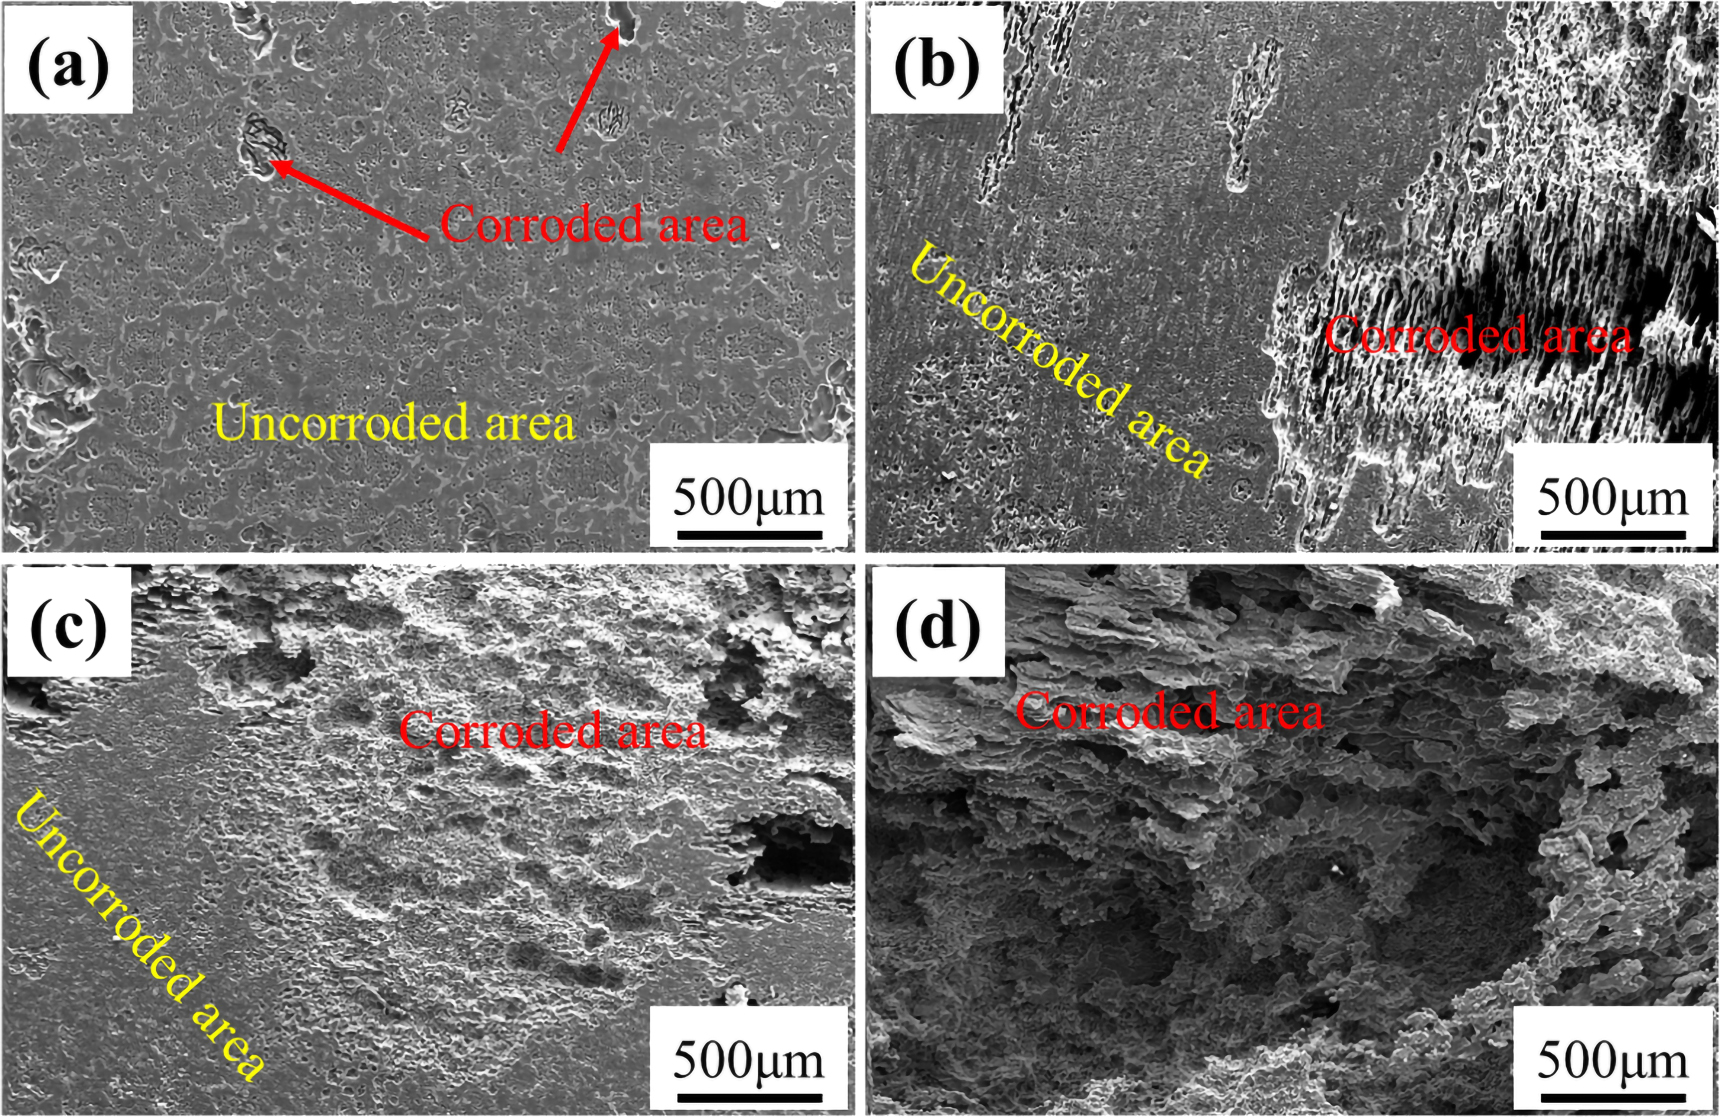
Standard image High-resolution imageThe corrosion morphologies of the as-cast and ECAP Mg alloys after removal of the corrosion products are shown in figure 6. After immersion for 100 h, the uncorroded area occupied most of the microstructure of the as-cast Mg alloy (figure 6(a)). The corroded area (red arrows) exhibited a mixed morphology of equiaxed pit local corrosion, which was formed owing to pit corrosion and dissolution of the Mg matrix. For Mg alloys processed by ECAP (shown in figures 6(b)–(d)), the corroded region is larger, which indicates that these alloys experience more severe corrosion.

Figure 6. Surface morphology of Mg-Gd alloys after removing corrosion products. (a) as-cast, (b) 8p, (c) 12p, (d) 16p.
Download figure:
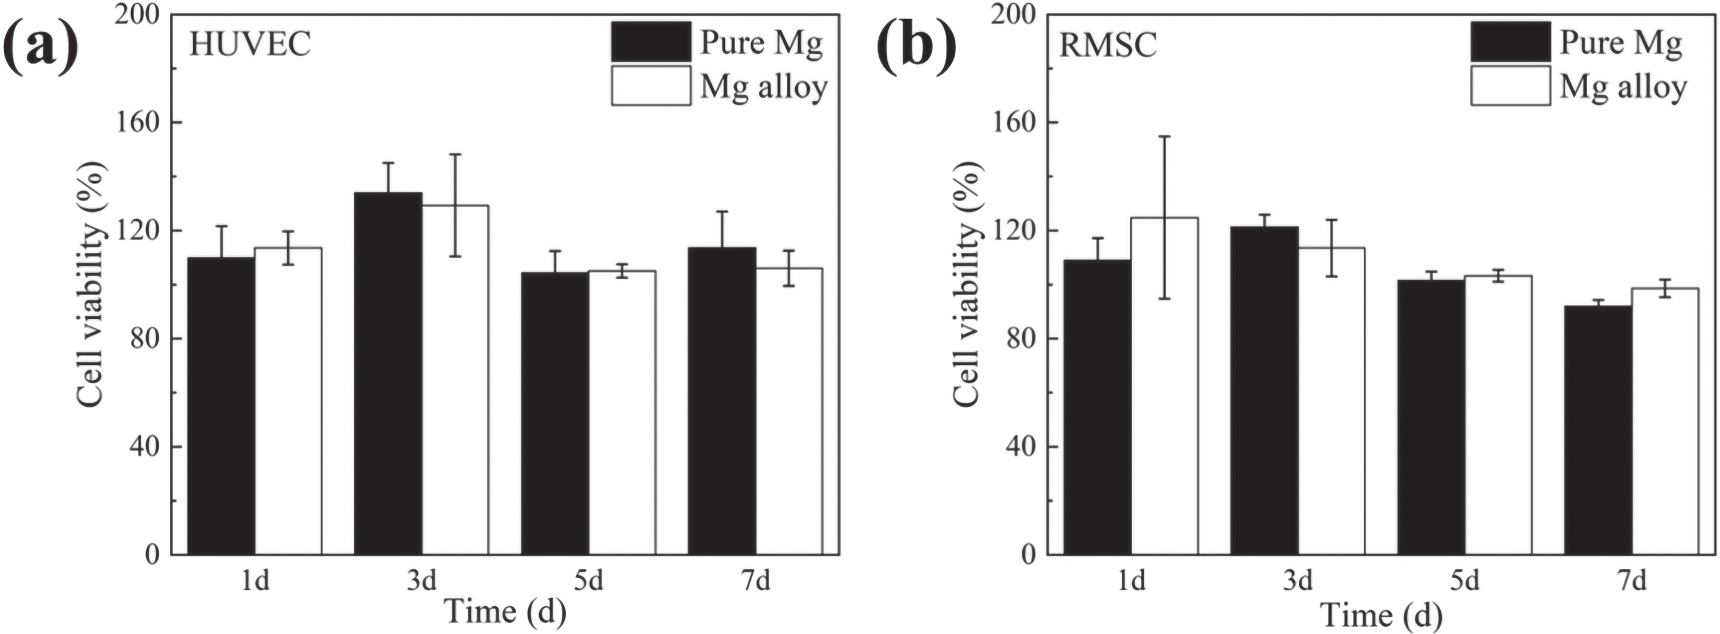
Standard image High-resolution imageThe cell viability of HUVEC and RMSC was studied by the CCK-8 assay to evaluate cytocompatibility, and the results are shown in figure 7. Cell viability was over 100% in the Mg and Mg alloy extracts diluted to 50% and cultured for different times. These results indicated that HUVEC and RMSC exhibited good growth in the Mg and Mg alloy extracts. With increasing culture time, the cell viability decreased slightly. Compared with the cytocompatibility of Mg and Mg alloy extracts, it can be observed that Mg alloy possesses good biocompatibility, similar to that of pure Mg.

Figure 7. Cell viability of pure Mg and Mg-Gd alloy. (a) HUVEC cell, (b) RMSC cell.
Download figure:
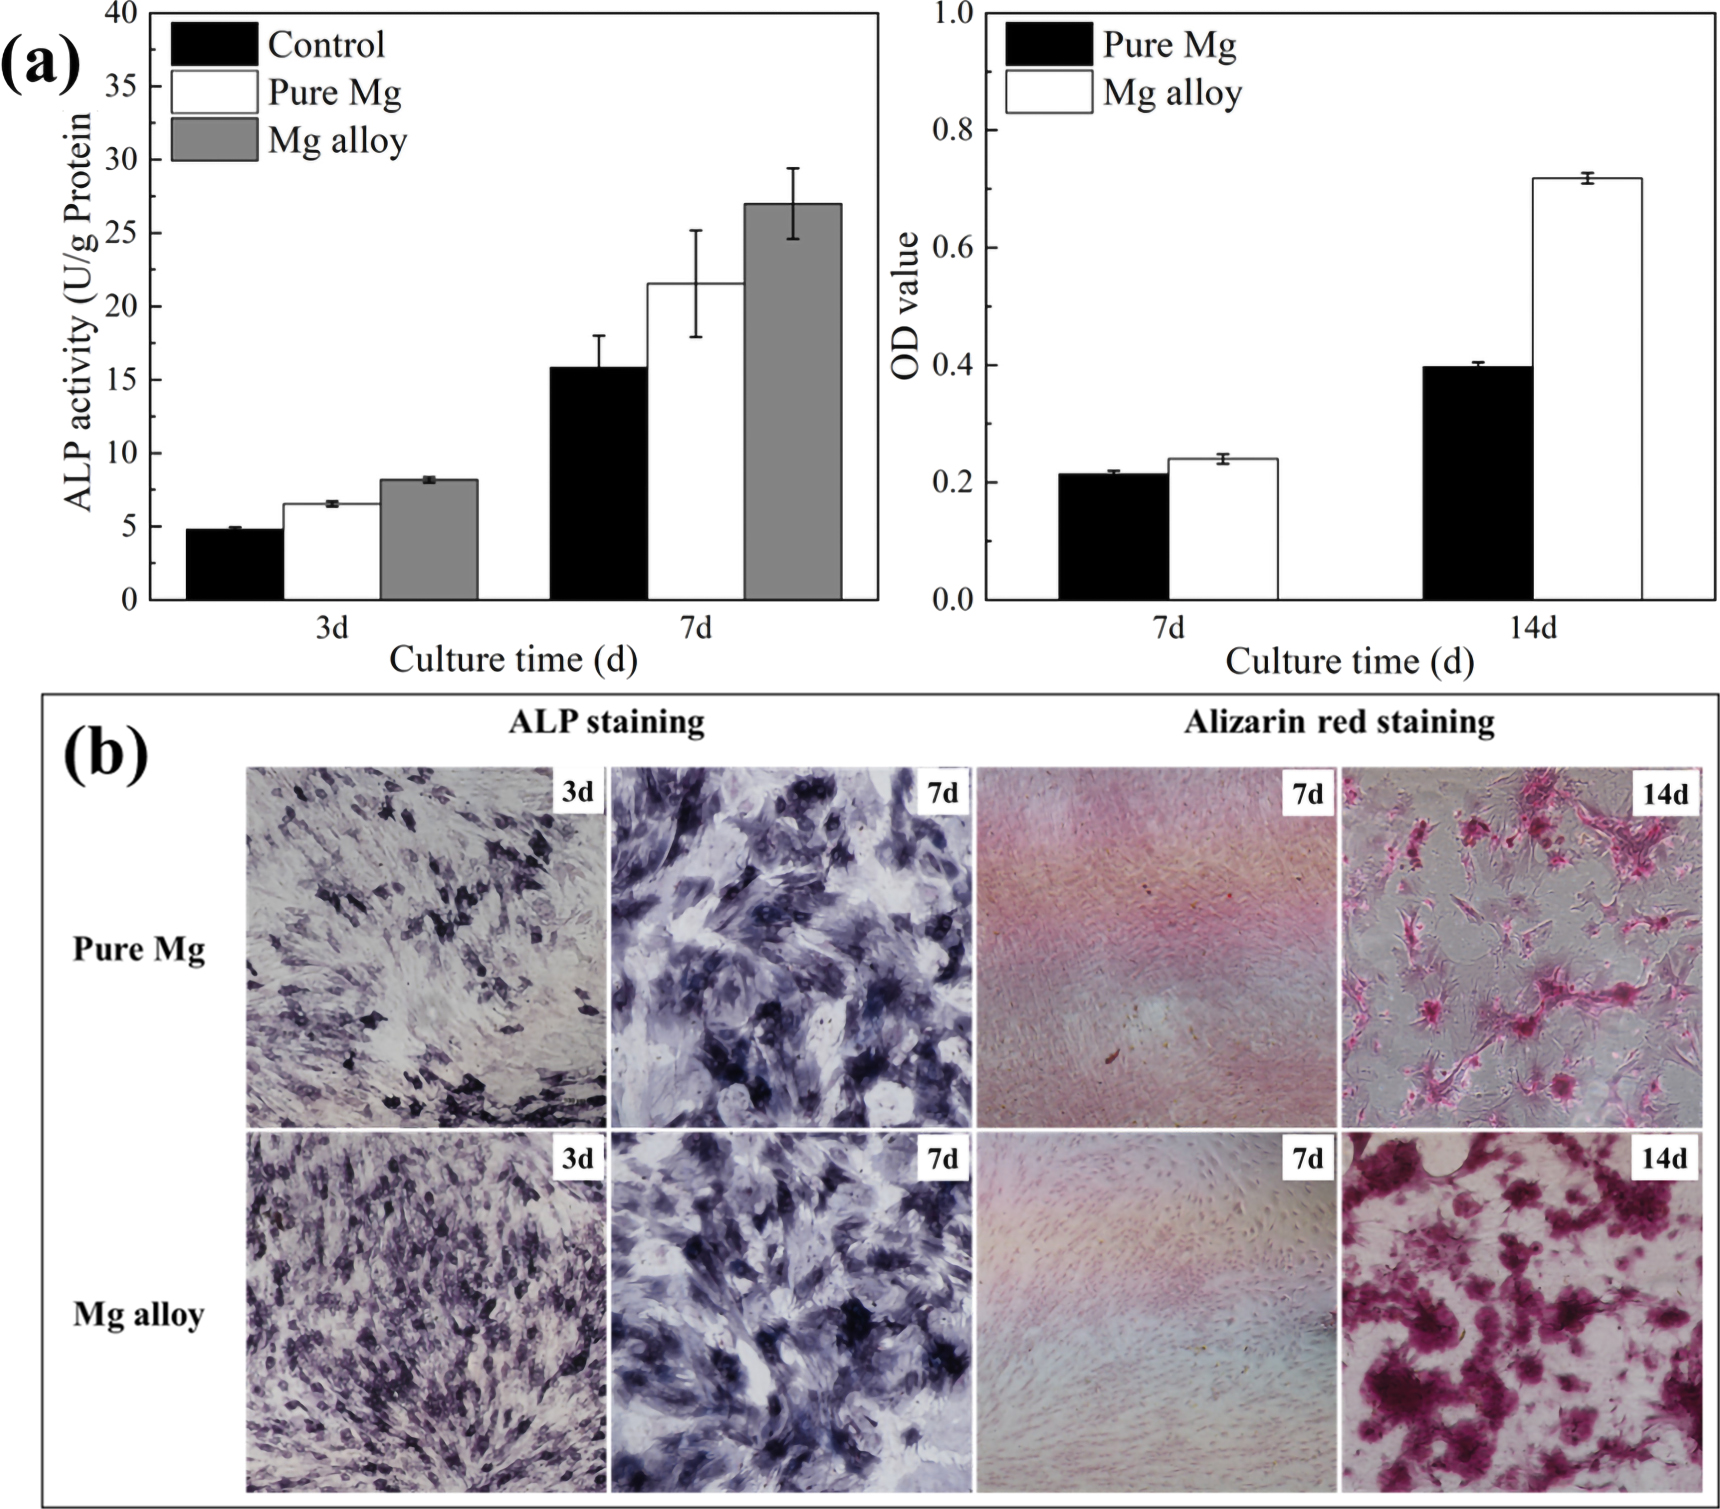
Standard image High-resolution imageECM and ALP activities are important signs of osteogenic differentiation. Figure 8(a) displays the ALP and Alizarin red staining results obtained from RMSC cells cultured in 50% extracts. It can be observed that pure Mg and Mg alloy groups showed a significant increase of ALP activity from 7th day to 14th day. For the 14th day's results, the ALP activity of the Mg alloy groups was significantly higher than that of the pure-Mg groups. ALP results showed that the Mg alloy induced stronger osteoblastic differentiation than the pure Mg group for RMSC cells.

Figure 8. In vitro osteogenesis-promoting properties of Mg-Gd alloys.
Download figure:
Standard image High-resolution imageThe ECM was evaluated by alizarin red staining, and the results are shown in figure 8(b). It can be seen that Mg alloy significantly improved the red staining area. The relative absorbance values of the matrix mineralization in the pure Mg and Mg alloy group were 0.21 ± 0.02, 0.23 ± 0.03, respectively, cultured for 7 days. The values increased to 0.38 ± 0.02 and 0.69 ± 0.03. These results demonstrate that the ECM ability of the Mg alloy sample was higher than that of the pure-Mg sample. Moreover, the pure-Mg and Mg-alloy groups showed obviously positive staining results, suggesting that there was massive expression of ECM in these groups.
4. Discussion
4.1. Effect of ECAP process on microstructures of Mg-Gd alloy
4.1.1. Evolution of grain structure during ECAP process
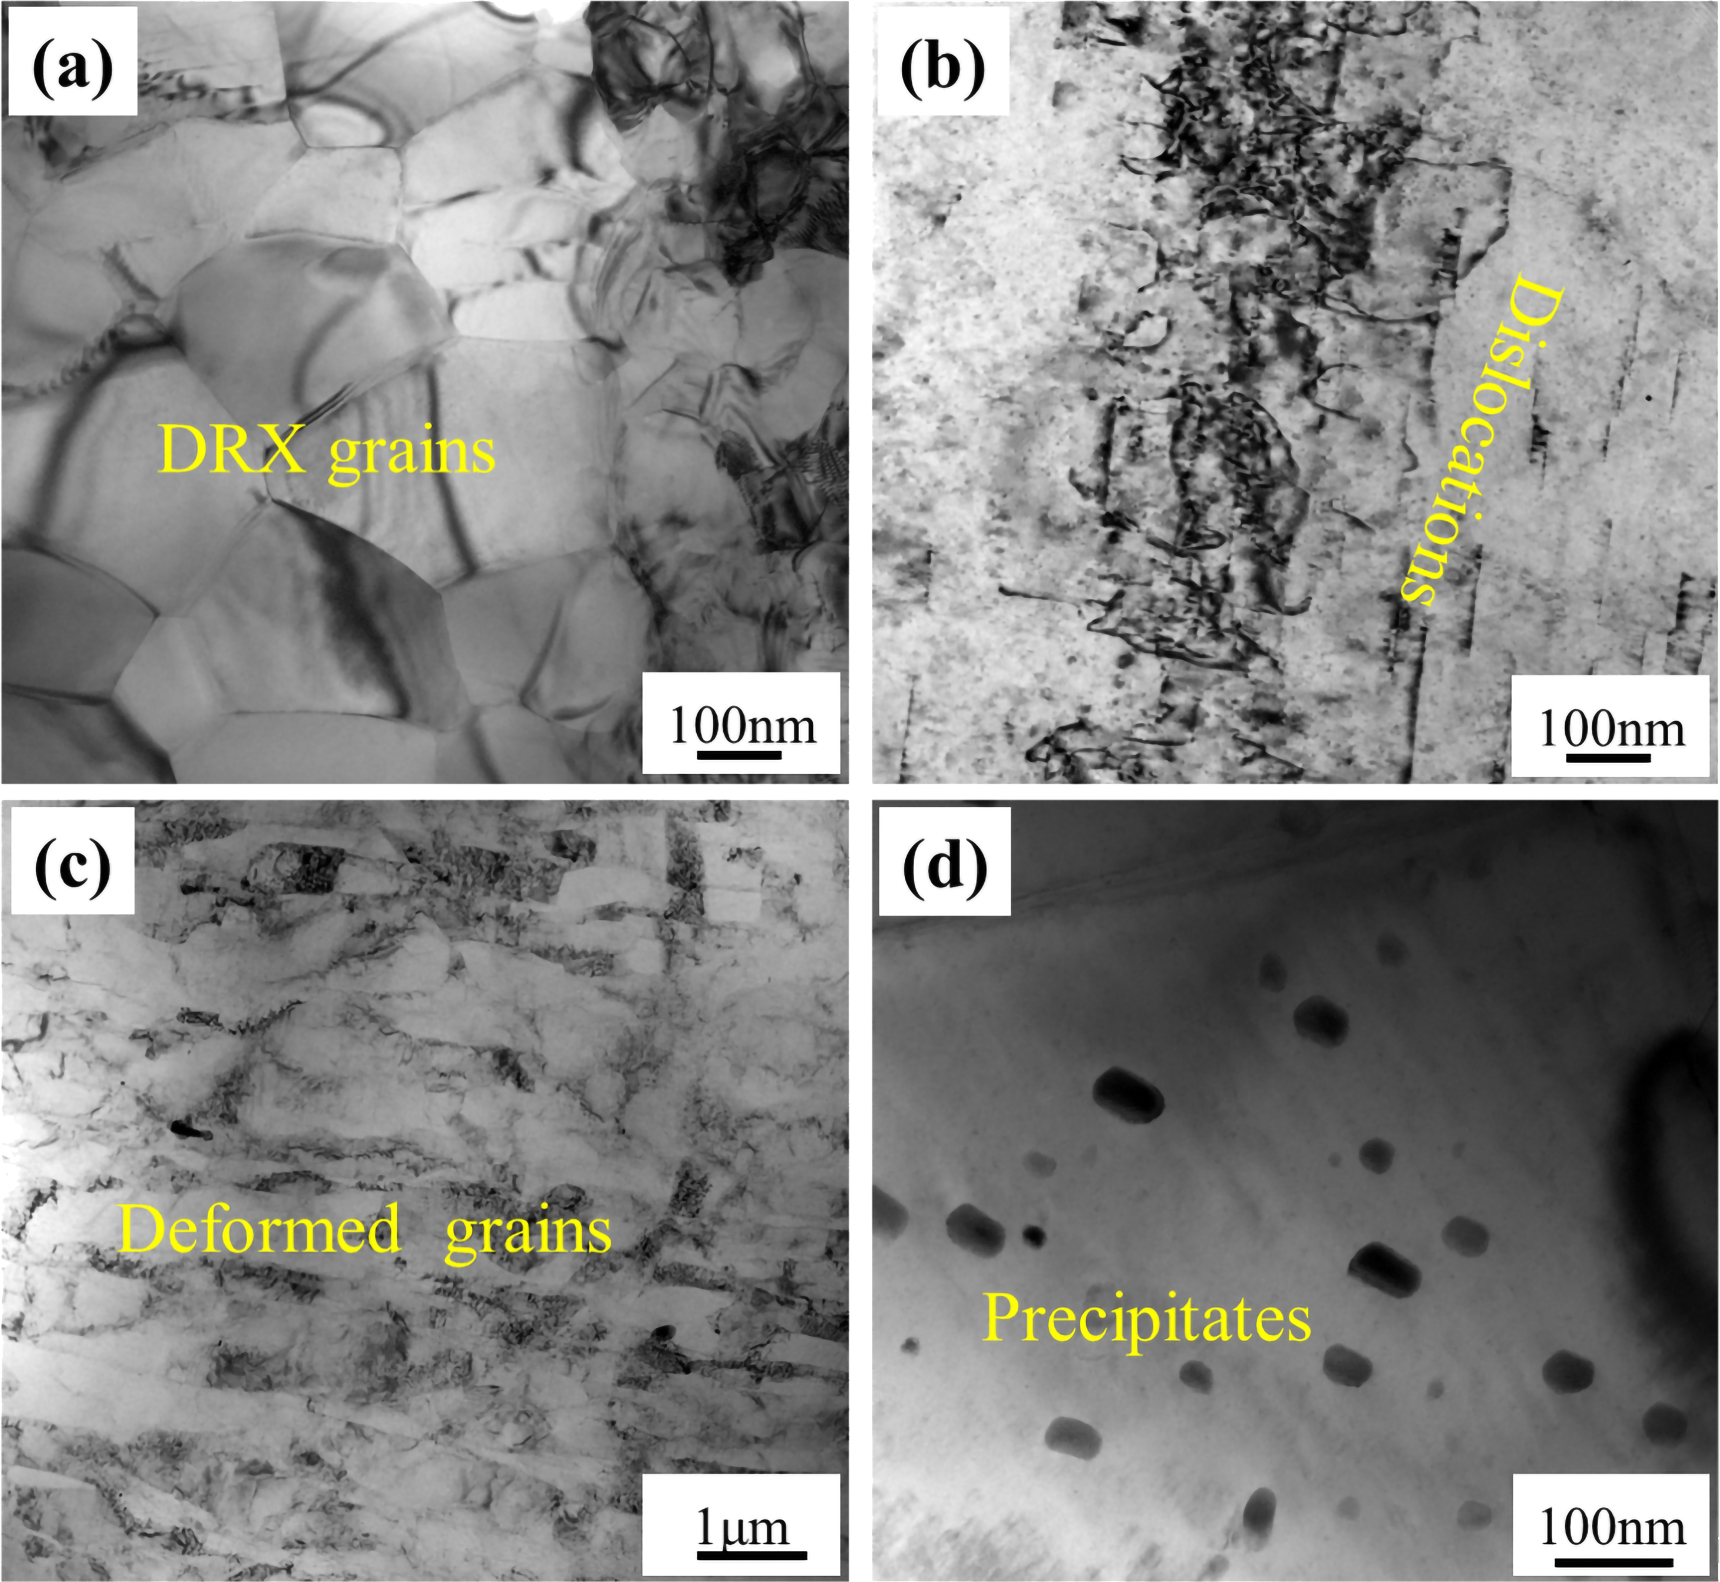
According to the Mg-Gd phase diagram, the solubility of Gd in the Mg matrix is near zero at room temperature [25]. At 548 °C, eutectic reaction will result in formation of Mg5Gd eutectic phase. Consequently, the typical microstructure in the as-cast Mg-Gd alloy was composed of a Mg matrix and a lamellar eutectic structure. ECAP processed at high temperatures can refine the grain structure and fragment the eutectic structure. During thermomechanical processes, dynamic recrystallization (DRX), which is related to the final grain size, occurs in Mg alloys because of the high processing temperature. As shown in figure 9(a), the size of the DRX grains in the 8p-ECAP Mg alloy was approximately 300 nm. Compared to other deformed Mg-Gd alloys, Mg-Gd alloys processed by ECAP have smaller grain sizes [26, 27]. The smaller grain size of the Mg-Gd alloy is attributed to the high true strain caused by ECAP. The relationship between the number of ECAP passes and true strain can be expressed as [19]:

Where  and
and  are ECAP parameters and constants in a specific processing method. It can be inferred that a high strain was obtained by increasing the number of ECAP passes, which is a vital step in obtaining an ultra-fine grain structure in the Mg-Gd alloy.

Figure 9. Grain structure evolution in 8p-ECAP MG-GD alloy. (a) DRX grains, (b) dislocations, (c) deformed grains, (d) precipitates.
Download figure:
Standard image High-resolution imageApart from the fine DRX grains, coarse grains in the as-cast state or grown DRX grains were deformed by dislocation motion during the ECAP process. As shown in figure 9(b), a large number of dislocations were observed. These dislocations were absent from the DRX grains, which may be attributed to the high critical shear stress for activating dislocations in ultrafine grains [28]. Because the dislocation motion was directional, many deformed grains along the ECAP direction were observed, as shown in figure 9(c). The deformed grains are approximately several micrometers in length, which is smaller than that of the as-cast state. This means that the deformed grains are grown in DRX grains, and the DRX process occurs completely. In contrast to conventional extrusion and rolling, the high strain induced by ECAP promotes the DRX process to refine the grain structure.
4.1.2. Evolution of secondary phases during ECAP process
The solubility of Gd in the Mg matrix increased with increasing temperature. Because ECAP process temperature was 300 °C, it will result in dissolving Gd atoms into Mg lattice. Precipitation occurred in the saturated Mg matrix under the interaction stress field induced by dislocations. It can be observed from figure 9(d) that precipitates were detected. Precipitation is a phase-transformation process. The three conditions necessary for the occurrence of the phase transformation process are structural, energy, and component fluctuations [29]. The Mg-Gd alloy processed by ECAP had many deformed grains that contained a large number of dislocations. The presence of line dislocations benefits the segregation of Gd atoms, which results in structural, energy, and component fluctuations. Thus, ECAP at high temperatures promotes the formation of nanoscale precipitates in the Mg-Gd alloy.
In addition to nanosized precipitates, the microscale Mg5Gd eutectic structure also undergoes fragmentation and redistribution processes. Compared with the as-extruded Mg-Gd alloys, the Mg5Gd phase was completely fragmented into particles by the ECAP process with high passes [30]. Refinement of the Mg5Gd phase is attributed to the high strain induced by altering the ECAP passes, which has been demonstrated in other alloys [31].
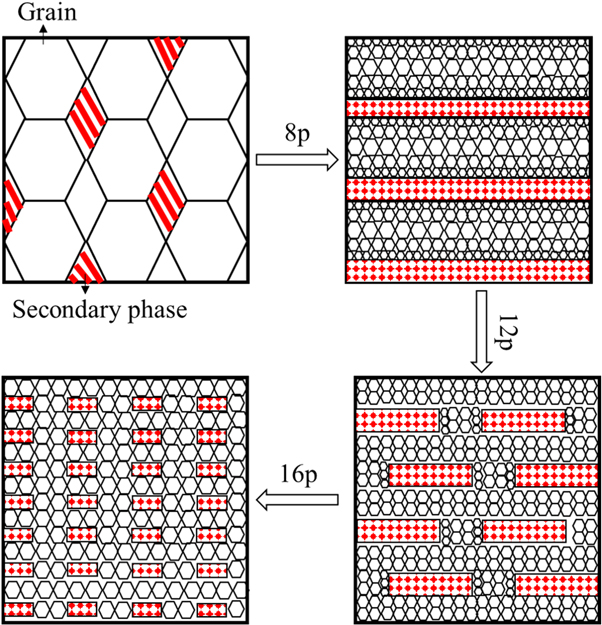
In fact, the evolution of the grain and eutectic structures has an inseparable relationship. A schematic of the microstructural evolution of the Mg-Gd alloys is shown in figure 10. The appearance of the particle phase promoted DRX via a particle-stimulated nucleation (PSN) mechanism [32]. Meanwhile, the particle-shaped secondary phase inhibited the growth of fine grains. When the Mg-Gd alloy was subjected to ECAP process of 8 passes, the grain size around the dense particle phase was smaller than that around the sparse particle region. This result indicates that a bimodal grain structure can appear in 8p-ECAP Mg alloys. With increasing number of ECAP passes, the particle-shaped secondary phase is distributed uniformly, which indicates that the space of the particles becomes large. Therefore, the grain-size distribution is uniform. Coarse particles, in comparison with dense fine particles, were unable to hinder the growth of DRX grains. Consequently, the grain size of the Mg-Gd alloy processed by ECAP with high passes was larger than that of the fine-grained region in the 8p-ECAP alloy.
Figure 10. Schematic diagram of microstructure evolution of Mg-Gd alloy processed by ECAP.
Download figure:
Standard image High-resolution image
4.2. Mechanical properties and corrosion behavior of Mg-Gd alloys
It can be observed from the tensile results that the tensile strength of Mg-Gd alloys increased at the expense of ductility after the ECAP process. The corrosion resistance decreased significantly when the number of passes in the ECAP process reached 16. The improvement in tensile strength was attributed to fine DRX grains, nanosized precipitates, and fragmented secondary phases. Figure 9(a) shows that the size of the DRX grains was approximately 300 nm, which resulted in a high density of the grain boundaries. The boundaries of the DRX grains are high-angle boundaries. According to the Taylor equation, tensile strength is related to dislocation density [33]. An increase in the high-angle boundary can inhibit dislocation movement, thereby achieving grain boundary strengthening [34]. Nano-sized precipitates also acted as obstacles to dislocation motion. The interaction between precipitates and dislocations generates numerous dislocation loops via the Orowan mechanism [35]. The secondary phases with lamellar structures were broken into fine particles after the ECAP process, resulting in a strengthening effect owing to the differences in the crystalline parameters. Previous studies have demonstrated that the smaller the particle size, the more significant the strengthening effect [36]. In summary, the high strength of the 8p-ECAP Mg alloys was attributed to the fine DRX grains, nano-sized precipitates, and fine particle phase. However, the smaller the grain size, the lower the dislocation density that can be stored in the grain interior. Increasing the number of ECAP passes leads to a reduction in the tensile strength; however, the ductility of the Mg alloys can be improved.
Microstructural evolution can affect the corrosion resistance of Mg-Gd alloys. After the ECAP process, the corrosion rates of the 8p and 12p Mg-Gd alloys were comparable to those of the as-cast state, but lower than that of the 16p alloy. In the as-cast Mg-Gd alloy, the potential difference between the Mg and Mg5Gd phases contributes to local corrosion [22]. Reducing the size and uniformity of the distribution of the Mg5Gd phase can alleviate local corrosion. However, the DRX process induced by ECAP resulted in a decrease in the grain size, which promoted grain boundary density. These grain boundaries corrode faster when exposed to a corrosive medium. Therefore, it can be concluded that the lower corrosion rates in the 8p and 12p Mg-Gd alloys can be attributed to competition between the refinement of the Mg5Gd phase and the increase in the grain boundary density.
As the number of ECAP passes increased, the corrosion rate of the 16p-ECAP alloy increased. Discussions on microstructural evolution have demonstrated that fine DRX grains grow with increasing holding time. The grown DRX grains were deformed under mechanical strain, eventually introducing a high dislocation density. It is simpler to remove atoms from dislocation locations because they have fewer atomic bonds than the dislocation-free zones. Grains that contain line defects are vulnerable to deterioration under acidic conditions. In other words, a potential difference between the dislocation center region and dislocation-free region is created; as a result, the corrosion rate increases as the dislocation density increases [22]. Therefore, Mg alloys processed by the ECAP of high passes are detrimental to corrosion resistance.
5. Conclusions
In this study, we successfully prepared a high-strength biodegradable Mg-Gd alloy with an ultrafine microstructure using the ECAP process. The following conclusions were drawn.
- (1)During ECAP, the grain structure was refined by DRX, and the size of the DRX grains was approximately 300 nm. In addition to the fine DRX grains, the grown DRX grains deformed as the ECAP process continued. A large number of dislocations are observed within the deformed grains.
- (2)The secondary phase with lamellar structures was fragmented into fine particles of submicrometer size. As the number of ECAP passes increased, the distribution of the fragmented secondary phase changed from a uniform distribution along the ECAP direction. In addition, the space between the particles increases, which is detrimental to the growth of fine DRX grains. Therefore, the microstructure, such as grains and fragmented secondary phases, coarsened with increasing number of ECAP passes.
- (3)The tensile test results indicated that the mechanical properties of the Mg-Gd alloy could be significantly improved. The improvement in the tensile strength was attributed to the ultrafine DRX grains and fragmented secondary phases. Increasing the number of passes of ECAP contributes to the growth of the grain structure and fine particles, which improves ductility.
- (4)The corrosion rates calculated from the hydrogen evolution test demonstrated that the 8p-ECAP Mg-Gd alloy with an ultrafine microstructure possessed better corrosion resistance than the 16p-ECAP alloy. Cell and osteogenesis induction experiments confirmed that Mg-Gd alloys processed by ECAP exhibited good biocompatibility.
Acknowledgments
This research was supported by The Featured Clinical Discipline Project of Shanghai Pudong (PWYts2021-3) and The Youth Scientific Research Project of Shanghai Municipal Health Committee (20204Y0478).
Data availability statement
The data cannot be made publicly available upon publication because no suitable repository exists for hosting data in this field of study. The data that support the findings of this study are available upon reasonable request from the authors.
Conflict of interest
On behalf of the authors declare that there is no conflict of interest in this study.