
Abstract
To improve the electrochemical performance of nickel silicate as anode material of lithium ion batteries, nickel silicate nanosheets anchored on reduced graphene oxide composite is synthesized via hydrothermal method using sandwich-like silica/graphene oxide as raw material. Nickel silicate nanosheets anchor on both sides of the reduced graphene oxide and cross each other to form net-like structure. The thickness of the nanosheets is about 15 nm. The composite shows an optimal electrochemical performance as lithium ion battery anode material. The initial capacity is 1525.7 mAh g−1 and the capacity retains 815.5 mAh g−1 after 50 cycles at the current density of 50 mA g−1. It exhibits good rate performance. When the current density is increased to 5000 mA g−1, the average capacity is as high as 415.8 mAh g−1. The composite also demonstrates an exceptional high cycling stability with the capacity of 423.4 mAh g−1 after 1000 cycles.
Export citation and abstract BibTeX RIS

Original content from this work may be used under the terms of the Creative Commons Attribution 4.0 licence. Any further distribution of this work must maintain attribution to the author(s) and the title of the work, journal citation and DOI.
1. Introduction
As one of the most popular mobile energy storage and conversion equipment, lithium-ion batteries (LIBs) have achieved great success in business and are widely used in many fields, such as electronic products, aerospace and so on. However, with the rapid development of electronic equipment and the demand of electric vehicles, it is urgent to explore new battery materials with higher power density and energy density to meet the requirements of long-time standby of electronic equipment and long endurance mileage of electric vehicles [1–3]. Nowadays, the anode material of commercial lithium-ion batteries is mainly graphite. Although graphite is cheap and easy to prepare, its theoretical capacity is as low as 372 mAh g−1, limiting the further development of LIBs. The ideal LIBs anode materials should have high specific capacity, high coulombic efficiency, excellent cycling stability, and low price [4–6].
Metal Silicates are very abundant on the Earth, which are cheap and harmless to the environment. Recently, it is reported that metal silicates exhibit electrochemical activity with high specific capacity [7–10]. The unique layered structure of metal silicates can alleviate the volume variation during lithiation/delithiation to a certain extent. For the merits of metal silicates, it has become a research hotspot of electrode materials [11–18]. Though metal silicates have many advantages as anode material of LIBs, they also has great defects. Yang et al reported the synthesis of nickel silicate tubes as the electrode material of lithium-ion battery. Its initial capacity is as high as 1650 mAh g−1. However, its capacity declines sharply, only 308.5 mAh g−1 after 21 cycles [16]. The capacity decays so fast that the pristine metal silicates are not suitable for practical application before modification. The sharp decline of capacity is ascribed to the poor conductivity and the huge volume expansion in the process of lithium ion intercalation of metal silicates. The volume variation during repeating lithiation/delithiation causes structural instability. Combining metal silicate with conductive materials, such as carbon materials, is very common to improve its conductivity. Reduced bulk materials to nanostructure is an effective way to alleviate the volume change and improve their cycling stability. Liang group assembled a flexible electrode of cobalt nickel silicate/carbon nanotube composite, which shows high capacity and good rate performance. It delivers a high reversible capacity of 1047 mAh g−1 at 0.1 A g−1, and the capacity is as high as 453.4 mAh g−1 with the rate current density of 2 A g−1 [19]. Tang et al synthesized carbon coated zinc silicate nanorod bundles. The composite shows good rate performance and cycling stability. When the current density changes from 0.05 to 2 A g−1, the capacity is 798 and 444 mAh g−1, respectively. The capacity retains as high as 427 mAh g−1 at 2 A g−1 after 1000 cycles [20]. Graphene has excellent conductivity and good toughness. It is often added to electrode materials to improve the conductivity of electrode materials and retrieve the stress of volume variation [8–12]. Qu et al synthesized a novel layered zinc silicate/carbon nanostructure, the addition of reduced graphene oxide (RGO) network further improved the conductivity of zinc silicate/carbon composite (ZnSiC-0.5-RGO) [9]. Compared with pure zinc silicate, the lithium storage performance of ZnSiC-0.5-RGO has been greatly improved. The discharge capacity of the composite is 778 mAh g−1 at 50 mA g−1 after 50 cycles, much higher than that of pristine zinc silicate (144 mAh g−1).
Graphene has good flexibility, which can alleviate the internal stress caused by the volume change of electrode material to a certain extent. Thus, nickel silicate/RGO (NS/RGO) sandwich-like structure composite is synthesized to improve the electrochemical performance of NS. NS nanosheets anchor on the surface of RGO uniformly and densely. The nanosheets cross each other to form a network structure, which is conducive to the penetration of electrolyte. The sandwich-like structure NS/RGO composite shows good lithium storage performance with high reversible capacity, good rate performance, and cycling stability. It delivers a capacity as high as 423.4 mAh g−1 after 1000 cycles at a high current density of 5000 mA g−1.
2. Experiment
2.1. Sample preparation
Graphene oxide (GO) was synthesized with modified Hummers method [21]. Cetyltrimethylammonium bromide (0.15 g) was added to the mixture of absolute ethanol (120 ml) and deionized water (30 ml) under stirring. Then, 10 ml of GO solution (3.95 g ml−1) was dropped into the above solution and stirred for 10 min to ensure the evenly dispersion of GO. NH3·H2O (3 ml) and tetraethyl orthosilicate (1 ml) were added into the above solution in sequence and stirred at room temperature for 4 h. The precipitate was washed with ethanol and dried in at 60 °C for 8 h to obtain silica/graphene sandwich-like structure (SiO2/GO).
The as-prepared SiO2/GO sandwich-like structure (60 mg) was ultrasonically dispersed into 35 ml of deionized water. NiCl2·6H2O (1 mmol), NH4Cl (5 mmol), and NH3·H2O (1 ml) were added successively to the above solutions and stirred vigorously. The solution was transferred to the autoclave (50 ml) and heated in an oven at 140 °C for 20 h. The precipitate was washed with deionized water and ethanol by centrifugation, dried at 60 °C for 6 h. The obtained gray black sample is NS/RGO.
Pristine NS is synthesized by annealing NS/RGO in a muffle furnace at 450 °C for 4 h in air atmosphere for comparative experiment.
2.2. Characterization
Powder x-ray diffraction (XRD) was carried out on a D8 Advance x-ray diffractometer. Raman spectrum was collected using a Renishaw IN VIA micro-Raman spectroscopy system. Scanning electron microscope images (SEM) were collected by field emission-scanning electron microscopy (JEOL-7100F) with energy-dispersive x-ray spectroscopy (EDS). Transmission electron microscope (TEM) was carried out with transmission electron microscopy (JEM-2100F).
2.3. Electrochemical measurements
The electrochemical performance was conducted with 2016 coin cells assembled in the glove box full of argon. The electrode consists of active materials, carbon black, and carboxyl methyl cellulose (CMC) with the ratio of 70:25:5. The slurry was spread on the copper foil and kept at 60 °C for 2 h. The copper foil was kept at 120 °C for 24 h in vacuum oven to ensure the adhension of slurry. Then the copper foil was cut into round pieces using punching machines. The electrolyte is LiPF6 solution (1 M) in the mixture of ethylene carbonate (EC)/dimethyl carbonate (DMC) (VEC:VDMC = 1:1). The coin cells were kept at room temperature for at least 4 h before electrochemical investigation to ensure the penetration of electrolyte into electrode. Galvanostatic charge/discharge cycling measurements were conducted at room temperature on NEWARE (CT-4008) battery test system. Voltammetry (CV) and electrochemical impedance spectroscopy (EIS) were executed on an electrochemical workstation (CHI760E).
3. Results and discussions
Figure 1(a) shows the XRD pattern of NS/RGO. The diffraction peaks of NS/RGO can be indexed to orthorhombic Ni3Si2O5(OH)4 (JCPDS card No. 020–0791). The cell constants are a = 0.529 nm, b = 0.914 nm, and c = 0.723 nm. There are no impurity peaks in the XRD pattern, indicating that there is no impurity, such as Ni(OH)2. There are no diffraction peaks of RGO, perhaps because RGO content is too low or RGO nanosheet is too thin. It can be seen clearly that the XRD diffraction peaks of NS/RGO is wide and the intensity is relatively low, indicating the poor crystallinity and nanosize of composite.
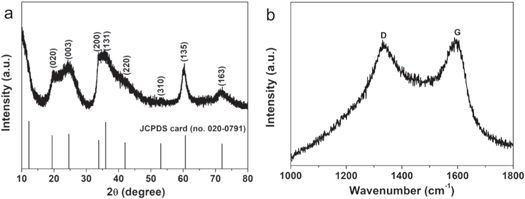
Figure 1. (a) XRD pattern of NS/RGO, (b) Raman spectrum of NS/RGO.
Download figure:
Standard image High-resolution imageRaman spectrum was tested to establish the existence of RGO in the product, as shown in figure 1(b). Two characteristic peaks of carbon locate at 1337 and 1590 cm−1, ascribed to the D peak and G peak. The D peak is attributed to the phonon mode vibration induced by the defects and disorder of RGO. The G peak is ascribed to the stretching motion of all sp2 atom pairs in the carbon ring [22].
Figure 2(a) shows the SEM image of SiO2/GO sandwich-like structure. It can be seen clearly that the product is flaky, with good dispersion and no agglomeration. The edge of graphene can not be seen in the SEM image, indicating that GO is completely covered with SiO2. Figure 2(b) shows the element distribution scanning (EDS) of the SiO2/GO sandwich-like structure. The contours of C, Si and O elements have no difference, indicating that SiO2 is uniformly coated on the surface of GO.
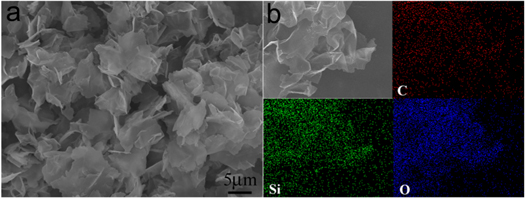
Figure 2. (a) SEM image of SiO2/GO, (b) EDS of SiO2/GO.
Download figure:
Standard image High-resolution imageThe morphology and structure of NS/RGO composite was characterized by SEM and TEM, as shown in figure 3. Figure 3(a) shows the low magnification SEM image of NS/RGO. NS/RGO inherits the flaky morphology of SiO2/GO well. The dispersity of the composite is also very good, without any agglomeration. The high magnification SEM image (Figure 3b) presents that the surface of NS/RGO is not so smooth, which is network structure formed by the crossed NS nanosheets. The nanosheets grow densely on the RGO surface. The thickness of the nanosheets is about 15 nm. The edge part is also covered with NS nanosheets. RGO can not be seen from the SEM image. Figure 3(c) shows the corresponding element distribution image of NS/RGO complex. The contours of C, Ni, Si, and O are completely the same, indicating the homogeneous growth of NS nanosheets on RGO. TEM image shown in figure 3(d) further verifies that NS nanosheets grow densely on the surface and edge of RGO. Figure 3(e) shows a high magnification TEM image of NS/RGO. There is no obvious lattice fringe, indicating the low crystallinity of the sample. This result is consistent with that of XRD. The corresponding selected area electron diffraction (SAED) of NS/RGO is presented in figure 3(f). The diffraction ring is not so obvious, further indicating the low crystallinity of the product. The electron diffraction rings correspond to the planes of (131), (220), and (135), respectively.
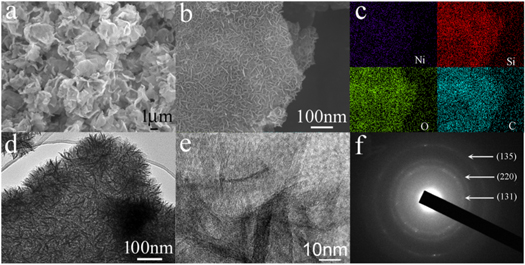
Figure 3. The morphology and structure of NS/RGO: (a) Low-magnification SEM image, (b) High-magnification SEM image, (c) EDS image, (d) TEM image, (e) HRTEM image, (f) SAED.
Download figure:
Standard image High-resolution imageFigure 4(a) shows the initial three CV curves of the NS/RGO with a voltage window of 0.01–3 V versus Li+/Li at a scan rate of 0.05 mV s−1. It can be seen clearly that the initial CV curve is quite different with the following ones, indicating the irreversible reaction. There is an intense cathode peak at 0.8 V in the first cathodic process, which disappears completely in the second cycle. This peak is ascribed to the decomposition of electrolyte, the formation of solid electrolyte interphase (SEI) film on the surface of electrode material and the initial insertion of lithium ions [12, 23]. There are three broad and weak anodic peaks centered at 1.3, 2.1, and 2.4 V, respectively, corresponding to the multi-step extraction reactions of Li+ in the silicate layer. The peak at 0.8 V become very weak in the second cycle, and a new intense peak appears at 1.7 V, corresponding to the intercalation reaction of lithium ion into silicate layers. The CV charging curve of the second cycle has almost no change in the position of the peak, but a small change of the peak intensity. The CV curve of the third cycle almost overlaps the second one, indicating the good reversibility of lithiation/delithiation. The CV curves of NS presented in figure S2 are similar with those of NS/RGO, indicating the exact electrochemical reaction. In the process of charging and discharging, the possible mechanism can be described as follows [12, 24, 25].


The reactions of (1) and (2) occur at the same time, which are irreversible. In the first charge process, all the reactions occur. For the following charge process, only the reversible reactions of (3) and (4) occur.
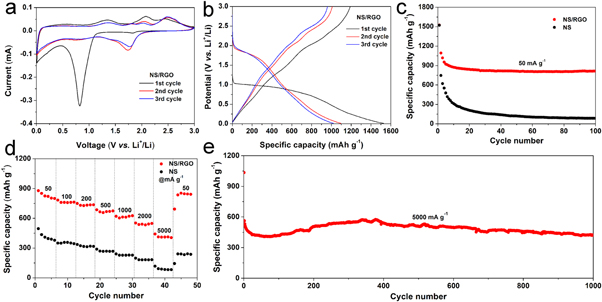
Figure 4. Electrochemical performance: (a) CV curves of NS/RGO, (b) discharge/charge plots of NS/RGO, (c) cycling performance of NS/RGO and NS at the current density of 50 mA g−1, (d) rate capability of NS/RGO and NS, (e) Long performance of NS/RGO at the current density of 5000 mA g−1.
Download figure:
Standard image High-resolution imageFigure 4(b) shows the first three discharge/charge curves of NS/RGO composite at the current density of 50 mA g−1. There is an obvious platform from 0.5–1 V in the first discharge curve. There are three unobvious platforms at about 1.3, 2.1 and 2.4 V, respectively. The platforms are completely consistent with the peak positions observed in the CV curves. In the following discharge curve, there is an obvious inclined platform at about 1.7 V. The following charging curves has almost no change compared with the first cycle. The initial discharge/charge capacities of NS/RGO are 1525.7/1190.6 mAh g−1, with the initial coulombic efficiency (ICE) of 78.04%. The ICE is too low to use in practice, which can be improved via prelithiation [10, 26]. The discharge/charge curves of NS at the current density of 50 mA g−1 are manifested in figure S3.
The cycling performance of NS/RGO and pure NS at the current density of 50 mA g−1 are shown in figure 4(c). It can be seen clearly that NS/RGO manifests better electrochemical performance than pristine NS. The initial capacity of NS/RGO (1525.7 mAh g−1) is comparable with that of NS (1523.1 mAh g−1). However, the discharge capacities of NS/RGO in the second and third cycles are 1094.5 and 1018.8 mAh g−1, which are much higher than that of pristine NS (747 and 621.9 mAh g−1). The initial capacity loss up to 335.1 mAh g−1 of NS/RGO is ascribed to the irreversible reactions, the decomposition of electrolyte, the formation of SEI film on the surface of electrode materials, and the initial irreversible insertion of lithium ions [19]. The first cycle coulomb efficiency of NS is 57.97%, which is lower than that of NS/RGO (78.04%). The coulomb efficiency of NS/RGO in the second cycle is 92.20%, which reaches slowly to 100% and keeps stable. The discharge capacity of NS/RGO retains as high as 815.5 mAh g−1 after 50 cycles, which is much higher than that of pristine NS (85.7 mAh g−1).
Rate performance is an important parameter to evaluate electrode materials. The battery was tested at different current densities ranged from 50 to 5000 mA g−1, as shown in figure 4(d). The average capacities of NS/RGO are 824.3, 764.3, 735.4, 669.9, 615.6, 543.0, and 415.8 mAh g−1 at the current densities of 50, 100, 200, 500, 1000, 2000, and 5000 mA g−1. When the current returns to 50 mA g−1, the average discharge capacity recovers to 819.4 mAh g−1. The capacities are much higher than that of pure NS under the same condition. The average capacities of pristine NS are only 417.6, 351.4, 320.9, 271.8, 230.5, 184.6 and 91.8 mAh g−1, respectively. When the current density comes back to 50 mA g−1, the capacity is only 223.1 mAh g−1. Especially at the high current density of 5000 mA g−1, the capacity of NS/RGO is 4.5 times of that of NS. The ratio is the highest one at various current densities.
Cycling stability is a key index to measure the battery materials. NS/RGO is performed at the current density of 5000 mA g−1 for 1000 cycles, as shown in figure 4(e). The initial discharge capacity of the battery is 1034.5 mAh g−1, the ICE is 49.43%, then the CE increases gradually to and stabilizes at 100%. During the cycle, the capacity firstly decreases, then increases, and finally decreases slowly. The discharge capacity of the second cycle is 561.9 mAh g−1. The capacity decreases to the minimum value of 407.3 mAh g−1 at the 58th cycle. After that, the capacity began to rise, up to the maximum value of 574.6 mAh g−1 at the 377th cycle. The tendency of the capacity increasing with cycling has been observed for many transition metal oxide and transition metal silicates. The enhancement of lithium-ion storage can be attributed to the growth of the electrochemical gel-like polymer layer and lithiation-induced reactivation [27–29]. The capacity retains as high as 423.4 mAh g−1 after 1000 cycles. The results show that NS/RGO has high reversibility during cycling, and the cycling stability is excellent.
Electrochemical impedance spectroscopy (EIS) is an important method to study electrochemical interface processes. The better cycling and rate capability kinetics of NS/RGO than NS was further investigated with Nyquist plots of EIS with the frequency ranging from 0.01 to 100 kHz, as shown in figure 5(a). The inset is the corresponding equivalent circuit. The EIS spectra is composed of a semicircle in the high frequency region and an inclined line in the low frequency region. The semicircle radius indicates the electronic transmission conductivity (Rct). The smaller the diameter of the semicircle, the smaller the values of Rct. The inclined line in the low-frequency region corresponds to the Warburg impedance, which represents the diffusion of lithium ions in the electrode material. The greater inclination of the oblique line corresponds to the greater lithium ion diffusion coefficient, and the better performance of the battery. The Rct value of NS/RGO electrode material is simulated to be 78 Ω, which is much smaller than that of NS electrode material (169 Ω). Smaller charge transfer resistance is conducive to faster charge transfer, endows better electrochemical dynamic kinetics. The determined Rct value shows that the addition of RGO substrate greatly improves the conductivity of NS/RGO composites. The lithium ion diffusion coefficient D can be calculated according to the following formula [30, 31]:
In this formula, R is the gas constant, T is the absolute temperature, A is the area of the electrode, n is the number of electrons transferred in a single molecule during the oxidation process, F is the Faraday constant, C is the Li+ concentration with the value of 7.69 × 10⁻³ mol cm−3, σ is the Warburg factor related to impedance Z' (Z' ∝σω−1/2). Figure 5(b) shows the linear fitting between Z' and ω−1/2. The Warburg factor values of NS/RGO and pure NS are 471.3 and 625.2, respectively. The corresponding lithium ion diffusion coefficient of NS/RGO and NS are 2.17 × 10⁻¹⁹ and 1.24 × 10⁻¹⁹ cm2 s−1, respectively. It is apparent that NS/RGO displays smaller electronic resistance and larger lithium ion diffusion coefficient than NS, indicating better electrochemical performance of NS/RGO.
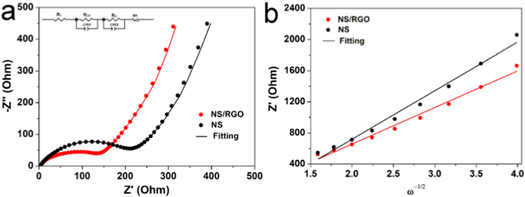
Figure 5. (a) EIS and (b) the relationship of Z'and ω−1/2 in the low frequency region of NS/RGO and NS.
Download figure:
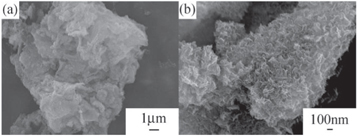
Standard image High-resolution imageEx-situ SEM images of NS/RGO at 5000 mA g−1 after 1000 cycles are collected to verify the structural stability. The low magnification SEM image (figure 6(a)) manifests that the sheet-like structure of NS/RGO retains very well. After ultrasonic cleaning of the product, the high magnification SEM image (figure 6(b)) presents that the NS nanosheets grown on GO is still densely and homogeneously, indicating the structure of NS/RGO keeps integrity. In contrary, pristine NS broken into powder after cycling (figure S4). The results illustrate that RGO substrate not only improves the electronic conductivity but also alleviates the stress caused by the volume change during repeating lithiation/delithiation.
Figure 6. (a) Low magnification and (b) High magnification ex-situ SEM images of NS/RGO after 1000 cycles at 5000 mA g−1.
Download figure:
Standard image High-resolution image
4. Conclusions
The composite of nickel silicate nanosheets anchored on RGO substrate is prepared via sol-gel and subsequent hydrothermal method. This sandwich-like structure exhibits excellent lithium storage. Nickel silicate provides high capacity. RGO, as a flexible substrate, can enhance the electronic conductivity of the composite and release the internal stress caused by the volume change during the charge and discharge process. NS/RGO composite shows high reversible capacity, excellent rate performance, and splendid cycling stability. It delivers a capacity as high as 423.4 mAh g−1 at a high current density of 5000 mA g−1 after 1000 cycles.
Acknowledgments
This work was supported by the National Natural Science Foundation of China (Grant Nos. 51802139), the Natural Science Foundation of Henan Province (Grant Nos. 222102240114, 222102320263, 222102240090), the Plan of Young Backbone Teachers in Colleges and Universities of Henan Province (Grant No. 2019GGJS243) and the Fundamental Research Funds for Collage Students Innovation and Entrepreneurship Training Program of Henan Province (Grant No. 202211070013).
Data availability statement
The data cannot be made publicly available upon publication because they are not available in a format that is sufficiently accessible or reusable by other researchers. The data that support the findings of this study are available upon reasonable request from the authors.
Supplementary data (0.5 MB DOCX)