
Abstract
Ti-6Al-2V-0.5Zr-1.5Mo alloys is a new type of titanium alloys developed on the basis of Ti-6Al-4V alloys. Compared with Ti-6Al-4V alloys, they are low in cost and excellent in performance. To offer an idea for hot working production, their thermal deformation behavior was studied through a Gleeble3500 machine, and the microstructure evolution during the thermal deformation was analyzed. After the experiment, the true stress-strain curves at strain rates of 0.001 s−1, 0.01 s−1, 0.1 s−1 and 1 s−1 at temperatures of 800 °C, 850 °C, 900 °C, and 950 °C were worked out. The result showed that the flow stress decreased as the deformation temperature rose and the strain rate fell. The peak stress constitutive equation and flow stress prediction model were built through the Arrhenius equation. The correlation coefficient between the predicted data and the experimental data reached 0.9811, which meant that the flow stress could be predicated accurately through Arrhenius equation. In addition, the processing map was established based on the DMM theory, and the best process parameters of such an alloy were figured out.
Export citation and abstract BibTeX RIS

Original content from this work may be used under the terms of the Creative Commons Attribution 4.0 licence. Any further distribution of this work must maintain attribution to the author(s) and the title of the work, journal citation and DOI.
1. Introduction
Titanium alloys, a kind of metal material developed in the middle of the 20th century, enjoy a high strength-to-weight ratio, low density, good thermal stability, and strong corrosion resistance. It has been widely used in aero-engine and airframe, medical instrument manufacturing, and other areas [1]. Ti-6Al-4V (TC4) alloys were designed and manufactured in the United States in 1954. With good heat resistance, strength, plasticity, toughness, formability, welding ability, corrosion resistance, and biocompatibility, they are seen as the first practical titanium alloys [2–5] and have had wide application. Now deep studies and long-term tests about such an alloy have been carried out [3, 6]. However, its prices remain high as a result of the high prices of vanadium. Many researchers, therefore, have designed a wide array of titanium alloys based on TC4. The idea behind the design is to add the elements Zr and Mo to replace some element V, the addition of which enables the alloys to enjoy better mechanical properties [7–10]. In this way, the Ti-6Al-2V-0.5Zr-1.5Mo alloys boats lower cost and higher performance than TC4 alloy. The thermal processing of these new titanium alloys is an indispensable part of the processing and application. Through thermal processing regulation, an ideal microstructure can be found, which in turn improves the properties of materials [11, 12]. However, only a few studies were carried out on the hot deformation behavior of Ti-6Al-2V-0.5Zr-1.5Mo alloys.
In this paper, a Ti-6Al-2V-0.5Zr-1.5Mo alloy melted in a VAR furnace, which was produced by Yunnan Titanium Industry Co., LTD was used as the sample material, and the isothermal compression experiment was carried out by a Gleeble3500 thermal simulation test machine. Given the fact that titanium will undergo an allotropic transformation from α-Ti to β-Ti at 882.5 °C, based on the hot compression experiment of TC4 alloys conducted by Ji et al the experiment was carried out in the deformation temperature range of 800 °C–950 °C and the strain rates of 0.001–1 s−1 [13, 14]. We also studied how deformation temperatures and deformation rates influenced the stress-strain curves and microstructure evolution of the alloy. The tissue transformation was predicted and appropriate conditions for deformation were decided to prevent damage based on the Arrhenius equation [15] and the flow stress constitutive model. Given the fact that strain variables would influence the flow stress, a flow stress constitutive model was established. The thermal processing map was established, and the optimal processing parameters were obtained based on the DMM thoery.
2. Materials and experimental methods
The material is a Ti-6Al-2V-0.5Zr-1.5Mo alloy plate, a type of new optimized α+β titanium alloys based on TC4 [16, 17]. Its original structure is shown in figure 1. It can be seen that it has a thick and needle-like α phase, and the original β phase is very coarse, with its average grain size as big as hundreds of microns. The sample was cut by a wire cutting machine into cylinders with the size of φ8 mm × 12 mm.
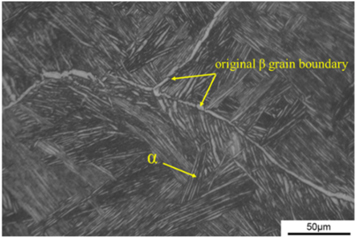
Figure 1. The original microstructure of the Ti-6Al-2V-0.5ZR-1.5Mo alloy.
Download figure:
Standard image High-resolution imageThe hot compression experiment was conducted in a Gleeble-3500 thermal simulator at the temperatures of 800 °C, 850 °C, 900 °C, and 950 °C and the strain rates of 0.001 s−1, 0.01 s−1, 0.1 s−1, and 1 s−1, respectively. Each compression process is shown in figure 2. The samples were heated to the deformation temperature at a heating rate of 5 °C s−1 and were compressed before the temperature was maintained for 3 min. The deformation degree of all samples was 50%. In the last step, they were cooled to room temperature through in situ water spraying. A graphite sheet was placed between a sample and an indenter to reduce the friction between them. This way, the deformation degree of all samples was the same. The samples were sectioned in the axial direction of the compression, and then the microstructures of the central areas in the samples were observed. The samples were corroded in the aqueous solution of hydrofluoric acid and nitric acid (3 ml HF + 6 ml HNO3 + 100 ml H2O) for 10 s to erode their boundaries. Then their microstructures were observed under a light microscope.
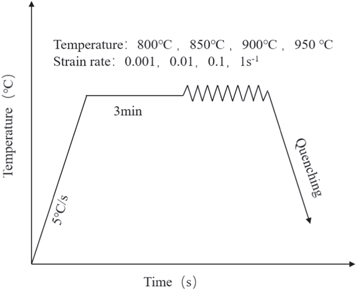
Figure 2. Schematic of compression tests of the Ti-6Al-2V-0.5Zr-1.5Mo alloy.
Download figure:
Standard image High-resolution image3. Experimental results
3.1. True stress-strain curves
The true stress-strain curves of the Ti-6Al-2V-0.5Zr-1.5Mo alloy under different deformation conditions are shown in figure 3. It showed that the flow stress increased when the deformation temperature decreased and the strain rate rose. During the thermal deformation, the changes in the flow stress were dependent on the interaction between work hardening and softening caused by dynamic recovery and recrystallization [18, 19]. It was changed as a result of dislocation multiplication and disappearance, as well as dislocation slip and climb.
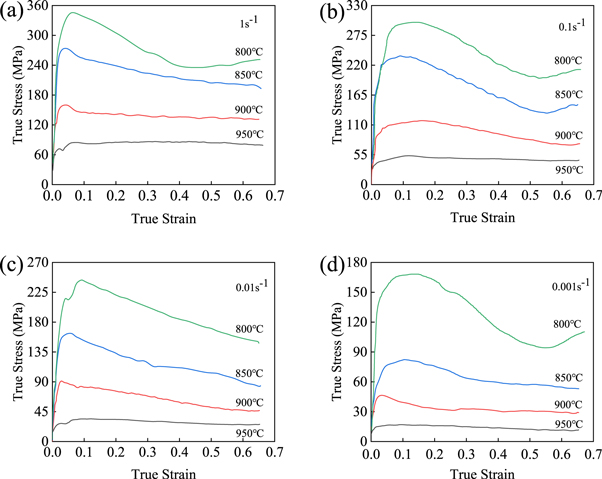
Figure 3. True stress-true strain curves of the Ti-6Al-2V-0.5Zr-1.5Mo alloy at different temperatures with strain rates of (a) 1 s−1, (b) 0.1 s−1, (c) 0.01 s−1, (d) 0.001 s−1.
Download figure:
Standard image High-resolution imageThe flow stress decreased with temperatures when the deformation rate was unchanged. This is because when the temperature rises, the internal energy of atoms increases continuously, and the dislocation is easy to break away from the pinning effect of solid solution atoms, thus promoting dislocation slip and climb and making grains coordinated. In addition, the alloy has enough energy at grain boundaries and dislocation entanglement to provide dynamic recrystallization nucleation, so the softening effect caused by dynamic recovery and recrystallization is more significant, resulting in lower flow stress [20]. Moreover, the increase of deformation temperatures enables the temperature of the alloy to exceed that of the phase transformation, which turns the (α+β) alloy into a β-phase one. Since α-Ti is close-packed and hexagonal structured, while β-Ti is body-centered and cubic structured, there are more slip systems in the β phase than in the α phase, thus slip is easier to happen in the β phase, which is also a reason for the lower flow stress.
When the deformation temperature is unchanged, the flow stress increased with strain rates. The deformation rate mainly affects the time frame of softening mechanism during thermal deformation. At low strain rates, there is enough time for dislocation slip and climb caused by deformation and for dynamic recrystallization to be nucleated and grow. Under such a condition, the softening mechanism takes a dominant role, making the flow stress tend to decrease after crossing the peak value. At higher strain rates, there is only a short time for dynamic recovery and recrystallization, and work hardening becomes dominant, which brings greater deformation resistance and higher flow stress [21].
In the end, the true stress-change curves of the rear segment are likely to go up with the increase of the strain, work hardening, and higher flow stress as a result of the multiplication and accumulation of dislocations in the alloy [22].
3.2. Microstructure evolution
3.2.1. Macrostructure
Figure 4 is the macroscopic morphology of the samples before and after hot compression. The samples without receiving hot compression are cylinders of φ8 mm × 12 mm. After hot compression, they become drum-shaped, with a maximum width of about 12 mm and a height of about 6 mm. Different drum deformation was observed in all samples receiving hot compression, indicating that the deformation inside the samples was uneven during hot compression. No cracks or damage were found on their surfaces. The results show that the temperature range of 800 °C–950 °C is good for the Ti-6Al-2V-0.5Zr-1.5Mo alloy to be produced. In the current research, microstructure analysis focuses on the central area of deformed samples.

Figure 4. Macro morphology of the samples.
Download figure:
Standard image High-resolution image3.2.2. Effect of deformation temperatures on the microstructure evolution of the Ti-6Al-2V-0.5Zr-1.5Mo Alloy
At a strain rate of 0.001 s−1, the microstructures of the samples receiving deformation at the true strain of 0.69 and at different temperatures are shown in figure 5. As the deformation temperature increases, more microstructure areas underwent dynamic recrystallization. As shown in figure 5(a), at the deformation temperature of 800 °C, the deformation temperature required was relatively low, and the dynamic recrystallization was not completely carried out. There are many coarse and long grains, among which there are fine grains formed by dynamic recrystallization. At the deformation temperature of 850 °C, the proportion of dynamic recrystallization rose, but coarse grains without dynamic recrystallization were found mixed with the fine grains of dynamic recrystallization, generating a mixed crystal structure. This makes the microstructure of the alloy less uniform, which is not conducive to its performance (see figure 5(b)). As shown in figure 5(c), at a higher deformation temperature of 900 °C, the original structure of the strip was not observed, which meant that complete dynamic recrystallization had occurred. Now the microstructure was relatively uniform, and the grains looked small. Despite the disappearance of the original structure, it can be seen that this high temperature has coarsened the dynamic recrystallization, and the dynamic recrystallization grains enjoy significant growth (see figure 5(d)). This is similar to the result given by Ji et al [13]. When the temperature is lower than 900 °C, the α phase is dominant. With the increase of the temperature, recrystallized grains grow significantly. When the temperature rises to 950 °C, both dynamic recrystallization and the shift from α phase to β phase happen.

Figure 5. Microstructure of the alloy at the strain rate of 0.001 s−1 and at different deformation temperatures. (a) 800 °C, (b) 850 °C, (c) 900 °C, (d) 950 °C.
Download figure:
Standard image High-resolution image3.2.3. Effect of strain rates on the microstructure evolution of the Ti-6Al-2V-0.5Zr-1.5Mo Alloy
In figure 6, the microstructures of the Ti-6Al-2V-0.5Zr-1.5Mo alloy which was deformed at the true strain of 0.69 at 900 °C and different strain rates are shown. As shown in figures 6(a)–(d), as the strain rate rose from 0.001 s−1 to 1 s−1, the grains gradually became smaller. This is very similar to the results offered by Peng et al when conducting hot compression on TC4-DT alloys [23]. This can be explained by the fact that lower strain rates mean longer deformation time when the deformation temperature is constant. At high temperatures, the activity of grain boundaries is enhanced, and grains are more likely to grow. Thus grains are more likely to grow when the strain rate is lower and the deformation time at a high temperature is longer. However, a higher strain rate will shorten the deformation, which is not conducive to the complete dynamic recrystallization of the alloy and some grains are not completely refined [24]. As shown in figures 6(b), a small number of large grains in the shape of strips can be observed. In figure 6(d), an obvious zonal structure is formed. The effects of grain growth and dynamic recrystallization, therefore, need to be taken into consideration when deciding the strain rates.

Figure 6. Microstructure of the alloy after deformation at different strain rates of (a) 0.001 s−1, (b) 0.01 s−1, (c) 0.1 s−1, (d) 1 s−1 at 900 °C.
Download figure:
Standard image High-resolution imageBased on the analysis above, the microstructures of the Ti-6Al-2V-0.5Zr-1.5Mo alloy after deformation under different conditions are shown in figure 7. It shows that deformation temperatures and strain rates play a role in the microstructure evolution of the alloy during hot deformation [25, 26]. As the deformation temperature rose, more dynamic recrystallization was seen, but grains enjoyed some growth. When the temperature was constant, as the strain rates went up, the dynamic recrystallization grains became smaller, less dynamic recrystallization occurred, and the microstructures looked more nonuniformed. The reason behind this is that temperatures can prevent the movement of grain boundaries, through which the dynamic recrystallization is completed. Thus more dynamic recrystallization occurs and grains are more likely to grow when the temperature rises. The strain rate can prevent dislocation accumulation. When the strain rate increases, dislocation accumulation happens more quickly, and it is easier to reach the critical strain required for dynamic recrystallization. However, the deformation time will be shortened, which may lead to incomplete dynamic recrystallization and increase the nonuniformity of the structure [27].
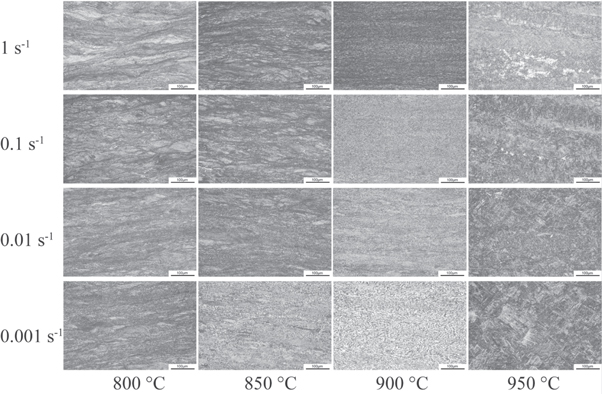
Figure 7. Microstructure of the Ti-6Al-2V-0.5Zr-1.5Mo alloy after deformation under different conditions.
Download figure:
Standard image High-resolution image4. Constitutive model
4.1. Peak stress constitutive equation
In the process of hot compression, flow stress can be affected by deformation temperatures, deformation rates, and deformation amounts [28, 29]. When elements in the alloy and its initial structure are unchanged, the classical hyperbolic-sinusoidal Arrhenius equation [30] and Zener-Hollomon parameter (Z) [31] can reflect how flow stress changes with deformation temperatures and deformation rates.


In these equations, constants 
 and
and  are unrelated to deformation temperatures;
  represents the thermal deformation activation energy (KJ mol−1), and
  the universal gas constant (8.314 J·mol−1K−1).
In the Zener-Hollomon parameter, the stress-strain relationship is as follows:

Equations (5)–(7) were built based on equations (1)–(3). The relation of 
 and
and ![$In\left[sinh(\alpha \sigma )\right]-In\unicode{x003AD}$](https://content.cld.iop.org/journals/2053-1591/10/1/015802/revision2/mrxacb0b6ieqn8.gif) was figure out after a linear regression analysis by using the least square, as shown in figures 8(a)–(c). After the calculation, the values of
was figure out after a linear regression analysis by using the least square, as shown in figures 8(a)–(c). After the calculation, the values of 


 were found to be 5.556, 0.046, 0.0102, and 3.663, respectively.


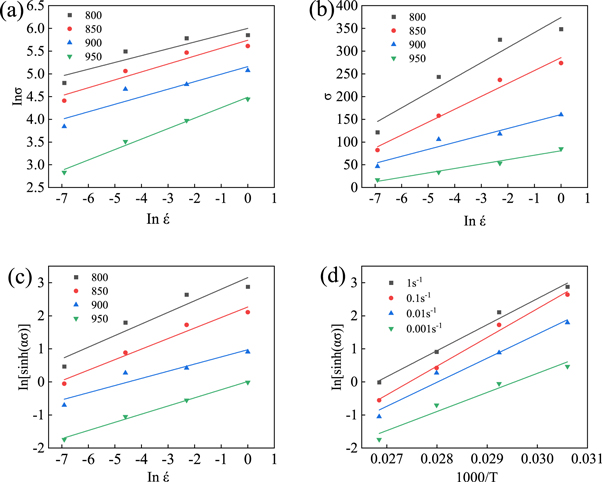
Figure 8. Relation of (a)  (b)
(b)  (c)
(c) ![$In\left[sinh(\alpha \sigma )\right]-In\unicode{x003AD},$](https://content.cld.iop.org/journals/2053-1591/10/1/015802/revision2/mrxacb0b6ieqn15.gif) and (d)
and (d) 
Download figure:
Standard image High-resolution imageAfter adjustment, equation (7) can be expressed as follows:

The  relation is shown in figure 8(d), and the value of
  is 739996.7 J mol−1.
Equation (9) can be formed based on equation (4):

The ![$InZ-In[sinh(\alpha \sigma )]$](https://content.cld.iop.org/journals/2053-1591/10/1/015802/revision2/mrxacb0b6ieqn19.gif) relation is shown in figure 9, and the value of
relation is shown in figure 9, and the value of  is 2.017 × 1031. The constitutive equation of Ti-6Al-2V-0.5Zr-1.5Mo alloy can be expressed in equation (10).

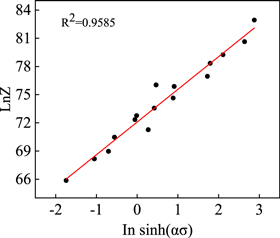
Figure 9. Relation of ![$InZ-In\left[sinh\left(\alpha \sigma \right)\right].$](https://content.cld.iop.org/journals/2053-1591/10/1/015802/revision2/mrxacb0b6ieqn21.gif)
Download figure:
Standard image High-resolution imageIt can be transformed into the Zener-Hollomoll parametric form, which is equation (11).
4.2. Flow stress constitutive equations
Apart from deformation rates and temperatures, the strain variables also affect flow stress. It is commonly believed that the parameters 

 and
and  in equations (7) and (8) are affected by the strain variables during the construction of the constitutive model [32]. The flow stress in the true stress-strain curves was calculated, and the strains were between 0.05 and 0.65 with an interval of 0.05 to ensure that the prediction based on the Arrhenius model is accurate. Then much regression analysis was conducted on the flow stress value to work out the parameters at each strain. Table 1 shows the results. The sixth-order polynomial equation shown in (12) is used to demonstrate the relation between the strain and the correlation constant.

Table 1. Constants in the Arrhenius model at different strains.
| ε | α*10–3 | n | Q(KJ) | InA |
|---|---|---|---|---|
| 0.05 | 10.58 | 3.62 | 750.63 | 73.28 |
| 0.1 | 10.53 | 3.74 | 768.11 | 75.04 |
| 0.15 | 10.75 | 3.65 | 738.81 | 72.06 |
| 0.2 | 10.85 | 3.64 | 713.60 | 69.60 |
| 0.25 | 10.83 | 3.74 | 701.18 | 68.51 |
| 0.3 | 10.84 | 3.89 | 691.70 | 67.70 |
| 0.35 | 11.02 | 3.97 | 673.49 | 65.94 |
| 0.4 | 11.40 | 3.93 | 643.05 | 62.84 |
| 0.45 | 11.88 | 3.81 | 608.03 | 59.22 |
| 0.5 | 12.28 | 3.66 | 583.42 | 56.68 |
| 0.55 | 12.49 | 3.55 | 580.87 | 56.45 |
| 0.6 | 12.61 | 3.49 | 591.12 | 57.51 |
| 0.65 | 13.31 | 3.27 | 559.61 | 54.07 |
Figure 10 shows how variables 

 and
and  changed with the strain, which can be expressed in equation (13). The square of the regression coefficient of each parameter is over 0.96, which means that the fitting effect is good.


Figure 10. Nonlinear polynomial fitting to work out the strain-dependent constants. (a) α, (b) (c)
(c)  and (d)
Download figure:
Standard image High-resolution imageThe constitutive model of the predicted flow stress of the Ti-6Al-2V-0.5Zr-1.5Mo alloy during hot deformation can be worked out after using equation (13) in equations (4) and (14). In the model, the influence of deformation temperatures, rates, and strain variables on the flow stress is taken into consideration.

The flow stress calculated based on the constitutive model was compared with that from tests to ensure that the model was accurate, as shown in figure 11. The changes in the calculated value are almost consistent with that of the one from tests, and the deviation is small. The calculated flow stress decreased with deformation temperatures, and it fell when the deformation rate went down, which is consistent with the flow stress in the tests. This means that the constitutive model is able to reflect the thermal deformation behavior of the Ti-6Al-2V-0.5Zr-1.5Mo alloy accurately.
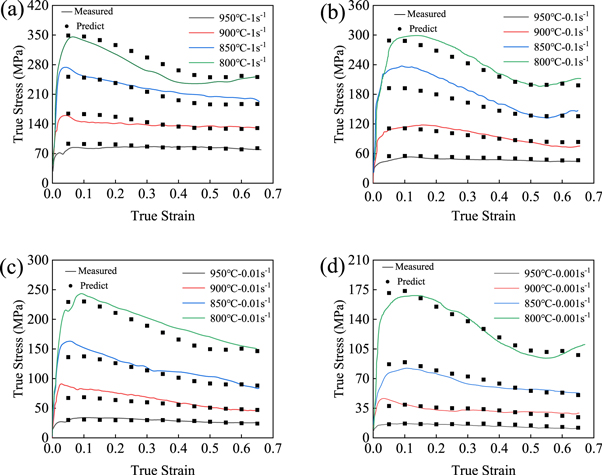
Figure 11. Comparison of the experimental and calculated flow stress at different strain rates: (a) 1 s−1, (b) 0.1 s−1, (c) 0.01 s−1 and (d) 0.001 s−1.
Download figure:
Standard image High-resolution imageCorrelation coefficient (R) and absolute mean error (AARE) were introduced to work out the deviation between the calculated flow stress and the experimental one in a quantitative way [33, 34]. The equations are shown in (15) and (16):


In the equation,  represents the flow stress gained in the thermal deformation experiment;
  represents the flow stress worked out based on the constitutive model, and
  and
and  represent the mean values of
  and
and  respectively.
  can reflect the linear correlation between the measured stress value and the calculated one, and AARE represents the error degree of the built model. Thus when the value of
  is larger and that of AARE is smaller, the model will bring a more accurate result. As shown in figure 12(a), most of the data points are distributed near the optimal regression line, and the square of
  reaches 0.9811 after fitting, indicating that the flow stress obtained from the experiment matches well with the calculated one. The AARE value at each deformation rate is shown in figure 12(b), and AARE is 6.84%, which means that the error caused by the model calculation is insignificant.

Figure 12. Correlation between the experimental and calculational flow stress. (a)  (b) AARE (%).
Download figure:
Standard image High-resolution image4.3. Hot processing map
The thermal processing map, which was established based on the DMM theory by Prasad et al [35], can reflect the changes in the internal microstructures of materials when processed under different parameters. It can also directly show instability areas and safe areas during thermal deformation, which offers a theoretical foundation for deciding the optimal processing parameters of metal materials.
According to the hypothesis of the DMM theory, the external input energy (P) consists of two parts: dissipative energy (G) and dissipative covariate (J) [36]:

The ratio of  to
to  depends on m, which is the sensitive factor of deformation rates. The factor
  can be obtained by the cubic spline function of
  and
and 

During thermal deformation, the dissipated power dissipation coefficient as a result of changes in the microstructures of the alloy is represented by the dimensionless parameter 

In general, metal materials enjoy the best thermal deformation performance when  [28]. During thermal processing, if
  is high, it means that the dynamic recrystallization of the material is more complete, and it is easier to produce fine equiaxed grains. When
  the power dissipation map of the Ti-6Al-2V-0.5Zr-1.5Mo alloy is shown in figure 13. The figure shows that
  is the smallest when the strain rates are 0.03 s−1–0.3 s−1 and the temperature is low, or when the strain rate is as high as 0.1 s−1–1 s−1 and the temperatures are between 800 °C–930 °C. The value of
  increased significantly, be the deformation rates rose or fell. When the deformation rate was below 0.03 s−1 or above 0.3 s−1,
  was basically above 0.3. Thus better-recrystallized structure can be produced if thermal deformation was conducted under such conditions.
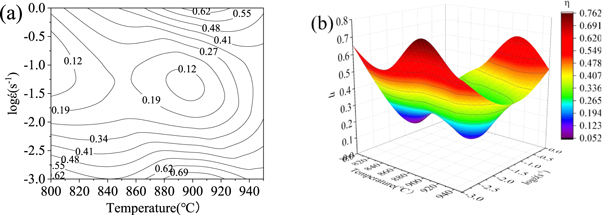
Figure 13. Power dissipation maps of the Ti-6Al-2V-0.5Zr-1.5Mo alloy  (a) Power dissipation contour map, (b) 3d power dissipation map.
Download figure:
Standard image High-resolution imageBut even if the  of an area is high, it does not necessarily mean it is safe for processing, as further analysis needs to be conducted on the instability parameter
  [37]. From the definition of the DMM model, the instability criterion of materials in the process of thermal deformation can be expressed as follows:

Here, ξ
 is an instability parameter. When it is less than 0, the external part of the materials will be unstable. Twin crystals, adiabatic shear, cracks, and other defects will be seen in instability areas, which should be avoided during hot working.
The maps of thermal working are composed of a power dissipation map and a flow instability map. As shown in figure 14, instability areas are calculated based on the Prasad criterion [38], which are mainly located in the upper left, middle, and lower right of the hot working map, namely the area with low temperatures and high strains, as well as that with high temperatures and low strains. Specifically, one area is at temperatures between 800 °C to 845 °C and deformation rates between 0.006 s−1 to 1 s−1, and the other at temperatures between 800 °C to 845 °C and deformation rates between 0.001 s−1 to 0.18 s−1. When conducting hot working, one should choose safe areas, which are outside the instability ones, and the value of η needs to be high. Combining the processing map with the microstructures and the processing map to divide them into different areas so that the microstructure maps of the alloy under different processing conditions can be worked out, as shown in figure 15.

Figure 14. The processing map of the Ti-6Al-2V-0.5Zr-1.5Mo alloy at different strains: (a)  (b)
(b)  and (c)
Download figure:
Standard image High-resolution image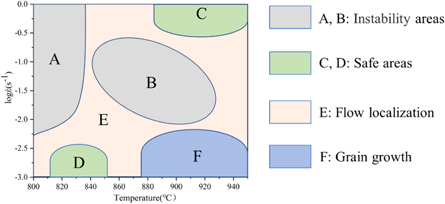
Figure 15. Microstructures of various areas during processing: Instability areas (A) and (B), Safe areas (C) and (D), Flow localization (E), Grain growth (F).
Download figure:
Standard image High-resolution imageA and B in figure 15 are instability areas. Microcracks, adiabatic shear bands, voids, and other defects are seen[39–41] in these areas during processing. E is a flow localization area, and its main softening mechanism lies in DRV. Due to the lack of energy, the recrystallization in this area is incomplete. Area F is overheated. Long-term high temperatures and slow strain rates lead to the rapid growth of DRX grains, which increases the risk of instability. It is found that areas C and D are the most desirable areas for the processing of the Ti-6Al-2V-0.5Zr-1.5Mo alloy as fine DRX equiaxed grains can be formed to improve the plastic deformation of the alloy. The optimum hot processing parameters are as follows: deformation temperatures of 810 °C−850 °C and deformation rates of 0.001 s−1–0.003 s−1, and deformation temperatures of 870 °C–950 °C and deformation rates of 0.3 s−1–1 s−1.
5. Conclusions
In this study, the thermal deformation process of a new titanium alloy (Ti-6Al-2V-0.5Zr-1.5Mo) was studied at temperatures of 800 °C–950 °C, and strain rates of 0.001 s−1–1 s−1. The results were as follows:
- (1)Based on the peak stress, the thermal deformation activation energy of the Ti-6Al-2V-0.5Zr-1.5Mo alloy is calculated as 739.997 KJ mol−1, and the constitutive equation of the peak stress can be expressed as
![$\unicode{x003AD}=2.017\times {10}^{31}{\left[\sin \,h\left(0.0102\sigma \right)\right]}^{3.663}\exp \left(\displaystyle \frac{-739996.7}{RT}\right).$](data:image/png;base64,iVBORw0KGgoAAAANSUhEUgAAAAEAAAABCAQAAAC1HAwCAAAAC0lEQVR42mNkYAAAAAYAAjCB0C8AAAAASUVORK5CYII=)
- (2)The relation between relevant constants and the true strain, which are in the Arrhenius constitutive equation, was established by using the sixth degree polynomial. Their linear correlation is more than 0.98, but the value of AARE is only 6.84%, indicating that the Arrhenius constitutive equation can precisely predict flow stress, which offers a good theoretical foundation for the thermal deformation of the Ti-6Al-2V-0.5Zr-1.5Mo alloy.
- (3)Based on the DMM theory, the hot working maps of the Ti-6Al-2V-0.5Zr-1.5Mo alloy under different strains were built. The optimal process parameters were decided based on these maps: the deformation temperature range is 810 °C–850 °C and the deformation rate range is 0.001 s−1–0.003 s−1, or the deformation temperature range is 870 °C–950 °C and the deformation rate range is 0.2 s−1–1 s−1.
![$\unicode{x003AD}=2.017\times {10}^{31}{\left[\sin \,h\left(0.0102\sigma \right)\right]}^{3.663}\exp \left(\displaystyle \frac{-739996.7}{RT}\right).$](https://content.cld.iop.org/journals/2053-1591/10/1/015802/revision2/mrxacb0b6ieqn62.gif)

Data availability statement
All data that support the findings of this study are included within the article (and any supplementary files).