
Abstract
Ultrafast nanocalorimetry, in combination with high-speed IR thermography, is used to measure the interfacial thermal conductance (ITC) of the thermal contact of metal microdroplets with a solid during fast melting (including laser heating). IR thermography and membrane nanocalorimetry were used to measure the temperature difference at the membrane/sample interface during the melting and crystallization of aluminium alloy (AA7075) microdroplets (20 μm in diameter) over a wide range of heating and cooling rates (up to 105 K s−1). This is the first time ITC has been measured at such high heating and cooling rates with this new method. We found that the interfacial temperature difference reaches about 80 K during the solidification of microdroplets during laser heating. This result is significant for understanding various industrial laser-assisted processes. It has been established that ITC measured for AA7075 microdroplets gradually increases by an order of magnitude during melting in the range from the solidus temperature to the liquidus temperature of the alloy. This unusual behavior of ITC during melting can be important for understanding and optimizing laser-assisted additive manufacturing processes.
Export citation and abstract BibTeX RIS

Original content from this work may be used under the terms of the Creative Commons Attribution 4.0 licence. Any further distribution of this work must maintain attribution to the author(s) and the title of the work, journal citation and DOI.
Nomenclature

| distance from the center to the periphery of the membrane (m) |

| specific heat of the sample (J·g−1·K−1) |

| sample heat capacity (J·K−1) |

| membrane thickness (μm) |

| acceleration of gravity (m·s−2) |

| thermal contact conductance (W·K−1) |

| thermal contact conductance with liquid sample (W·K−1) |

| Grashof number (dimensionless) |

| sample melting enthalpy (nJ) |

| specific heat of fusion (J g−1) |

| intensity of thermal radiation emitted from the sample surface (r.u.) |

| distance from the hot zone of the membrane to the thermostat (m) |

| sample mass (ng) |

| Nusselt number (dimensionless) |

| Prandtl number (dimensionless) |

| heater power (W) |

| power absorbed by the sample (W) |

| heat flux from membrane to sample (W·m−2) |

| scan rate (K·s−1) |

| sample radius (μm) |

| heater radius (μm) |

| sample cross-sectional area (m2) |

| thermal contact area (m2) |

| area of the sample hemisphere (m2) |


| moments of the onset and the end of melting (s) |


| moments of the onset and the end of crystallization (s) |

| middle of the heating-cooling scan (s) |

| membrane temperature (K) |

| sample temperature (K) |

| thermostat temperature (K) |

| heat loss parameter (membrane heating) (W·m−2·K−1) |

| heat loss parameter (laser heating) (W·m−2·K−1) |

| crystallization time (membrane heating) (s) |

| crystallization time (laser heating) (s) |

| temperature difference across the sample (K) |

| temperature difference across the membrane/sample interface (K) |

| membrane emissivity (dimensionless) |

| thermal conductivity of sample (W·K−1·m−1) |

| thermal conductivity of gas (W·K−1·m−1) |

| kinematic viscosity of gas (m2·s−1) |


| density of sample and gas (kg·m−3) |

| Stefan-Boltzmann constant (W·m−2·K−4) |
1. Introduction
Fast melting and solidification of metal microdroplets are very important in many industrial processes, for example, in laser welding [1] and laser-assisted additive manufacturing [2]. Heat transfer between a metal microdroplet and a substrate is highly dependent on changes in interfacial thermal conductance (ITC). Thus, quantifying ITC is important for optimizing melting and solidification processes in applications such as laser additive manufacturing. Computer numerical simulations is one of the methods to understand the processes during additive manufacturing and their influence on the final product properties. Finite elements analysis, complex flow dynamics and even machine learning are applied [3–5]. However, the efforts are hampered by the difficulties of direct experimental observations. Particularly, modeling of powder particle interactions requires experimental data on surface heat transfer during the laser melting process [6].
ITC affects the rate of solidification, and the rate of solidification affects the development of the microstructure and mechanical properties of the resulting material [1, 7–13]. Local cooling rates during solidification in laser additive manufacturing can be thousands or even millions K s−1 [2, 7, 14]. Ultrafast nanocalorimetry makes it possible to measure the rapid melting and solidification of micro-sized samples at rates up to millions of K s−1 and even higher [15–18]. The measured microdroplet is commonly heated by a thin film heater located on the calorimeter membrane (membrane heating). However, the microdroplet can alternatively be heated by an external diode laser (laser heating) [19]. Our goal is to measure interfacial heat transfer between metal microdroplets and a substrate during fast melting and solidification at a temperature scan rate in the range from 103 K s−1 to 105 K s−1. The sample temperature was scanned in two modes with membrane and laser heating. The advantage of membrane heating is the ability to accurately measure the power absorbed (released) by the sample during melting (crystallization). The advantage of laser heating is the possibility of local heating of the microdroplet, similar to laser additive manufacturing, with the possibility of local measurement of the temperature of the microdroplet at the same time. The disadvantage of laser heating is that, so far, it is not possible to determine the power absorbed by the sample accurately. However, the possibility of carrying out measurements in both modes makes it possible to obtain reliable information on the ITC between the measured microdroplets and the substrate during fast melting and solidification. The melting and solidification of aluminium alloy microdroplets (AA7075) with a diameter of about 20 μm was studied; such microparticles are used in additive manufacturing. AA7075 is almost as strong as steel but weighs about 3 times less, so this material is often used in industry.
In our previous article [20], it was shown for pure tin microdroplets that a sharp jump in the interfacial thermal conductance  occurs immediately by an order of magnitude when the sample surface becomes liquid just before the melting point. A jump in
  just before the melting point was observed in experiments with pure aluminum, copper, and stainless steel [21]. However, an unusual gradual increase in
  with temperature was recently discovered for a microdroplet of pure indium in the temperature range of premelting [22]. The gradual change in
  found for pure indium microdroplets, indicates a gradual change in the strength of the interaction between the sample and the substrate during the melting of the sample. A similar gradual change in
  during the melting of AA7075 microdroplets in contact with a solid substrate was observed in this article.
The advantage of the method used in this work is the combination of ultrafast nanocalorimetry with high-speed IR thermography. Thus, using this new method, it is possible to measure ITC at high heating and cooling rates up to 105 K s−1, which makes it possible to simulate melting and crystallization processes occurring in laser-assisted technologies. The proposed method of ITC determination particularly represents the process of the laser powder bed fusion. In the case of additive manufacturing, the spherical particle thermal contact is complicated by the particle shape, surface defects, presence and thickness of an oxide layer and surface modifications with e.g. nucleating agents. All these parameters can be reproduced by the combined FSC IR experiments.
In the first part of the article, we discuss the experimental method and measurements of the parameters of AA7075 microdroplets. Then, measurements of ITC during fast melting and crystallization are presented for several temperature scan rates in laser and membrane heating modes.
2. Ultrafast nanocalorimetry combined with IR thermography and laser heating
2.1. Calorimetric sensor and nanocalorimetry
The membrane calorimetric sensor (XEN-39469 from Xensor Integration, NL) was used for ultrafast nanocalorimetry of metal microdroplets during their melting and crystallization. The sensor consists of a thin (about 1 μm) amorphous silicon nitride membrane with a resistance heater and thermocouples located at the central (hot zone) of the membrane, see figure 1. Thermocouples, heater, and electrical connections are formed by p-type and n-type doped polysilicon tracks. The central zone of the membrane is coated with a submicron layer of gold to smooth out temperature gradients in this zone. The electrical circuit is protected by a submicron layer of amorphous silicon nitride. Thus, the total membrane thickness  is about 1.5 μm. The measured sample with a radius of
  = 10 μm is placed on the hot junctions of two thermocouples in the center of the membrane using an optical microscope, see figure 1. To show thermocouples, the sample is off-center. However, the measured sample was located in the center, see figure 2(a). During measurements after the first melting, the position of the sample and its shape remain stable due to the cohesive forces acting between the membrane and the sample.

Figure 1. Photo of the central zone of the calorimetric sensor (XEN-39469) with a spherical sample (sample off-center to show thermocouples) (a), and a schematic (not to scale) cross-section of the sensor (b).
Download figure:
Standard image High-resolution image
Figure 2. Zoomed IR image of the central zone of the membrane with a centered spherical sample during laser heating (a) and when heated by a heater located on the membrane (b) with a color code corresponding to the intensity of infrared radiation in relative units. Note that the emissivity of doped polysilicon tracks is much higher than that of metal surfaces and the transparent membrane.
Download figure:
Standard image High-resolution imageThe sample was prepared under a binocular microscope with a variable 10x–100x magnification. Powder particles were preselected and placed onto a G300F1 TEM grid finder (purchased from Science Services GmbH, Germany) for further selection by size. Several 10 to 20 μm in diameter particles without satellites or defects were selected for the aimed temperature scanning rate range up to 105 K s−1. After that, a single particle was moved on the sensor surface, on the side protected by a thin SiN layer, to avoid alloying with gold elements of the system, see figure 1. The sample was located just above the thermopiles to ensure the lowest measurement lag and fastest temperature control system response. The fast scanning calorimetry equipment is described in detail in [17]. More information about the equipment for IR thermography is presented in [23–26].
The central hot zone of the membrane is heated by a heater consisting of two concentric polysilicon tracks, the radius of the outer track is  = 75 μm. The distances
  and
and  from the center of the membrane to the silicon frame are about 400 μm and 300 μm, respectively, see figure 1.
The sensor is installed in a thermostat with regulated temperature  and stable ambient gas pressure. The ambient gas (air) provides heat exchange between the central hot zone of the membrane and the thermostat. The heat loss from the central hot zone due to the thermal conductivity of the gas
  is proportional to
  at
at  In the opposite case, the heat loss is proportional to
  at
at  see appendix. The size of the central hot zone
  is small with respect to
  The membrane temperature
  decreases exponentially with distance
  from the center [18]. Thus, the heat generated by the heater is removed by the ambient gas before it reaches the periphery of the membrane; heat transfer between the membrane and the frame at the periphery of the membrane is negligible [18]. Thus, the heat loss from the central hot zone of the membrane is proportional to
  The contribution of thermal radiation and convection to heat loss is relatively small at micrometer sizes; these contributions are calculated in appendix.
The heat capacity  of the sample can be determined from equation (1)

where  is the addenda heat capacity,
  is the power of the heater located on the membrane,
  is the temperature of the sample measured by the thermocouples, and the factor
  describes the heat transfer from the heating zone to the thermostat. Two identical membrane sensors are installed on the standard TO5 housing, which allows the use of a differential power compensation scheme [17]. A power compensated analog differential control loop accurately controls the sample temperature [17], allowing measurements to be made at a constant scan rate
  in the range of 103 K s−1
 105 K s−1. The time resolution of calorimetric measurements varies from 6 μs to 52 μs at different scan rates
  Temperature resolution of about ±0.5 K was determined by random noise at 103 K s−1
 2·104 K s−1. However, a temperature resolution of 1.2 K was associated with a time resolution of 12 μs at
  = 105 K s−1.
2.2. Laser heating
The measurements were carried out in two modes, when the sample was heated by the heater located on the membrane (membrane heating) and by an external diode laser (laser heating). The laser spot diameter of about 8 μm was significantly smaller than the sample size. Thus, heating with a finely focused diode laser (830 nm) makes it possible to apply energy directly to the sample, avoiding heating the membrane near the sample. Positioning of the laser spot on the sample is possible with a high-resolution IR camera, see below. The power of the diode laser can be precisely adjusted from zero to about 100 mW. Thus, the power compensation scheme makes it possible to control the sample temperature during laser heating in the same way as during membrane heating [19]. In the case of laser heating, we have gained the advantage of local heating with simultaneous local temperature measurement. The disadvantage of laser heating was that, in this case, it was not possible to determine the power absorbed by the sample accurately.
In the case of laser heating of the sample, the radius of the hot zone is now equal to  Thus, the heat loss is proportional to
  see appendix. An IR image of the central zone of the membrane with the sample during laser heating is shown in figure 2(a). It should be noted that the emissivity of a metal surface is much lower than that of the polysilicon tracks. The emissivity of materials with low electrical resistivity is less than that of materials with higher electrical resistivity [27, 28]. Therefore, the radiation intensity of doped polysilicon tracks is much higher than that of metal surfaces. In addition, the emissivity of the transparent membrane is much lower than that of the other surfaces, figure 2.
Denote by  and
and  the temperature of the membrane and the sample at the membrane/sample interface. The interfacial temperature difference
  depends on the ITC between the sample and the membrane. For further discussion, we are interested in the temperature difference
  at the membrane/sample interface.
2.3. IR thermography
To measure the interfacial temperature difference  it is necessary to measure the temperature on both sides of the interface, which is a complicated task for a microdroplet during fast melting and crystallization. This problem can be solved using non-contact IR thermography combined with nanocalorimetry [20, 22]. The temperature of the sample surface on the side opposite the membrane can be calculated from the intensity of thermal radiation
  emitted from the sample surface. This temperature is close to the temperature at the membrane/sample interface with an error of about the temperature difference
  across the sample; this temperature difference is negligible due to the high thermal conductivity and very small size of the sample. However, the temperature difference at the membrane/sample interface is significant and reaches about 80 K in laser heating experiments, see below.
In this work, we used a high-speed IR camera with an array of InSb photodetectors and a special Si-Ge microscopic lens [23–26]. The system operates in the wavelength range of about 3–5 μm and has a spatial resolution of 4 . Thermal images of the IR camera are taken at an exposure time of 0.2 ms and a sampling rate of 3800 Hz, i.e. time resolution of 0.26 ms. The measured time dependences of  and
and  (together with
  ) was synchronized with an accuracy of about 0.2 ms using a very sharp onset of crystallization, see the next section.
3. Results
3.1. IR thermography
The intensity  of thermal radiation, measured by the IR camera at sample temperature
  can be represented by the following equation:
  where the factor
  depends on the emissivity of the sample surface, and the background level
  depends on the thermal noise and dark current of photodetectors [18]. The parameters
  and
and  can be excluded if any two reference points are known, say, temperatures
  and
and  are known, at which
  and
and  are measured. The sample temperature
  can then be calculated from the measured
  according to equation (2).

The membrane temperature  was linearly scanned from 600 K to the maximum
  = 1050 K and back to 600 K, where
  is the middle of the heating-cooling scan. Thus, the membrane temperature is equal to the maximum value
  = 1050 K and rate
  is equal to zero at
  see figure 3. Denote by

 and
and  the moments of the onset of sample melting, the end of melting, the onset of crystallization, and the middle of crystallization, respectively, see figures 3–5. Unfortunately, the onset of melting of the alloy is indistinct and cannot be accurately determined. However, the end of the sample melting can be clearly indicated, see figures 3 and 4. The value of the radiation intensity at the end of melting (at
  ) is fully reproducible. For example, at
  = 1000 K s−1, this intensity
  = (14140 ± 20) r.u. corresponds to the liquidus temperature of the alloy, see figure 3. The liquidus temperature of AA7075 is equal to
  = 901 K [29, 30]. Thus, the point
  = 14140 r.u. can be used for temperature calibration of measurements of the intensity of thermal radiation. In addition, the point
  = 15580 r.u at zero rate
  corresponds to the sample temperature
  which is close to
  = 1050 K. More precisely,
  = 1042 K can be obtained from
  as described in the Appendix. Thus, the sample temperature
  can be obtained from the measured
  according to equation (2), where
  and
and 

Figure 3. Time dependence of intensity  and temperature
  (a) as well as
  and power
  in the melting range (b) at
  = 1000 K s−1.
Download figure:
Standard image High-resolution image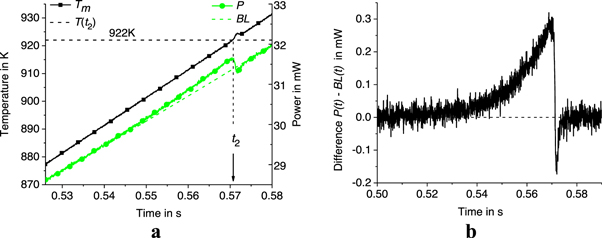
Figure 4. Time dependence of membrane temperature  power
power  baseline
  (a) and difference
  (b) in the melting range at
  = 1000 K s−1.
Download figure:
Standard image High-resolution imageSimilar time dependencies of the intensity  temperature
  and power
  were measured at different scan rates. For example, at
  = 5000 K s−1, see figure 6.
Thus, we obtain the sample temperature  at specific points in the scanning process, which can be used to calculate the thermal contact conductance at the membrane/sample interface. For example, the results at
  = 1000 K s−1 and 5000 K s−1 are collected in tables 1 and 2. Note that the membrane temperature in the middle of the crystallization process (at time
  ) is approximately equal to
  see figure 5. Similar results were obtained at various
  in the range of 103–105 K s−1.
Table 1. Parameters of the scan process at specific points in time at  = 1000 K s−1.
| Time in s |
 in K in K |
 in r.u. in r.u. |
 in K in K |
|---|---|---|---|

| 922 | 14140 | 901 |

| 1050 | 15580 | 1042 |

| 859 | 13616 | 827.6 |

| 859 | 14030 | 887.1 |
Table 2. Parameters of the scan process at specific points in time at  = 5000 K s−1.
| Time in s |
 in K in K |
 in r.u. in r.u. |
 in K in K |
|---|---|---|---|

| 930 | 14170 | 901 |

| 1050 | 15550 | 1042 |

| 848.5 | 13540 | 805.5 |

| 848.5 | 13960 | 872.6 |
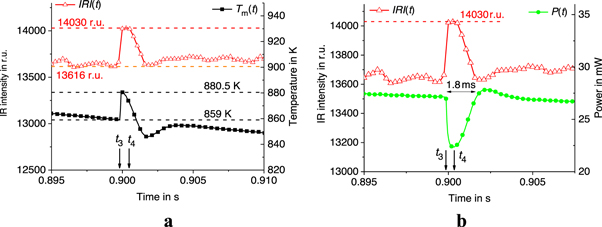
Figure 5. Time dependence of intensity  and temperature
  (a) as well as
  and power
  (b) in the crystallization range at
  = 1000 K s−1.
Download figure:
Standard image High-resolution image
Figure 6. Time dependence of intensity  and temperature
  (a) as well as
  and power
  in the melting range (b) at
  = 5000 K s−1.
Download figure:
Standard image High-resolution imageSimilar time dependencies of the intensity  and temperature
  were measured at laser heating at different
  for example, at
  = 1000 K s−1 and 5000 K s−1, see figures 7 and 8. The membrane temperature
  was linearly scanned from 500 K to the maximum
  = 1000 K and back to 500 K.

Figure 7. Time dependence of the intensity  and membrane temperature
  during heating-cooling scan (a) and crystallization (b) at laser heating (
 1000 K s−1).
Download figure:
Standard image High-resolution image
Figure 8. Time dependence of the intensity  and membrane temperature
  during heating-cooling scan (a) and crystallization (b) at laser heating (
 = 5000 K s−1).
Download figure:
Standard image High-resolution imageThus, at laser heating, we obtain the sample temperature  at specific points in the scanning process, which can be used to calculate the thermal contact conductance at the membrane/sample interface. For example, the results at
  = 1000 K s−1 and 5000 K s−1 are collected in tables 3 and 4. In the case of laser heating, we assume that
  is approximately equal to
  Similar results were obtained at various
  in the range of 103–105 K s−1.
Table 3. Parameters of the scan process at specific points in time at  = 1000 K s−1 and laser heating.
| Time in s |
 in K in K |
 in r.u. in r.u. |
 in K in K |
|---|---|---|---|

| 848 | 13330 | 901 |

| 1000 | 15300 | 1000 |

| 803.4 | 12840 | 870.1 |

| 813.5 | 13180 | 891.9 |
Table 4. Parameters of the scan process at specific points in time at  = 5000 K s−1 and laser heating.
| Time in s |
 in K in K |
 in r.u. in r.u. |
 in K in K |
|---|---|---|---|

| 862 | 13410 | 901 |

| 1000 | 15300 | 1000 |

| 805.5 | 12920 | 868.7 |

| 816 | 13230 | 889.6 |
Thus, the temperature  of the sample and the temperature
  of the membrane can be measured simultaneously. It is then possible to measure the change in the interfacial temperature difference
  during fast melting and crystallization of metal microdroplets.
3.2. Calorimetry
The mass of the sample can be determined from the measured enthalpy  of melting and crystallization of the sample. The measurements were carried out at scan rate
  in the range of 103 K s−1
 105 K s−1. The time dependences of the membrane temperature
  and power
  during melting and crystallization of the sample at
  = 103 K s−1 are shown in figures 4 and 9, as well as in figures 10 and 11 at
  = 5·103 K s−1. The power absorbed (released) by the sample during melting (crystallization) is equal to
  where
where  is the baseline, see figures 4, 9, 10, and 11. Thus, the enthalpy
  of melting (crystallization) of the sample is the area under the curve
  It should be noted that after the completion of sample melting, the membrane temperature
  becomes overheated for a short time, see figures 4(a) and 10(a). This overheating is compensated by the power control undershoot. the extra heat absorbed by the membrane after the completion of sample melting is compensated by a further undershoot in power
  Thus, the total area under the curve
  in time intervals with a positive and negative difference
  is equal to the heat absorbed by the sample during melting. The same applies to the crystallization of the sample, see figures 9 and 11.
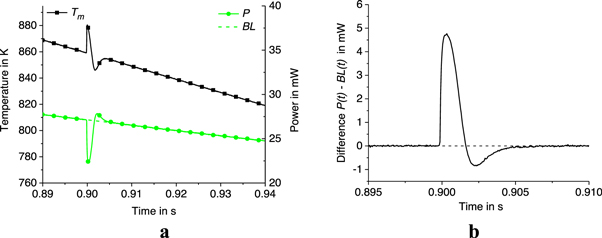
Figure 9. Time dependence of membrane temperature  power
power  baseline
  (a) and difference
  (b) in the crystallization range at
  = 1000 K s−1.
Download figure:
Standard image High-resolution image
Figure 10. Time dependence of membrane temperature  power
power  baseline
  (a) and difference
  (b) in the melting range at
  = 5000 K s−1.
Download figure:
Standard image High-resolution image
Figure 11. Time dependence of membrane temperature  power
power  baseline
  (a) and difference
  (b) in the crystallization range at
  = 5000 K s−1.
Download figure:
Standard image High-resolution imageThe average value of  measured during melting and crystallization at different scan rates is equal to
  = 4.0 ± 0.4 μJ. The uncertainty of baseline is responsible for the 10% error in the measured
  value. The sample mass
  = 11.2 ± 1 ng is obtained from
  and the specific heat of fusion
  358 J g−1 [29, 30]. The thermophysical parameters of the material AA7075 are available in [29, 30] and are summarized in table 5.
Table 5. Thermophysical properties of the material AA7075.
| Temperature | Density  g cm−3 g cm−3
| Specific heat capacity  J gK−1 J gK−1
| Thermal conductivity  W m−1·K−1 W m−1·K−1
|
|---|---|---|---|
 = 901 K = 901 K | 2.5 | 1.13 | 85 |
 = 805 K = 805 K | 2.81 | 0.9 | 190 |
Thus, the heat capacity of the sample is equal to  = 12.6 ± 1 nJ K−1 at
  = 11.2 ng in the liquid state at
  The sample radius is equal to
  = 10.2 ± 1 μm at
  and
and  = 2.5 g cm−3, since the shape of the sample is close to spherical. The areas of the hemisphere and the cross section of the sample are
  and
and  respectively. Sample parameters are collected in table 6.
Table 6. Parameters of the measured sample at 
Melting enthalpy  μJ
μJ | Mass  ng ng | Heat capacity  nJ K−1 nJ K−1
| Radius  μm
μm | Hemisphere area  m2 m2
| Cross-sectional area  m2 m2
|
|---|---|---|---|---|---|
| 4.0 | 11.2 | 12.6 | 10.2 | 6.6·10–10 | 3.3·10–10 |
4. Discussion
4.1. Interfacial thermal conductance at membrane heating
The interfacial temperature difference  is proportional to the heat flow
  across the membrane/sample interface and is inversely proportional to the thermal contact area
  and the ITC, measured in W m−2K−1. Consider the product of this thermal conductance and the contact area
  Let
Let  denote this product, measured in W/K. The thermal contact area
  cannot be accurately measured in this experiment. Therefore, we consider the interfacial thermal conductance
  measured in W/K, which can be determined from equation (3).

To determine the sample temperature  at the membrane/sample interface, we neglect the temperature difference
  across the sample and use the sample temperature determined from the intensity
  of thermal radiation emitted from the sample surface opposite the membrane.
  where
where  is the maximum heat flow through the sample. This heat flow is maximum at crystallization:
  where the crystallization time
  is about 1.8 ms, see figure 5. Thus,
  = 2.2 mW at
  = 1.8 ms and
  = 4.0 μJ, see table 6. Therefore,
  1 K at
  = 85 W m·K−1 for liquid sample, see table 5.
Let  denote the interfacial thermal conductance at the interface between the sample and the membrane for a molten (liquid) sample. Let us consider
  during melting and crystallization of the measured microdroplet.
Interfacial thermal conductance  at the end of the melting process (at
  ) can be calculated from the energy balance equation (4), where
  is the power absorbed by the sample at
  The power
  supplied from the membrane to the sample is spent on melting the sample, heat loss from the sample to the surrounding gas
  and heating the sample
  at a rate
  The thermostat temperature in all experiments was equal to
  = 300 K. Therefore,

Thus, at  = 1000 K s−1,
  = 0.3 mW (see figure 4),
  = 922 K,
  = 901 K (see table 1),
  = 0.37 mW at
  = 928 W m−2K−1 (see appendix), and
  is negligible at
  = 12.6 nJ K−1 (see table 6). Thus,
  = 21 K and
  3.2·10–5 W K−1.
Correspondingly, at  = 5000 K s−1,
  = 1.1 mW (see figure 10),
  = 930 K,
  = 901 K (see table 2),
  = 0.37 mW, and
  is negligible. Thus,
  = 29 K and
  = 5.1·10–5 W K−1. Similar results are obtained at different rates
  see table 7. The uncertainty of this result is about 50% due to the following main sources of error. The uncertainty of the interfacial temperature difference
  is about 30%. This uncertainty is related to the
  measurement error (about 7 K) obtained from the IRI measurements, see appendix. The uncertainty of the heat losses is about 30%, see Appendix. The error in measuring
  during melting is about 30% due to the baseline error.
Table 7. Interfacial thermal conductance  in several measurements at
  in the range 103–105 K s−1.
Rate  K s−1 K s−1
|
 membrane heating μW K−1 membrane heating μW K−1
|
 membrane heating μW K−1 membrane heating μW K−1
|
 laser heating μW K−1 laser heating μW K−1
| Average  μW K−1
|
|---|---|---|---|---|
| 103 | 32 | 52 | 65 | 50 |
| 2·103 | 39 | 74 | 58 | 57 |
| 5·103 | 51 | 58 | 69 | 59 |
| 104 | 62 | 52 | 71 | 62 |
| 2·104 | 73 | 59 | 61 | 65 |
| 105 | — | 76 | 80 | 78 |
In addition, the interfacial thermal conductance  can be calculated from the energy balance equation averaged over the crystallization time interval
  = 1.8 ms, see equation (5). The energy
  = 4.0 μJ released by the sample during crystallization is spent on heat loss from the sample to the surrounding gas
  heat transferred from the sample to the membrane
  and heating the sample from
  to
to  Therefore,

Thus, at  = 1000 K s−1,
  = 0.64 μJ,
  = 0.75 μJ,
  = 887.1 K,
  = 827.6 K, and
  = 859 K (see table 1). Thus,
  = 28.1 K and
  = 5.2·10–5 W K−1.
Correspondingly, at  = 5000 K s−1,
  = 0.63 μJ,
  = 0.85 μJ,
  = 872.6 K,
  = 805.5 K, and
  = 848.5 K (see table 2). Thus,
  = 24.1 K and
  = 5.8·10–5 W K−1. Similar results are obtained at different rates, see table 7. The uncertainty of this result is about 50% due to the following main sources of error. The uncertainty of the interfacial temperature difference
  is about 30%. The uncertainty of the numerator of the fraction on the right side of equation (5) is about 20%. The error of the time interval
  is about 30% due to the time resolution of the IR camera of about 0.26 ms.
4.2. Interfacial thermal conductance at laser heating
In the case of the laser heating of the sample, the radius of the hot zone is equal to  Thus, the heat loss is proportional to
  and the parameter of the heat loss from the sample surface is equal to
  = 6149 W m−2K−1, see appendix. With laser heating, the crystallization time
  is about 0.5 ms, see figures 7 and 8. Therefore, the maximum heat flow
  through the sample is equal to
  = 8 mW. The temperature difference
  across the sample is
  Thus,
Thus,  3 K at
  = 85 W m−1·K−1 for the liquid sample, see table 5.
With laser heating, it was impossible to determine the power absorbed by the sample accurately. Thus, it was not possible to measure the interfacial thermal conductance  during melting. However,
  can be obtained from the energy balance equation (6) during crystallization, since the energy
  released during crystallization is known, see table 6. Therefore, similarly to equation (5), we have

Thus, at  = 1000 K s−1,
  = 1.19 μJ,
  = 0.27 μJ,
  = 891.9 K,
  = 870.1 K, and
  = 813.5 K (see table 3). Thus,
  = 78.4 K and
  = 6.5·10–5 W K−1.
Correspondingly, at  = 5000 K s−1,
  = 1.19 μJ,
  = 0.26 μJ,
  = 889.6 K,
  = 868.7 K, and
  = 816 K (see table 4). Thus,
  = 73.6 K and
  = 6.9·10–5 W K−1. The uncertainty at laser heating is about 60% due to the following main sources of error. The error of the time interval
  is about 50% due to the time resolution of the IR camera of about 0.26 ms. The uncertainty of the interfacial temperature difference
  is about 10%. The uncertainty of the heat losses is about 30%. The error in measuring
  during crystallization is about 10% due to the baseline error.
Averaging the results obtained from equations (4)–(6), we get  = 5.0·10–5 W K−1 and
  = 5.9·10–5 W K−1 for
  = 1000 K s−1 and 5000 K s−1, respectively, see table 7. Note that in the case of laser heating, it was not possible to determine the fraction of the laser power absorbed by the sample. Therefore, the ITC during melting (at
  ) was not determined in this case. However, the energy
  released by the sample during crystallization is known from calorimetric measurements. Thus, with laser heating, it was possible to calculate the ITC during crystallization from the energy
  released by the sample, see equation (6) and table 7.
Summing up the results (see table 7) obtained for the process of melting and crystallization under different heating modes and different rates, we get  = (6.0 ± 3)·10–5 W K−1. The measurement error of about 50% is due to the following components. The error of the interfacial temperature difference
  is about 10% and 30% at laser and membrane heating, respectively. This uncertainty is due to the
  measurement error obtained from the IRI measurements. The uncertainty of the time interval
  and
and  is about 50% and 30% for laser and membrane heating, respectively. This error is related to the time resolution of the IR camera. The uncertainty of heat loss is about 30%. The error in measuring the enthalpy
  during crystallization and the power
  during melting is about 10% and 30%, respectively. This error is due to baseline uncertainty.
The interfacial thermal conductance  (in W m−2K−1) is greater than
  = 1.8·105 W m−2K−1 since the contact area
  is at least smaller than the cross-sectional area
  = 3.3·10–10 m2, see table 6. the ITC can vary in a wide range of 103–108 W m−2K−1 depending on the adhesion between the sample and the substrate [20, 22, 31–33]. The ITC measured in this article is consistent with the literature data. However, this is greater than the ITC measured for other metal microdroplets. For example, the ITC of microdroplets of liquid tin and indium is about 104 W m−2K−1 and 5·104 W m−2K−1, respectively [20, 22]. This result indicates that aluminum alloy microdroplets (AA7075) in the molten state have excellent adhesion to the substrate, even better than pure tin and indium microdroplets.
4.3. Variation of the interfacial thermal conductance during sample melting
The variation of the interfacial thermal conductance  during the melting process can be calculated from the energy balance equation (7), similar to equation (4).

where  is the power absorbed by the sample during melting (for example, see figure 4 at
  = 1000 K s−1).
  is calculated from
  according to equation (2). Thus, we obtain the temperature difference
  and the interfacial thermal conductance
  during the melting process. As a result, the dependence of the interfacial thermal conductance
  on the temperature of the sample in the melting range is obtained, see figure 12. Note that figure 12 is a plot of the ITC versus the sample temperature calculated from measured IR intensity using equation (2).
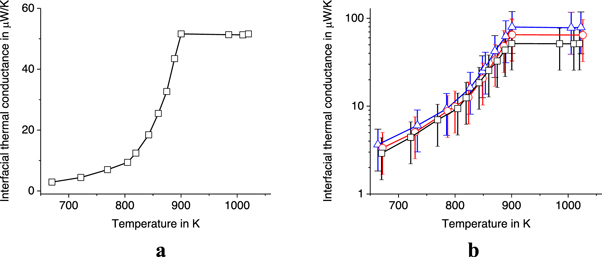
Figure 12. Temperature dependence of interfacial thermal conductance  of the aluminum alloy sample (AA7075) weighing 11.2 ng at
  = 5000 K s−1 (a) and
  in logarithmic scale (b) at
  = 5·103 K s−1, 104 K s−1, and 2·104 K s−1—square−1s−1, circles, and triangles, respectively.
Download figure:
Standard image High-resolution image
It should be noted that the interfacial thermal conductance  gradually increases by more than an order of magnitude with temperature in the melting range, see figure 12. The fastest growth occurs at temperatures above the solidus temperature
  = 805 K. The ITC remains stable at temperatures above the liquidus temperature
  = 901 K, when the alloy is completely liquid. Interestingly, such a gradual change in
  is not characteristic of pure metals. The melting of a pure metal usually begins on its surface, when a thin layer of liquid is formed on the surface just below the melting point [34]. Usually, a sharp jump in
  occurs just before the melting point of the pure metal, when the surface of the sample becomes liquid, as was observed in experiments with pure tin, aluminum, copper, and stainless steel [20, 21]. However, a gradual increase in ITC with temperature was observed for pure metallic indium in a certain range of premelting temperatures [22]. The gradual change in
  found for indium and AA7075 microdroplets, indicates a gradual change in the strength of the interaction between the sample and the substrate during premelting and melting the sample. This interaction strength depends on the short-range structure of the melting sample, which can change with temperature and lead to temperature changes in the thermal contact conductance [35].
5. Conclusions
Ultrafast nanocalorimetry combined with high-speed IR thermography makes it possible to measure ITC during fast phase transformations in metal microdroplets with sub-millisecond time resolution. This method can be used to measure nanogram microdroplets in fast thermal processes at a temperature scan rate in the range of 103 K s−1
 105 K s−1. The temperature difference at the interface between the sample and the solid substrate can be measured and used to determine the ITC. This temperature difference can reach 80 K during the solidification of microdroplets in an experiment with laser heating. This finding is very important for the modeling and optimization of laser-assisted technological processes.
The interfacial thermal conductance  being an important parameter for various industrial processes, can vary over a wide range depending on the temperature and state of the sample. The interfacial thermal conductance
  measured for AA7075 microdroplets gradually increases by an order of magnitude with increasing temperature in the range from the solidus temperature
  = 805 K to the liquidus temperature
  = 901 K of the alloy. The fastest growth of
  occurs in the melting range near the liquidus temperature. After that,
  remains stable at temperatures above the liquidus temperature
  = 901 K, when the alloy is completely liquid. The gradual change in
  found for AA7075 microdroplets indicates a gradual increase in the adhesion of the sample to the substrate during melting. This adhesion depends on the short-range structure of the melting alloy; this short-range structure can change with temperature and lead to temperature changes in the thermal contact conductance [35]. The observed gradual change in
  can be of interest for various technological processes. This result can be used in the design of materials produced in laser additive manufacturing.
The unusual melting behavior of ITC found for AA7075 microdroplets is important for understanding laser-assisted technological processes. We assume that a gradual change in ITC during melting may be characteristic of alloys with a wide melting range from solidus to liquidus temperature. Thus, it is interesting to carry out similar measurements for different alloys with a wide melting range. An interesting side observation of this work—the aluminium alloy particle remains spherical even after being heated up to 100 K above its melting point. That means the interface between particles may hold to quite high temperatures and shall be considered when modeling the additive manufacturing process. E.g., in combinations of DEM (discrete elements method) and CFD (computational fluid dynamics), typically used for that [36]. A further dependence of ITC on the surface modification of both the powder particle and the substrate shall be investigated.
Acknowledgments
JM acknowledges financial support from the Japan Society for the Promotion of Science (JSPS), Japan KAKENHI Grant Number 22H02137, and JST CREST Grant Number JPMJCR19I3; EZ acknowledges the support by the Precise Measurement Technology Promotion Foundation for the partial financial support for traveling, DFG SPP2122 program, project ZH 661/3–2, and Functional Materials Rostock e.V.; MR acknowledges partial support by JSPS KAKENHI Grant No. 22K14200, Japan; CS acknowledges financial support from the Tokyo Tech World Research Hub Initiative (WRHI).
Data availability statement
All data that support the findings of this study are included within the article (and any supplementary files).
Statements
All authors declare that they have no conflicts of interest.
This material is the authors' own original work, which has not been previously published elsewhere.
The data that support the findings of this study are available from the corresponding author, EZ, upon request.
Appendix
The heat flow from the membrane surface to the gas is equal to the product of the heat loss parameter  surface area
  and the temperature difference
  where
where  is proportional to the thermal conductivity of the gas
  In the calorimetric sensor, the distance from the membrane to the thermostat is large compared to the radius of the membrane heater
  75 μm. Because of the nearly spherical temperature distribution in the gas around a small central hot zone of the membrane, this zone can be considered as a point source of the heat flow into the gas. In this case, heat flux transferred from the unit area of the central zone of the membrane is equal to
  This result was confirmed experimentally with calorimetric sensors of various sizes
  with an error of less than 30% [18, 20, 22, 37–39]. Thus, the heat loss parameter
  due to the thermal conductivity of the surrounding gas, is equal to
  = 813 W m−2K−1 at
  = 75 μm and
  = 0.061 W mK−1 of nitrogen gas at 900 K [40].
The convective component  of the heat transfer through the gas is significantly less than
  at micrometer sizes. the ratio
  decreases with the radius
  as
as  where the Nusselt number
  is equal to
  and the function
  with the Prandtl number
  in the case of gases is approximately equal to 1 [41]. The Grashof number is
  where
where  is the gravitational acceleration,
  is the kinematic viscosity, and
  is the density of the gas [41]. Thus, we obtain
  2.5·10–4 for nitrogen gas at
  900 K and
  1·10–4 m2 s−1 [40]. Therefore,
  0.126 and the convective contribution to heat loss from the upper surface of the membrane is about 12.6% of the heat loss parameter
  813 W m−2K−1 due to the thermal conductivity of nitrogen gas at 900 K.
The contribution of thermal radiation to the heat loss parameter is  where the Stefan-Boltzmann constant
  = 5.67·10−8 W (m−2K−4) [40], and the emissivity of the silicon-nitride membrane
  is about 0.2 [42, 43]. Therefore,
  is about 1.5% of
  at
at  = 900 K and
  = 300 K .
Thus, the parameter  of the heat loss from the upper and lower surfaces of the membrane is equal to (1 + 0.126 + 0.015)·
 = 928 W m−2K−1 and 1.015
  = 826 W m−2K−1, respectively.
Let us estimate the sample temperature  at
at  when the membrane temperature is equal to
  1050 K and the heating rate
  is zero. In this case, the heat flow from the membrane to the sample
  is equal to the heat loss from the sample to the gas
  Therefore,
  where
where  = 928 W m−2K−1,
  = 6.6·10–10 m2, and
  = 6·10–5 W K−1. Thus, we obtain
  = 1042 K at
  1050 K.
In case of the laser heating of the sample, the radius of the hot zone is equal to  Thus, the heat loss parameter
  due to the thermal conductivity of the surrounding gas, is equal to
  The convective contribution to the heat loss from the sample surface is about 2.8% of
  at
at  = 10 μm and
  = 0.061 W mK−1 of nitrogen gas at 900 K [40]. The contribution of thermal radiation to the heat loss
  is equal to 0.2% of
  at 900 K. Therefore, in case of the laser heating, the parameter
  of the heat loss from the sample surface is equal to 1.03
 = 6149 W m−2K−1.