
Abstract
The quality, structural defects, and transport properties of GO can be tailored by maintaining ultrasonic bath temperature. Herein, the effect of temperature-controlled exfoliation on the structural defects and transport properties of the resulting graphene oxide (GO) sheets are examined. The large crystallite size (12.23 nm) and low defect density (2.16 × 1011 cm−2) are found at 20 °C exfoliations. Highly oriented GO sheets were exfoliated at 20 °C which was confirmed through Bernal-stacking proportions (∼30%). Furthermore, electrical transport properties are high at 10 °C exfoliation temperature while optimum at other temperatures, calculated through impedance spectroscopy. Comparatively, smooth, wrinkle-free, and lesser bulges are found at 20 °C and 30 °C exfoliation temperatures.
Export citation and abstract BibTeX RIS

Original content from this work may be used under the terms of the Creative Commons Attribution 4.0 licence. Any further distribution of this work must maintain attribution to the author(s) and the title of the work, journal citation and DOI.
Introduction
Defects in GO can have a significant impact on its electronic, optical, thermal, and mechanical properties. Defects are also useful in other applications such as polymer nanocomposites, photovoltaics, memory devices, etc [1–3]. These characteristics, on the other hand, are only beneficial if the type and degree of defects can be regulated, which necessitates a thorough understanding of the cause, which is currently missing, particularly in the presence of oxygen. Also, the transport properties of GO are important for assessing performance and suggesting ways to improve it [4, 5].
With diameters ranging from a few nm to mm, GO is a hydrophilic two-dimensional form of graphene with oxygen-containing functional groups gracing (and distorting) the sp2 basal plane [6]. It is also well established that the degree and type of oxidation, as well as the concentration and placement of functional groups on the (upper and lower) surfaces, have a significant impact on GO performance [7]. The link between defect generation and concentration and oxygen group concentration and distribution is also of interest. Although, it is complicated by the fact that there are an almost limitless number of potential configurations and one is expected to cause the other [8]. Furthermore, GO with distinctive exposed high-energy facets typically gives higher performance than low-energy facets, because these high-energy facets have a superior density of atomic steps, which assist as energetic sites for breaking chemical bonds [9], therefore, the controlled synthesis of GO is a sensational approach to considerably increase their device performance.
The properties such as mechanical [10], thermal [11], optical [12], etc, versus the number of layers of GO are all determined by different research groups [13]. It is well established that as the number of layers rises, the above characteristics decline. As a result, it's critical to optimize the amount of graphene oxide layers for various applications. GO sheets have been successfully prepared by controlled oxidation of graphite to produce GpO, which is exfoliated using mechanical or thermal exfoliation methods [14–16]. Several studies involving GO production have been reported in recent years, and the influence of ultrasonication on the mechanical, electrical, or absorbent properties of the GO has been investigated [17–21]. However, less attention has been paid to the defect-related transport properties, which are critical for GO sheets [14, 19].
In practice, the mechanical method of obtaining fully exfoliated GpO to prepare GO sheets is the most common [22]. This procedure involves sonication and/or stirring GpO in water, and it's commonly used for mechanical exfoliation. The ultrasonication treatment's key parameters are time and sonication power. Thus, many articles are devoted to optimizing the time and device power to exfoliated GpO for preparing GO sheets to enhance GO performance by reducing the defect and improving electrical/optical [23–25].
In this study, a simple and efficient temperature-controlled exfoliation method is used to control the defect density in graphene oxide sheets and investigated their transport properties. The ultrasound heat treatment allows for precise control of defect densities, crystallite size, number of layers, and transport properties of functionalized exfoliated GO. The change in exfoliation temperature can be used to change the physicochemical and functional properties of GO sheets by controlling defect density during high-quality graphene oxide synthesis using a modified Hummer's method. A systematic study the effect on the effect of temperature-controlled exfoliation of GpO to GO is performed and examined their defect and transport properties. Also, a method developed by Bandara-Mellander (B-M) is used to evaluate the number, mobility, and diffusion coefficient of mobile ions from impedance spectroscopy, in this study [24, 25].
Experimental
Method
The precursor materials are listed in the supplementary information. The GpO was prepared by the modified Hummer's method [26]. Initially, H2SO4 and H3PO4 were taken in a ratio of 9: 1 and stirred for 10 min. Then 3 g of natural graphite powder was dispersed into the above mixture and stirred vigorously for 20 min. Later, 9 g KMnO4 was added into the above suspension followed by vigorous stirring for 30 min. The solution was kept overnight for complete oxidation under stirring at a constant temperature of 50 °C. Then, the solution was poured gently into 400 ml DI water (ice cubes), and to reduce the excess of KMnO4, a 3ml H2O2 (30%) was added under stirring and left for 20 min, cooled at room temperature. A 1:2 ratio of HCl and DI water solution was added to stop the reaction and centrifuged at 7000 rpm for 10 min. Further, for complete removal of acids from GpO suspension, centrifugal washing was repeated five times with a 2:1:1 ratio of DI water, ethanol, and acetone, respectively.
The de-ionized (DI) water was used to disperse the GpO and the dispersion concentration was 3.5 mg ml−1. Then, the prepared GpO suspension was ultrasonicated at various controlled temperatures to prepare different recipes of GO. A 30 ml of GpO suspension was ultrasonicated at 10, (GO-1), 20 (GO-2), 30 (GO-3), 40 (GO-4), 50 °C (GO-5), and without controlling the temperature (i.e., room temperature to 43 °C) (GO-6) for 20 min. The remaining unexfoliated GpO flakes were removed by centrifugation (at 10,000 rpm for 10 min). The prepared GO recipes are stored in separate vials for further studies.
Results and discussions
Figure 1 A shows the X-ray diffraction (XRD) patterns of as-prepared GO samples. The preparation of GO is confirmed by the diffraction patterns, which reveal one broad peak in the 8–10° range. The left shifting in the position of the GO peak (001) shows a crystallinity change due to the insertion of oxygen-containing groups connected at the edge and basal planes of GO [27]. Surprisingly, when the ultrasonication bath temperatures for the synthesis process are changed, the peak intensities and positions are also changed as shown in table S1(available online at stacks.iop.org/MRX/9/054001/mmedia). A signature of (002) peak is also found at ∼26° with low intensity referring to some remaining graphite sheets. The conversion of graphite sheets platelets to GO is found highest for GO-4 (I001/I002 = 8.50) while lowest for GO-3 (I001/I002 = 1.55). A smaller interplanar distance than reduced GO probably causes a partial restacking of the sheets of GO in the material. Using a combination of Bragg's equations and Debye–Scherrer (i.e., equations (1)–(3)), the average number of graphene layers (N) per domain may be estimated using XRD peak broadening [27].


where, d, θ, λ, D, K, and β are the inter-layer spacing, half of the diffraction angle, the wavelength of the X-ray source, average crystallite width, shape constant, and full width at half maximum height (FWHM) of the diffraction peak, respectively. There are significant variations in the GO layers with a change in sonication bath temperatures (see table S1). In our case, the XRD peak's position and shape are randomly affected by exfoliation temperature. Apart from GO-2, the peak position is randomly shifted to a lower 2θ value which shows a decrease in lattice parameters on the increment of exfoliation temperature. But the fact is that the XRD peak of GO shifted to a higher 2θ value on increasing the exfoliation temperature. Apart from the random shift, 20 °C is the optimum temperature for pure GO synthesis (GO-2) [28].
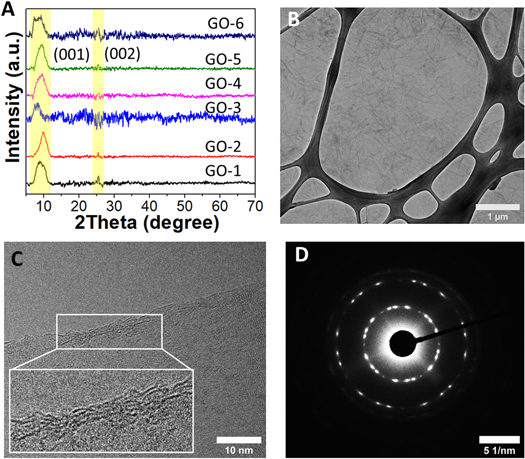
Figure 1. XRD pattern (A) and TEM images: (B) low-resolution, (C) high-resolution, and (D) SAED image of GO-2.
Download figure:
Standard image High-resolution imageA low magnification TEM image of the as-prepared GO-2 flake that covered the typical TEM Cu grid is shown in figure 1(B). The GO sheets have a micrometer-long, nearly transparent sheet-like structure that overlaps at the edges. In figure 1(C), a high-resolution TEM image of the GO-2 depicts exactly four layers and is well-matched with calculated layers through XRD. Selective area electron diffraction (SAED) is to quantify the defects. The diffused rings in figure 1(D) evolve into bright spots, which indicates crystalline behaviour and the 6-fold pattern is consistent with a hexagonal lattice [29]. On the other hand, GO-6 has a smaller flake size and polycrystalline SAED pattern as compared to GO-2, as shown in figures S1 (A and B). This implies that when the GO-6 is prepared, there are no preferential stacking configurations between the GO monolayers, which may affect the defects and electrical transport properties inside them [30].
The FTIR spectra of GO samples produced at a temperature-controlled exfoliation ultrasonication bath are shown in figure 2(A). The presence of the –OH group was suggested by the broad peak at 3210 cm−1. The peaks at 2855 and 2926 cm−1 are assigned to sp3 C–H stretching that may the GpO residue with sp3 C–H bending (1438 cm−1). The aromatic sp2 C–H bending (890, 755, and 614 cm−1) and aromatic C=C (2095 cm−1) are also present at respective positions with little deviations which confirms the presence of GO [31]. The C=C alkene stretching (1630 cm−1) and alkoxy C–O (1070 cm−1) are also present. The varied ultrasonication bath temperatures are used to encourage the loss of oxygen-containing functional groups, resulting in a reduction of GO. These findings, when combined with the XRD pattern, confirm the successful synthesis of GO sheets.
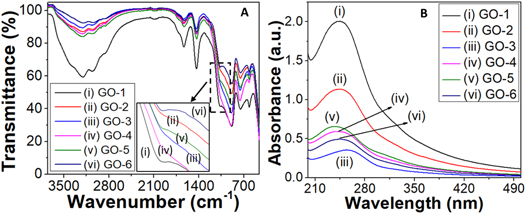
Figure 2. FTIR spectra (A) and UV–vis spectra (B) of GO recipes.
Download figure:
Standard image High-resolution imageUV–vis spectra of aqueous GO dispersions are presented in figure 2(B). To identify GO, two types of distinctive characteristics were noticed in these spectra: the first is a shoulder at ∼310 nm, which corresponds to an n-π* plasmon peak [32]. The shoulders found in all of the GO samples are comparable. Another distinguishing feature arises around ∼245 nm, corresponding to a π-π* plasmon peak. This feature's intensity and location differ between samples. The variation in the intensity of UV–vis absorption is induced by a conjugative effect associated with chromophore aggregation (C=C, C=O, and C–O bonds) and sp2 clusters, which modulates the π-π* plasmon peak. Generally, the absorbance is linearly dependent on the GO layers while the pure phase of GO is found at high solvent temperature. On the other hand, GpO has high absorbance as compared to GO. In this work, GpO is not completely converted into GO in the case of GO-1 due to which it has high absorbance [10]. The intensity variation is very irregular which is high for GO-1 (0.80) while the low for GO-3 (0.17). The strong peak in their UV–vis spectra at 230 nm distinguishes dispersions containing few-layer (1–3 layers) GO from those containing multi-layer (4–10 layers) and thick-layer (>10 layers) GO.
Figure 3 shows AFM images of synthesized GO sheets at temperature-controlled ultrasonication. The surface is rough, with visible wrinkles, and bulges, which might have arisen from the deposition of incompletely exfoliated GpO flakes. In the case of GO-2 (figure 3(B)) and GO-3 (figure 3(C)), comparatively less roughness, wrinkles, and bulges are found. GO-2 generated at an ultrasonication bath temperature of 20 °C has a smooth and thick surface, which is consistent with the belief that only uniform and agglomerate-free GO sheets can be synthesized at a constant ultrasonication bath temperature (in the range of 20 to 30 °C). The same effect can also be seen in 3D AFM images (figure S2).
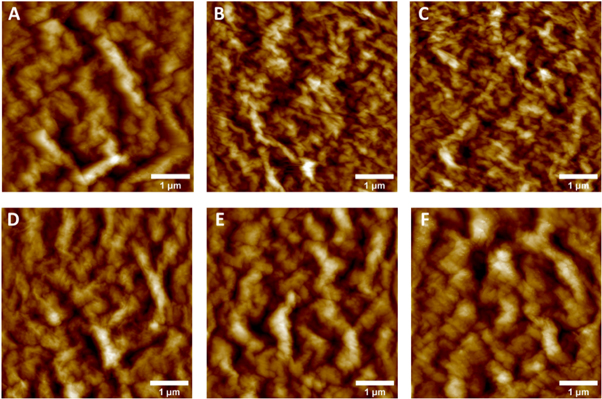
Figure 3. AFM images of (A) GO-1, (B) GO-2, (C) GO-3, (D) GO-4, (E) GO-5, and (F) GO-6.
Download figure:
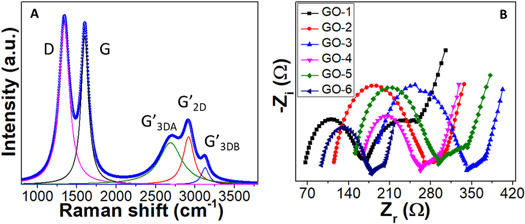
Standard image High-resolution imageThe prepared GO sample's first- and second-order Raman spectra are shown in figure 4(A). Two characteristics dominate the first-order spectrum range (1200–1800 cm−1): a significant peak at 1595 cm−1 (G band) and another peak at 1360 cm−1, which belongs to the defect-related D band [33, 34]. The Raman spectrum of GO-2 has a significant G peak (in comparison to the D band) (ID/IG = 0.96), indicating a limited number of structural defects in the carbon lattice among prepared GO samples. The intensity of the defect-related band rose dramatically from the first ultrasonic bath treatment at 10 °C to the last treatment at 50 °C, indicating that a large amount of disorder remained in the structure except GO-2. According to the evolution of the integrated intensity ratio of the D and G bands (ID/IG) for the different samples, which provides a quantitative measure of the number of defects present in graphitic materials, the healing of defects appeared to be much more extensive during the second ultrasonic treatment (GO-2). Using the well-known Tuinstra–Koenig equations (4) and (5), the ID/IG ratio may be utilized to calculate the approximate in-plane crystallite size (LD ) and defect density (nD ) [35]:


where, λL , ID , and IG are the laser source wavelength (532 nm), the intensity of the D band, and the intensity of the G band, respectively. Large crystallite size of 12.23 nm and a low defect density of 2.16 × 1011 cm−2 is found for GO-2 (table 1). On the other hand, LD (11.40) is less and nD (2.49) is high in the case of GO-3.
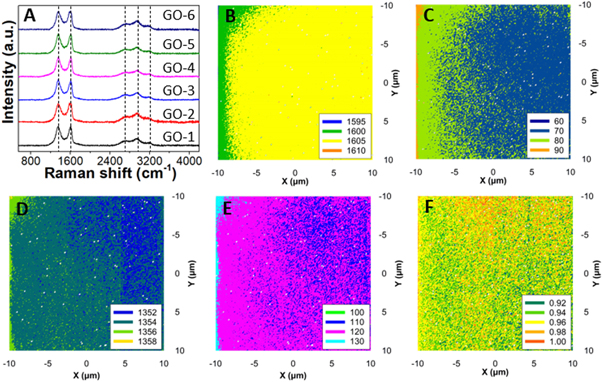
Figure 4. (A) Raman spectra and mapped 2D plots of GO-2: (B) G-peak, (C) G-width, (D) D-peak, (E) D-width, and (F) ID/IG ratio.
Download figure:
Standard image High-resolution imageTable 1. Defect density (nD) and crystallite size (LD) for as-prepared GO recipes (peak position and width are an average of 10 spectra taken at different positions).
| Sample | G-peak (cm−1) | G-width (cm−1) | D-peak (cm−1) | D-width (cm−1) | ID/IG | nD ×1011 (cm−2) | LD (nm) |
|---|---|---|---|---|---|---|---|
| GO-1 | 1596 | 120 | 1351 | 149 | 1.05 | 2.36 | 11.71 |
| GO-2 | 1588 | 121 | 1360 | 139 | 0.96 | 2.16 | 12.23 |
| GO-3 | 1595 | 118 | 1354 | 151 | 1.10 | 2.49 | 11.40 |
| GO-4 | 1598 | 94 | 1356 | 150 | 1.03 | 2.31 | 11.82 |
| GO-5 | 1596 | 116 | 1354 | 155 | 1.03 | 2.33 | 12.07 |
| GO-6 | 1589 | 109 | 1360 | 142 | 1.01 | 2.22 | 12.07 |
The Raman mapping is done to understand a clearer picture of the quality of GO-2. The G band varies from ∼1600–1605 cm−1 while its width is from 70–90 cm−1 (figures 4(B) and (C)). On the other hand, the D band position varies from 1352–1356 cm−1 and its width from 110–130 cm−1 (figures 4(D) and (E)). The quality of GO-2 is also monitored through ID/IG ratio mapping, as shown in figure 4(F). It can be seen that a 20 × 20 μm2 mapping area is fully covered with an ID/IG ratio <1 which indicates the uniformity of the GO-2 sheet with fewer defects and large crystallite size.
The second-order Raman spectrum (figures 4(A) and 5(A)) shows up to three separate bands (G', D + G, and 2D'), which are likewise typical of graphitic materials. The 2D (or G') peak, which is the overtone of the D band, is the most important. It is positioned at 2700 cm−1. Its intensity is affected by the structural disorder, but more importantly, its line shape gives information about the sample's three-dimensional stacking order. In comparison, a carbon-based material wherein the graphene sheets are arbitrarily rotated along the c axis (turbostratic stacking) has a perfectly symmetric 2D band and may thus be fitted with a sole Lorentzian component (G'2D), which is positioned in-between the G'3DA and G'3DB lines. Because the GO sheets are synthesized using a controlled ultrasonic bath temperature, the sheets are predicted to be randomly placed on top of each other, resulting in turbostratic stacking. The 2D bands are deconvoluted to find out the turbostraticity and AB-stacking of the GO sheets, a representative spectrum of GO-2 is shown in figure 5(A). The AB stacking exhibited by GO is given by the fraction, R, (equations (6)):

Figure 5. (A) Deconvoluted Raman spectra of GO-2 and (B) EIS spectra.
Download figure:
Standard image High-resolution image
where I denote the intensity of corresponding peaks. Using equation (6), the proportion of Bernal-stacked areas was found to be below 30% except for GO-2 (∼30%), showing that at 20 °C ultrasonic bath temperature, a considerable degree of three-dimensional ordering may be achieved which is also confirmed with SAED pattern of GO-2. In other words, GpO exfoliated at 20 °C is getting close to highly orientated GO sheets (table 2).
Table 2. Deconvoluted peaks of second-order Raman spectra of GO recipes.
| Sample | G'3DA (cm−1) | G'2D (cm−1) | G'3DB (cm−1) | IG'3DB/(IG'3DB + IG'2D) |
|---|---|---|---|---|
| GO-1 | 2695 | 2938 | 3184 | 0.268 |
| GO-2 | 2702 | 2937 | 3183 | 0.301 |
| GO-3 | 2701 | 2938 | 3190 | 0.261 |
| GO-4 | 2711 | 2947 | 3192 | 0.270 |
| GO-5 | 2694 | 2942 | 3192 | 0.265 |
| GO-6 | 2698 | 2939 | 3177 | 0.273 |
GO is hydrophilic, having epoxide and hydroxyl groups on the basal plane carbon atoms and carbonyl and carboxyl groups on the edge atoms. According to theoretical studies, oxygen-containing groups are grouped into rows and islands, resulting in graphitic areas intermixed with islands of oxygen-functionalized atoms, which impact the transport characteristics. The number density, mobility, and diffusion coefficient of free ions in the GO recipes are calculated using impedance spectroscopy and equations published elsewhere [36–38]. The Nyquist plots (figure 4(B)) are used to calculate the dielectric constant (εr ) and ionic conductivity (σ) of GO recipes from the equations (7) and (8):


where Zi and Zr are the imaginary and real components of impedance. Other supporting parameters such as d, εo , ω, RS , w, and A are the distance between the parallel plates, permittivity of vacuum (8.85 × 10⁻¹⁴ F cm−1), angular frequency, equivalent series resistance, the width of the parallel plate, and plates area, respectively. The highest dielectric constant is found for GO-1 (178.84) at 100 kHz as compared to other samples (table 3). The ionic conductivity of the GO recipes has been found in the range of 8.4–15.8 mS cm−1. The highest ionic conductivity is found for GO-1 (15.8 mS cm−1) which is due to more graphitic content remaining after ultrasonication. GO-6 also showed large conductivity as compared to others. Upon increasing the ultrasonication bath temperature, conductivity reduces and then increases. The transport parameters such as diffusion coefficient (D), mobility (μ), and number density (n) of the mobile ions are calculated by Bandara-Mellander (B-M) method through equations (9)–(11) [24, 25]:


where, τ2 , e, kb , and T are time constants corresponding to the maximum dissipative loss curve, electronic charge, Boltzmann constant (1.38 × 10⁻²³ J K−1), and absolute temperature in Kelvin, respectively. The calculated values of D,μ, and n is found highest for GO-1 among them which is in correlation with the remaining graphitic amount (confirmed through XRD), listed in table 3. Except for GO-1 and GO-6, transport properties are almost the same. GpO exfoliation from room temperature to T C° (GO-6) also shows a high dielectric constant and ionic conductivity due to the remaining graphitic amount (XRD: I001/I002 = 2.67).
Table 3. Transport properties are calculated through EIS using the B-M method.
| Sample | εr (at 100 kHz) | σ (mS cm−1) | D ×10−3 (cm2 s−1) | μ ×10−3 (cm2 V−1 s) | n ×1017 (cm−3) |
|---|---|---|---|---|---|
| GO-1 | 178.48 | 15.8 | 16.70 | 644.7 | 1.5 |
| GO-2 | 80.02 | 9.1 | 2.97 | 114.7 | 4.9 |
| GO-3 | 71.91 | 8.4 | 3.51 | 135.6 | 3.8 |
| GO-4 | 64.91 | 8.4 | 2.97 | 114.7 | 4.6 |
| GO-5 | 65.62 | 9.0 | 2.97 | 114.7 | 4.9 |
| GO-6 | 90.60 | 12.6 | 2.97 | 114.7 | 6.9 |
Conclusions
GpO aqueous suspensions were prepared by the modified Hummer's method and GO was prepared by the temperature-controlled exfoliation method. The structural defects and transport features of the resulting GO suspensions are detailed studied. It is found that 20 °C ultrasonic bath temperature produces large crystallites with lesser defects in the structure of GO. The proportion of Bernal-stacked areas is found high for GO-2 (∼30%) i.e., GpO exfoliated at 20 °C is getting close to highly orientated GO sheets. The transport parameters such as diffusion coefficient (D), mobility (μ), ionic conductivity, and number density (n) are found high for GO-1 which is due to more graphitic content remaining after ultrasonication. The quality, structural defects, and transport properties of GO can be tailored by maintaining ultrasonic bath temperature.
Acknowledgments
Author thanks Director CSIR-AMPRI, Bhopal for providing the characterization facilities. The author acknowledges SERB, New Delhi (File no; EEQ/2018/000068), and the CSIR-NET fellowship (File No: 31/041(0078)/2019-EMR-I) for their support. TEM analysis was performed at the analytical HRTEM laboratory, CSIR-AMPRI, Bhopal supported by CSIR under the facility creation project (MLP0110).
Data availability statement
The data generated and/or analyzed during the current study are not publicly available for legal/ethical reasons but are available from the corresponding author on reasonable request.
Conflicts
There are no conflicts.