

Abstract
In this study, the machining behaviour of aluminium alloy (AA6061)/10% aluminium oxide (Al2O3)/10% silicon carbide (SiC) hybrid metal matrix composites was analyzed by Electric Discharge Machining (EDM). The stir casting method was used to fabricate the composite in a volume percentage of 80, 10, and 10 for AA6061, Al2O3 and SiC, respectively. The specimen was prepared in the size of 30 mm in diameter and 12 mm in thickness from the fabricated composite by the Wire-cut Electric Discharge Machining (WEDM) process. The fabricated specimens were machined using EDM by varying the input parameters of pulse-ON time (T–ON) in μs, pulse-OFF time (T–OFF) in μs, and gap current (GC) in amps at three different levels. The design of the experiment by the Taguchi method was used with the L9 orthogonal array. The impact of process parameters on output variables such as Surface Roughness (SR), Machining Time (MT) and Material Removal Rate (MRR) was studied, and an Analysis of Variance (ANOVA) was carried out to identify the most influencing parameter. The GC is observed as the significant input parameter on SR and MT as the percentage contribution of 33% and 47%, respectively. T–ON is identified as more significant than other parameters on MRR as the percentage contribution is 47%. The results show that T–ON time of 12 μs, T–OFF time of 4 μs, and GC of 14 amps yield the least value of 3.304 μm for SR, 12 min for MT, and a higher value of 0.037 mm3 min−1 for MRR.
Export citation and abstract BibTeX RIS

Original content from this work may be used under the terms of the Creative Commons Attribution 4.0 licence. Any further distribution of this work must maintain attribution to the author(s) and the title of the work, journal citation and DOI.
1. Introduction
The hybrid metal matrix composite materials are extensively used in aviation, aerospace, and automobile industries and are considered new generation materials with more mechanical and physical properties than non-reinforced alloys. These materials possess characteristics such as high toughness, high strength to weight ratio, high toughness, and less coefficient of thermal stability. However, due to the geometric structure complexity, expensive machining cost, and high tool wear, it is arduous to machine materials with reinforcement by traditional machining methods. Therefore, non-conventional machining processes overcome these challenges in shaping hybrid metal matrix composites for a complicated die contour. Therefore, the literature survey was conducted in non-conventional machining of hybrid metal matrix composites, especially in aluminium alloys, due to the wide applications in the automobile and aerospace industries. One of the popular and commonly used non-conventional techniques is EDM in recent research works. In EDM, the machining takes place for electrically conductive materials using precisely controlled sparks between an electrode and the workpiece in the dielectric fluid medium [1–4].
Shailesh Dewangan et al [5] studied the integrity of the surface EDM. Their study analyzed the optimal process parameters settings using a grey-fuzzy logic-based optimization technique to improve surface integrity during EDM of AISI P20 tool steel material. The characteristics of surface integrity, such as white layer thickness, surface crack and SR are analyzed and identified that T–ON is the most contributing parameter and the current is the second most. Milan Kumar Das et al [6] analyzed different process parameters combinations for optimum MRR and SR for EDM of work material of EN31 tool steel by artificial bee colony algorithm. Also, they investigated the effects of machining parameters on machining performances that increase in T–ON and current, the MRR and SR also increased. Dastagiri and Hemantha Kumar [7] studied the influence of voltage, current, T–ON and duty factor by the EDM process against MRR, tool wear rate (TWR), and surface characteristics like surface finish (Ra) and the hardness. They formulated a mathematical model to evaluate the average SR, hardness, and MRR. The evaluated values are very close to experimental results. Thus, the mathematical model can be used to evaluate the responses on MRR and average SR for the parameter's studies. Vikas et al [8] presented an idea about performance on EN41 work material for the effect of the various input process parameters like T–ON, T–OFF, voltage, and discharge current against the SR Current has the most influence against SR value, followed by the voltage. The experimental and theoretical results obtained were found very close to one another. Durairaj et al [9] studied the output response of SR and kerf-width for optimization in wire EDM of work material SS304. The optimized parameters for SR are 2 mm min−1 of wire feed, 40 V gap voltage, 6 μs T–ON, 10 μs T–OFF and for kerf-width are 2 mm min−1 wire feed, 50 V gap voltage, 4 μs T–ON, 6 μs T–OFF. Azadi Moghaddam et al [10] analyzed the surface quality of 2312 hot worked steel by modifying the EDM parameters, and the ANOVA results revealed that T–ON and peak currents influence the surface quality significantly. Anil Kumar Bodukuri et al [11] studied the machining performance of AA7075 reinforced with SiC Metal Matrix Composite with a tool electrode of copper material in EDM process parameters. The most significant factor contributing 57.9% is T–ON to performance measures, second-most is Pulse OFF-Time contribution of 43.0%, Tool Lift contributing 4.7%, and peak current contributing 23.6%. Shalini Mohanty et al [12] studied Al-12%SiC metal matrix composite by central composite design (CCD) method to optimize process parameters such as T–ON, T–OFF, and peak current against output responses MRR, TWR, and SR during EDM. Their study observed that MRR increases as the current increases, and TWR also increases with the increase in peak current. Sweety Mahanta et al [13] investigated the cutting characteristics of EDM during machining of Al6351-B4C-SiC Metal Matrix Composites by employing a genetic algorithm as a multi-optimization tool. A percentage in an average error of 6.10% and is 6.84% for SR is shown in the developed full quadratic models with good correlations. The results of parametric optimization on responses were studied and show that current has contributed 68.92%, followed by pulse-ON of 9.27%, and voltage was identified as least significant in predicting SR.
Rajesh Choudhary et al [14] investigated the machining performance of Al6061/14% fly-ash composite about the influence of pulse current, T–ON, applied voltage, and duty factor in the EDM process. MRR of the specimen increases as the current, duty cycle, and T–ON increase. Tool electrode shift decreases with an increase in voltage from copper to brass. Also, with an increment of current and T–ON, TWR increases. As the duty cycle, T–ON increases, the SR increases. Moreover, SR initially decreases with the current but then increases. Due to the carbon layer deposition, the copper electrode TWR is not significant. However, it is important due to carbon layer unavailability present on the brass electrode. 0.1996 g min−1 of maximum MRR was observed in the tool electrode of brass at 150 μs T–ON, and a current of 16 A, owing to its higher current gap, dissipates heat energy at the workpiece. At a GC of 16 A and T–ON of 150 μs in the electrode of the brass tool, the maximum TWR was 0.0770 g min−1 because of the soft material of brass and the release of energy. Kamalkishor et al [15] studied the EDM parameters in multi-response optimization for the aluminium hybrid composites based on the grey relation approach in which the mixed equal wt% of silicon carbide and graphite had the most significant compared to other process parameters, and current of 4 amps, SiC- Gr of 15 wt%, and T–ON of 500 μs were identified as the optimal parametric conditions. Yan et al [16] analyzed the machining characteristics of Al2O3/6061 Al composites during rotary EDM. The higher MRR is reached with the dislike electrode, although the TWR is higher, and MRR is affected mainly by the polarity of EDM. Muniappan et al [17, 18] investigated the cutting speed parameters on WEDM by multi-objective optimization on SiC and graphite-reinforced Al6061 hybrid composite using Taguchi's method. The stir casting was selected as the fabrication method in this present work due to its good wettability characteristics, uniformity in the dispersion of reinforcement materials by stirring action, high processing temperature and low cost compared to other methods like powder metallurgy and spark plasma sintering [19–25].
The literature study identified that the investigation of machining behaviour for hybrid composites is not explored much through non-traditional machining techniques. Also, it is difficult to cut materials as the two reinforcements are present in hybrid composites. According to the literature, the maximum reinforcement proportion for aluminium matrix composites used is 10%, resulting in enhanced mechanical and tribological properties [26–31]. Therefore, the present study investigates the machining behaviour of AA6061 reinforced with 10% of Al2O3 and 10% of SiC in the EDM process.
2. Experimental setup
2.1. Work materials and methods
The base metal of AA6061 was identified due to its enhanced properties and wide applications. The chemical composition of AA6061 is presented in table 1. As a first reinforcement with a particle size of 200 mesh on average, the silicon carbide was selected due to its wide applications in high-temperature thermal structures and high-temperature engine components. The alumina as a second reinforcement in the average particle size of 240 mesh was identified due to its improved properties such as good electrical insulation, moderate thermal conductivity, high hardness, wear-resistance, and high corrosion. And its wide applications in superconductor restraints in fusion power reactors and storage battery plates. The aluminium alloy AA6061 was reinforced with 10% SiC and 10% of Al2O3 in volume was fabricated through the crucible casting process depicted in figure 1. The operating temperature of 750 °C was maintained to melt the substrate, and the reinforcements, which were preheated in a pre-heater added and agitated. The WEDM process machined the prepared casting to prepare specimens of 12 mm thickness and 30 mm diameter.
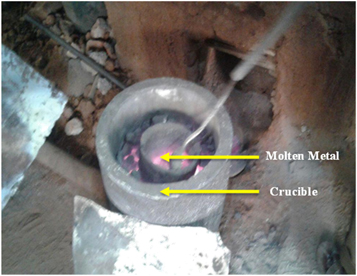
Figure 1. Crucible casting.
Download figure:
Standard image High-resolution image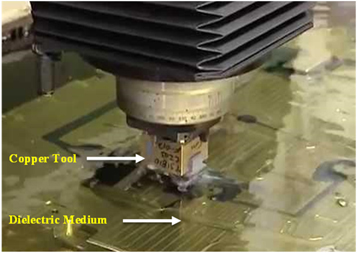
Figure 2. Electrolytic copper tool.
Download figure:
Standard image High-resolution imageTable 1. Chemical composition of AA6061.
| Elements | Content % |
|---|---|
| Al | 95.85–98.56 |
| Mg | 0.8–1.2 |
| Si | 0.4–0.8 |
| Fe | 0.7 |
| Cu | 0.15–0.4 |
| Cr | 0.04–0.35 |
| Zn | 0.25 |
| Ti | 0.25 |
| Mn | 0.15 |
| Others | 0.4 |
2.2. EDM setup
The EDM process was carried out using the machine of model ELECTRONICA—ELECTRAPULSE PS 50ZNC, with the die-sinking type of servo head at the positive polarity and constant gap. EDM oil of commercial grade with 0.763 specific gravity and 94 °C of the freezing point was used as a dielectric fluid. A U-shaped Cu tool (figure 2) with a pressure of 0.2 kgf cm−2 was used for internal flushing. The various steps in the positive polarity of the electrode or positive mode were used to apply discharge current on various parameters. The machining setup is depicted in figure 3. The levels of different fixed and control parameter values are given in table 2. Experiments were conducted using the L9 orthogonal array designed by the Taguchi method. MT, MRR, and SR values are depicted in table 3. The machined specimen for the nine different experimental runs is depicted in figure 4. The SR was measured using the SR tester of the model name talysurf machine shown in figure 5.
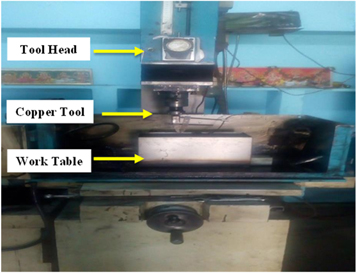
Figure 3. EDM setup.
Download figure:
Standard image High-resolution image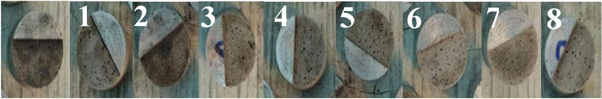
Figure 4. Machined specimens.
Download figure:
Standard image High-resolution image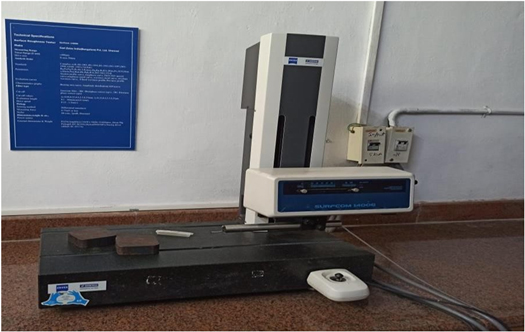
Figure 5. Surface roughness tester.
Download figure:
Standard image High-resolution imageTable 2. Input parameters and their levels.
| Levels | ||||
|---|---|---|---|---|
| Input parameters | Units | 1 | 2 | 3 |
| T–ON | μs | 8 | 10 | 12 |
| T-OFF | μs | 4 | 6 | 8 |
| GC | Amps | 10 | 12 | 14 |
Table 3. Design of experiments and S/N ratios values.
| SR (μm) | MT (min) | MRR (mm3/min) | |||||||
|---|---|---|---|---|---|---|---|---|---|
| Exp. No. | T–ON time (μs) | T–OFF time (μs) | GC (Amps) | Values | S/N ratio | Values | S/N ratio | Values | S/N ratio |
| 1 | 8 | 4 | 10 | 4.372 | −12.8136 | 26 | −28.2995 | 0.015 | −36.4782 |
| 2 | 8 | 6 | 12 | 4.849 | −13.7130 | 21 | −26.4444 | 0.023 | −32.7654 |
| 3 | 8 | 8 | 14 | 6.530 | −16.2983 | 14 | −22.9226 | 0.027 | −31.3727 |
| 4 | 10 | 4 | 12 | 7.549 | −17.5578 | 18 | −25.1055 | 0.029 | −30.7520 |
| 5 | 10 | 6 | 14 | 3.304 | −10.3808 | 22 | −26.8485 | 0.024 | −32.3958 |
| 6 | 10 | 8 | 10 | 3.743 | −11.4644 | 23 | −27.2346 | 0.022 | −33.1515 |
| 7 | 12 | 4 | 14 | 5.308 | −14.4986 | 12 | −21.5836 | 0.037 | −28.6360 |
| 8 | 12 | 6 | 10 | 4.561 | −13.1812 | 20 | −26.0206 | 0.026 | −31.7005 |
| 9 | 12 | 8 | 12 | 5.611 | −14.9808 | 16 | −24.0824 | 0.031 | −30.1728 |
3. Results and discussion
The latest version of the MINITAB 19 software tool was used to determine ANOVA and S/N ratio plots of MRR, MT, and Sr The single objective response optimization was processed to analyze the effects of parameters on output responses. The objective is to maximize the MRR and minimize the MT and Sr Equations (1) and (2) are generated by considering the MRR as the larger the better for calculating the S/N ratios and considering the lesser the better for SR and MT, respectively. The response table for the S/N ratio and means for MRR, MT, and SR are presented in tables 4 and 5. The equation (1) implies S/N ratio = −log10 (1/n) ∑n i = 1/Aij 2, and the equation (2) implies S/N ratio = −log10 (1/n) ∑n i = Aij 2), where Aij = observed response value, i = 1, 2,........n and j = 1, 2,..........k and n = number of replications. The mathematical model coefficient was formulated at the confidence level of 96% to evaluate the responses using regression analysis.
Table 4. Response table for Signal-to-Noise ratios.
| SR | Levels | T–ON | T–OFF | GC |
|---|---|---|---|---|
| 1 | −14.27 | −14.96 | −12.49 | |
| 2 | −13.13 | −12.43 | −15.42 | |
| 3 | −14.22 | −14.25 | −13.73 | |
| Delta | 1.14 | −2.53 | 2.93 | |
| Rank | 3 | 2 | 1 | |
| MT | 1 | −25.89 | −25.00 | −27.18 |
| 2 | −26.40 | −26.44 | −25.21 | |
| 3 | −23.90 | −24.75 | −23.78 | |
| Delta | 2.50 | 1.69 | 3.40 | |
| Rank | 2 | 3 | 1 | |
| MRR | 1 | −33.54 | −31.96 | −33.78 |
| 2 | −32.10 | −32.29 | −31.23 | |
| 3 | −30.17 | −31.57 | −30.80 | |
| Delta | 3.37 | 0.72 | 2.98 | |
| Rank | 1 | 3 | 2 |
Table 5. Response table for means.
| SR | Levels | T–ON | T–OFF | GC |
|---|---|---|---|---|
| 1 | 5.250 | 5.743 | 4.225 | |
| 2 | 4.865 | 4.238 | 6.003 | |
| 3 | 5.160 | 5.295 | 5.047 | |
| Delta | 0.385 | 1.505 | 1.778 | |
| Rank | 3 | 2 | 1 | |
| MT | 1 | 20.33 | 18.67 | 23.00 |
| 2 | 21.00 | 21.00 | 18.33 | |
| 3 | 16.00 | 17.67 | 16.00 | |
| Delta | 5.00 | 3.33 | 7.00 | |
| Rank | 2 | 3 | 1 | |
| MRR | 1 | 0.02167 | 0.02700 | 0.02100 |
| 2 | 0.02500 | 0.02433 | 0.02767 | |
| 3 | 0.03133 | 0.02667 | 0.02933 | |
| Delta | 0.00967 | 0.00267 | 0.00833 | |
| Rank | 1 | 3 | 2 |
Regression Equations obtained are as below:
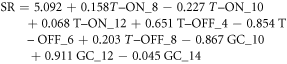

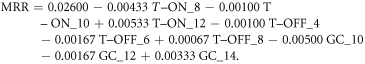
ANOVA evaluated the significant process parameter affects the response variables. In table 6, the percentage contribution of process parameters on SR, MT, and MRR is presented. It is seen that current is more significant than the other parameters on SR and MT as it possesses 33% and 47%. T–ON is more significant than other parameters on MRR as the percentage contribution is 47%. From the Response tables 4 and 5 of S/N ratio and means also, it is clear about the significant level according to the rank given for the process parameters that Rank 1 for GC against SR and MT and Rank 1 for T–ON against MRR. The rows 'Error' in the ANOVA table means that the values of errors are caused by factors that are not controllable. Generally, the results would not be reliable if the percentage error value is not less than 50%. It is clearly understood that the error was 40% for SR, 15% for MT, and 11% for MRR, and thus it is significantly under the limit.
Table 6. ANOVA for output responses.
| Responses | Sources | DOF | Sum of squares | Mean squares | F | P | % of contribution |
|---|---|---|---|---|---|---|---|
| SR | T–ON | 2 | 0.2432 | 0.1216 | 0.04 | 0.959 | 2 |
| T–OFF | 2 | 3.5826 | 1.7913 | 0.63 | 0.615 | 25 | |
| GC | 2 | 4.7491 | 2.3745 | 0.83 | 0.546 | 33 | |
| Error | 2 | 5.7220 | 2.8610 | 40 | |||
| Total | 8 | 14.2969 | 100 | ||||
| MT | T–ON | 2 | 44.22 | 22.111 | 1.78 | 0.360 | 27 |
| T–OFF | 2 | 17.56 | 8.778 | 0.71 | 0.586 | 11 | |
| GC | 2 | 76.22 | 38.111 | 3.06 | 0.246 | 47 | |
| Error | 2 | 24.89 | 12.444 | 15 | |||
| Total | 8 | 162.89 | 74 | 100 | |||
| MRR | T–ON | 2 | 0.000145 | 0.000072 | 4.52 | 0.181 | 47 |
| T–OFF | 2 | 0.000013 | 0.000006 | 0.40 | 0.716 | 4 | |
| GC | 2 | 0.000117 | 0.000058 | 3.65 | 0.215 | 38 | |
| Error | 2 | 0.000032 | 0.000016 | 11 | |||
| Total | 8 | 0.000306 | 100 |
3.1. Effect of input parameters on surface roughness
From the S/N ratio graph depicted in figure 6, it is understood that as the T–ON and T–OFF increases, SR first increases due to the discharge column expansion of spark energy and then decreases due to the cease in discharge as T–OFF increases. From figure 7, it is clear that in the main effect plot for means, as the T–ON and T–OFF increase, SR first decreases and then increases due to the strengthening of pulsation energy which enables the cooling rate gradually on the surface layer, leads to enhancement of surface finish. However, as GC increases, the SR first increases and then decreases due to the particles in erosion adhered between the tool and workpiece gap. Thus, it suggests that SR is proportional to GC [32].
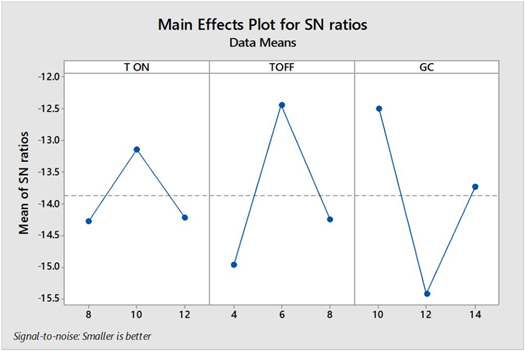
Figure 6. Main effects plot (Signal-to-Noise ratio) for Sr.
Download figure:
Standard image High-resolution image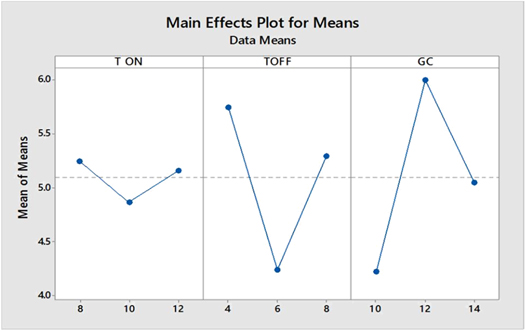
Figure 7. Main effect plot (Means) for Sr.
Download figure:
Standard image High-resolution image3.2. Effect of input parameters on machining time
From the S/N ratio graph in figure 8, it can be seen that as the T–ON and T–OFF increase, MT first decreases due to the unstable machining conditions. This is because the presence of SiC and Al2O3 reinforcement materials, which possess higher hardness, then increases. This can be attributed to the side cutting of the materials along the cylindrical tool face. From figure 9, it is clear that as the T–ON and T–OFF increases, MT first increases and then decreases in the main effect plot for means. However, as GC increases, the MT decreases as the stable machining conditions are attained after 0 to 5 min of the continuous machining process.
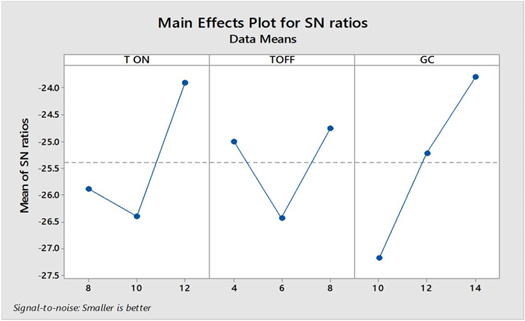
Figure 8. Main effects plot (Signal-to-Noise ratio) for MT.
Download figure:
Standard image High-resolution image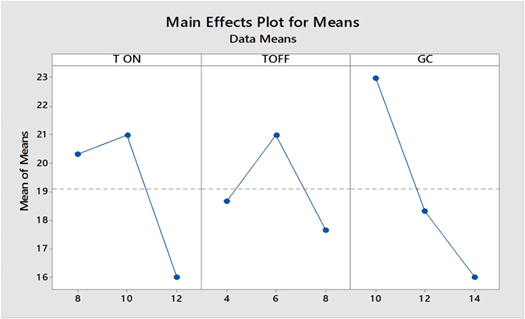
Figure 9. Main effects plot (Means) for MT.
Download figure:
Standard image High-resolution image3.3. Effect of input parameters on material removal rate
From figures 10 and 11, it is understood that MRR increases with the increment of T–ON due to the high spark discharge energy developed. While the evaporation rate and the gas bubbles increase, the high thrust explodes lead to high spark discharge energy development. As T–OFF increases, MRR first decreases because the arcing is high while the dielectric in the gap is not completely recovered its strength and then MRR increases owing to the truth that dielectric strength is regained as debris particles once flushed away from the gap. Nevertheless, as GC increases, the MRR again increases due to the spark discharge energy developed to enable the melting and vapourization action and the high force impulsion in the spark discharge gap. Higher GC leads to high thermal loads on both workpiece and tool, resulting in high MRR.
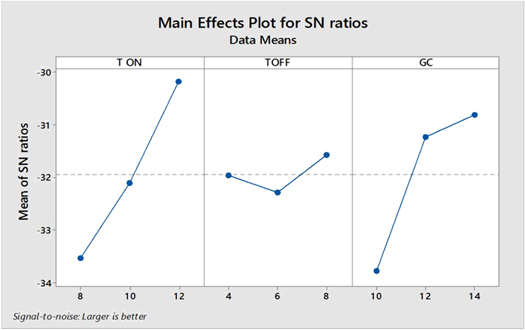
Figure 10. Main effects plot (Signal-to-Noise ratio) for MRR.
Download figure:
Standard image High-resolution image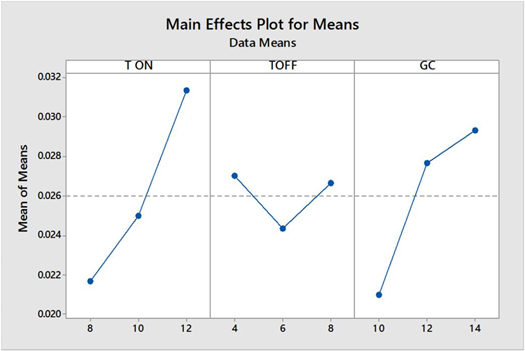
Figure 11. Main effects plot (Means) for MRR.
Download figure:
Standard image High-resolution image
4. Parametric optimization
The best input parameter was identified against the response and presented in table 7.
Table 7. Best parameters for different output responses.
| T–ON (μs) | T–OFF (μs) | GC (amps) | |
|---|---|---|---|
| SR | 10 | 6 | 14 |
| MT | 12 | 4 | 14 |
| MRR | 12 | 4 | 14 |
5. Conclusion
In this study, the experimental investigation and optimization of the AA6061/10% Al2O3/10% SiC hybrid metal matrix composite by EDM composite was carried out using the Taguchi method and the following conclusions are summarized.
- The significant input parameter values against SR are T–ON of 10 μs, T–OFF of 6 μs, and GC of 14 amps. The significant input parameter values against MT and MRR are T–ON of 12 μs, T–OFF of 4 μs, GC of 14 amps.
- GC is identified as the highest influencing factor than the other parameters on SR and MT as it possesses the percentage contribution of 33% and 47%. On the other hand, T–ON is more significant than other parameters on MRR as the percentage contribution is 47%.
- The optimum results were obtained with the higher T–ON time value and lesser T–OFF time value against the output response of SR, MT, and MRR.
Data availability statement
All data that support the findings of this study are included within the article (and any supplementary files).