
Abstract
Water pollution due to the discharge of industrial effluents such as dyes is a serious concern that requires a potential remedy. In this context, photocatalysis is a potent and ecofriendly strategy to degrade these toxic water effluents. In this study, a novel approach to prepare TiO2 nanoneedles decorated with Ag nanoparticles is reported. The sample was prepared using modified photodeposition and was annealed at 400 °C. The x-ray diffraction (XRD) revealed that TiO2 in anatase phase with the presence of Ag were prepared successfully. The corresponding crystalline size of TiO2 and Ag were 6.86 nm and 3.94 nm, respectively. The scanning electron microscopy (SEM) showed that the prepared TiO2 exhibited nanoneedles structure decorated with Ag nanoparticles. The prepared sample exhibited impressive photocatalytic performance toward degrading of 50 ppm Methyl Blue (MB) in the presence of UV irradiation. Using catalyst dose of 4 mg the photodegradation efficiency (PDE) reached to 98.7% after 50 min of UV irradiation. This improved photocatalytic activity is attributed to high catalytic activity and surface area of the synthesized Ag decorated TiO2 nanoneedles.
Export citation and abstract BibTeX RIS

Original content from this work may be used under the terms of the Creative Commons Attribution 4.0 licence. Any further distribution of this work must maintain attribution to the author(s) and the title of the work, journal citation and DOI.
1. Introduction
Water bodies including rivers, lakes and seas represent the most vital natural resource for the survival of all living forms, food processing, economic progress and overall well-being [1]. It is one of the most controllable natural resources since it can be diverted, distributed, transported and regenerated. All of these features contribute to water's enormous utility to humans [2]. The country's surface water and groundwater resources play an important role in watering, energy production, cattle development, farming activities, woodland, aquaculture, maritime, leisure activities and so on [3]. Thus, it is difficult to replace the water, tough to filter and expensive to export. It is truly an exceptional gift from nature to humankind that needs to be saved. Nevertheless, environmental pollution - especially the water pollution- is considered as one of the basic problems facing the whole world, hence it negatively affects our daily life [4]. It includes the appearance of foreign substances in the natural surroundings, that damage and disrupts the ecology [5]. These contaminants seem to be either external chemicals or native elements that have exceeded permissible levels [6]. Unfortunately, the pollution is increasing constantly and becoming a serious problem that needs to be treated urgently [7].
Semiconductors metal oxide (MO) such as CuO, SnO2, TiO2, and ZnO are prominent research compounds because of their potential features [8–13]. As a result, MO may be used in a variety of disciplines, including electrodes, light emitting diodes, gas sensors, biosensors, photocatalysts and solar cells [14–17]. Titanium dioxide (TiO2) is a metal oxide that exhibits a large energy gap and a wide variety of interesting properties, such as visible light clarity, low absorption coefficient, high refractive index, hydrophilicity, biocompatibility, resistance to corrosion, low cost, readily available, non-toxic and chemically stable material [18, 19].
It has three natural polymorphs phases: rutile, anatase, and Brookite. The average distances between the Ti4+ ions in anatase are lower than rutile, rendering it less stable thermodynamically [20, 21]. The phase transition from anatase to rutile, however, involves substantial thermal activation and occurs between 700°C–1000 °C depending on the size of the crystal and the quality of the impurity [22–24].
TiO2 can be used in several fields such as paints [25], coatings, fabrics, plastics, inks, medical products [26], pharmaceuticals [27], cosmetics [28], nutritional products and toothpaste [29–31]. Even TiO2 nanostructures are used in sunscreens [32], photonic crystals, nonlinear optics [33], gas sensors [34], bone implant coating, electroceramics components, lithium battery electrodes and solar cells [35].
Among these applications, TiO2 has the most promising application in the field of photocatalysts due to its excellent photoactivity, non-toxicity, high stability, water-insoluble properties under most conditions and low cost [36]. Efforts are devoted to the production of effective TiO2 photocatalysis-based water and air purification technologies [37]. Usually, using this treatment the nonpoisonous inorganic materials could be obtained by oxidizing the poisonous organic composites [38, 39].
Although the photodegradation is a promising technique, nevertheless, there are several demerits that restrain the use of MO as photocatalyst [40]. The first issue is the fast electron-hole recombination that leads to poor efficiency of photon emission [41], making it much harder to effectively disinfect wastewater in large quantities and with dispersed contaminants. The second issue, is the large band gap of the used MO. Meanwhile, when MOs prepared in nanostructure their Eg become larger depending on their size and morphology, as example, bulk TiO2 have 3.2 eV [42], while TiO2 nanoparticles exhibited Eg around (3.3–3.4) eV [43, 44],
Several studies are recently dedicated to improve the TiO2 performance as a photocatalyst [45]. Numerous parameters may control and enhance the photocatalytic properties such as: controlling the phase, controlling the morphology, attaching to multi wall carbon nanotube (MWCNT), doping with noble metals and so on [46–48]. Doping TiO2 with noble metals such as Au and Ag is the promising option for reducing the electron hole recombination in photocatalytic activity [49, 50]. Recently Efforts were made to prepare photocatalyst material with high efficiency at short time by doping TiO2 with Ag. Jiang et al reported that doping TiO2 with silver exhibited 100% photodegradation performance after two hours of irradiation [51]. Albiter et al prepared Ag doped TiO2 to achieve dye degradation of 85% after 60 min [52]. Avciata et al prepared TiO2 doped with Ag nanoparticles which increased the degradation of the dye to 75% after 150 min of irradiation [53]. Other group of researchers in 2020 prepared TiO2 nanostructures doped with Ag and reached an efficiency of 98% after 150 min [54]. Unfortunately, it can be noticed from the literature that most of the previous work either reached to low efficiency or obtained high efficiency at longer time. In this study, TiO2 nanoneedles decorated with Ag nanoparticles were prepared by the photo-deposition method, which generates intra-band gap systems. Thus, when Ag+ ions are loaded to TiO2, the bandgap energy of TiO2 decreases, permitting the activation of TiO2 to enhance photocatalyst decolorization efficiency.
2. Experimental
2.1. Chemicals
The following chemicals were used to prepare TiO2 doped with Ag nanoparticles and to study its ability for degradation as photocatalysis. Titanium dioxide TiO2 (Flucka, Switzerland) and Silver Nitrate AgNO3 (Pub-Chem, United States) were utilized to prepare TiO2 nanoneedles decorated with Ag nanoparticles. As well, Methylene Blue (MB) C16H18CIN3C (Merck, United States) was used as simulated wastewater.
2.2. Synthesis TiO2 doped by Ag
To synthesized TiO2 nanoneedles decorated with Ag nanoparticles the following procedures were followed. The process involved to prepare two solutions. Solution A was prepared by dissolving 1 M of TiO2 P25 Degussa in a mixture of 8 ml of HCl with concentration of (1 M) and 60 ml of Di-ionized water (DIW). Then, solution A was poured in a flask, rapped with plastic wrap and was heated in oven for 1 h at 90 °C. To create the solution B, 10 mg of AgNO3 was liquified in 10 ml of DI water then both stirred together for 1 h to be homogenously mixed. Liquid C was formed by steadily adding liquid A to solution B and actively stirring it at room temperature for 10 min. Subsequently, the liquid C was irradiated with UV irradiation under continuous stirring. In addition, N2 gas was flowed to the solution during the reaction. Following that, the precipitation was removed by filtration then rinsed three times with ethanol. The precipitated TiO2 doped Ag (TiO2- Ag) nanostructures were then filtrated and allowed to dry at 60 °C. Finally, the collected powder was annealed at 400 °C for 1 h to ensure the complete decomposition, remove all the organic residues and transformation of phases to a single anatas phase.
2.3. Characterization
Several techniques were used to characterize the prepared sample. The crystal characteristics of the synthesized powder were examined via x-ray diffractometer (XRD) model Smart-lab using a Cu Ka radiation λ = 0.15418 nm and θ varied from 10 to100 degrees. Field Emission Scanning Electron Microscope (FE-SEM) brand Hitachi S-4800, Transmission Electron Microscope (TEM) brand JEOL JEM-2100 and a High-Resolution TEM (HRTEM) brand FEI Tecnai G2 F20 Super Twin TEM (accelerating voltage: 200 kV) were used to monitor the morphology and determine the size of the sample.
X-ray photoelectron spectroscopy (XPS) model Escalab 250XI with source of Al-Kα was used to determine the elemental composition. N2 isotherm (desorption–adsorption) of the prepared powders, pore size and the surface area analyzed by Brunauer–Emmett–Teller (BET) assessed by means of a surface area and porosimetry analyzer (TriStar3000, GE). An ultraviolet and visible (UV/Vis) spectroscopy model PE lambda 750S was used to evaluate the optical absorption of materials.
2.4. Application
The photocatalytic degradation of MB was investigated under irradiation of UV light (Xenon lamp, 300 W, 10 A) which was kept at RT via a stationary evacuator to prevent any thermal catalytic influence. A specific amount (30 mg) of the synthesized sample was stirred with a proper amount (30 mg l−1) of dissolved MB in DIW. To obtain the adsorption- desorption symmetry for water, MB and TiO2- Ag, all of these materials were stirred along 30 min in the shade. Later, the reacted materials were irradiated with ultra violet irradiation to evaluate the photodegradation behavior. During the irradiation processes a specific amount (3 ml) of the liquid was taken out regularly at each fifteen min. The UV/Vis spectrum analyzer was used to verify the optical absorption spectra of this solution.
The rate of degradation (Kapp) and photodegradation efficiency (PDE) can be calculated using the following equations [55]:


where Co represents the MB concentration before irradiation while the Ct is the MB concentration under UV irradiation. Hence the calibration curve was plotted to calculate the Ct.
3. Results and discussions
3.1. XRD analysis
Figure 1 depicts the XRD study of the prepared thin film. The XRD pattern of the sample exhibited peaks which were found at 2θ° = 25.33°, 36.9°, 37.8°, 38.6°, 48.0°, 53.9°, 55.0°, 62.1°, 62.6°, 68.7, 70.3°, 75.0°, 76.0°, 82.6°, 83.1°, 94.2°, 95.1° and 98.3°. These values equate to planes (101), (103), (004), (112), (200), (105), (211), (213), (204), (116), (220), (215), (301), (224), (312), (305), (321) and (109). These indications are characteristic of the TiO2 anatase tetragonal phase (JCPDS # 00–021–1272) with a = b = 8.94 Å and c = 3.56 Å. Using the Scherrer equation, according to the domain peak (101) the average anatase crystalline size was 68.6 Å.
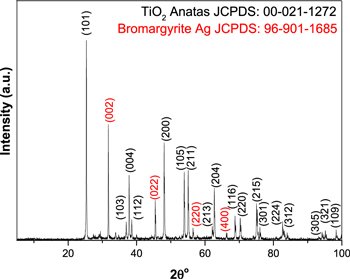
Figure 1. X-ray diffraction patterns of the prepared thin film.
Download figure:
Standard image High-resolution imageThe diffraction peaks even reveal additional diffraction patterns at 2 θ° = 31.7°, 45.4, 56.4, and 66.2. These reflections may be aligned with the Bromargyrite (Ag) cubic crystal structure planes (002), (022), (220) and (400) (JCPDS # 96–901–1685), hence the lattice parameters were a = b = c = 5.3 Å. The crystallite size was calculated based on (002) plane and it was found to be 39.45339 Å.
These results indicated that the prepared sample was Ag doped TiO2. No other peaks were detected indicating the high purity of the prepared sample.
Moreover, since the amplitude of the preferred peak (located at 2 θ° = 25.3°) related to TiO2 was not decreased meaning that the Ag was deposited on the surface sites. Therefore, the attaching mechanism did not affect the TiO2's characteristic crystalline phase; these findings will be supported by SEM analysis.
3.2. FESEM analysis
The morphology, distribution and size of the TiO2–Ag structures were observed by FESEM as shown in figure 2. As can be observed, the samples exhibited semi-spherical structures with size around 300 nm. The high magnification micrographs (c and d) indicated the growth of nanoneedles which had the dimensions of 200 nm length and 20 nm diameters. These nanoneedles are agglomerated to form semi-spherical structures. The morphology of the structures revealed the presence of a thin layer covered the nanoneedles as in figure 2, profile (d). However, the dimensions of the layer are not clear yet. This finding was identical to that obtained from XRD analysis.

Figure 2. FESEM micrographs of TiO2 nanoneedles decorated with Ag nanoparticles with different magnifications where (a) low magnification (35 kX), (b) medium magnification (75 kX), (c) high magnification (150 kX) and (d) the highest magnification (200 kX).
Download figure:
Standard image High-resolution imageEnergy dispersive x-ray (EDX) spectroscopy coupled to a FE-SEM instrument was used to determine the elemental composition of the TiO2–Ag nanorods. The nanocomposite contains titanium, oxygen, silver and gold as predicted in figure 3, which confirmed the doping of silver in TiO2. The atomic ratio of Ti: O2 is equal to 40:60% while the ratio of Ag: TiO2 is about 9.3%. Those it can be predicated the sample as (Ti2 O3)–Ag. Since the silver nanoparticle accepts electrons from TiO2, it becomes charged. To maintain charge equilibrium, oxygen vacancies occur on the anatase surface, that facilitates the atom reordering.

Figure 3. EDX spectrum of TiO2-Ag.
Download figure:
Standard image High-resolution imageThe EDX elemental mapping strategy was followed to trace the arrangement of the elements in the matrix of the nanostructures as shown in figure 4. The collected analytical mapping confirmed the existence of well-dispersed Ag nanoparticles in the synthesized nanocomposite, which conformed the presences of the diminutive amount of Ag in TiO2. Limited locations exhibited nanostructures agglomeration, owing to high surface energy. The EDX pattern also indicates the existence of a small amount of Au particles as a result of the use of a gold sputtering in the FE-SEM study.

Figure 4. EDS elemental mapping where (a) Ti, (b) O, (c) Ag, (d) Au, (e)TiO-Ag and (f) corresponding FESEM image.
Download figure:
Standard image High-resolution image3.3. TEM analysis
TEM images at various magnification of TiO2 decorated with silver nanoparticles were presented in figure 5. The figures deliver strong indicators for size and distribution of the prepared sample. From figures 5(a) and (b) it's clear that the bigger particles are assigned to be nanoneedles TiO2 composed to form larger semispherical particles and the smaller ones are Ag NPs. As can be seen in figures 5(c) and (d), Ag NPs appeared as black particles with average size 5–10 nm. This is due to higher atomic number of Ag, 47 compared to Ti, 22 'bright field'. It is clear that Ag was well distributed on the surface of TiO2 nanoneedles. This indicated that Ag NP is decorated on the surface of TiO2 nanoneedles. It is worth to mention that the preparation strategies were controlled to achieve the stated dimensions of the nanostructures. Furthermore, larger Ag–TiO2 anatase phase is due to the large ionic radius of silver. The findings of the TEM study of TiO2–Ag were found same as described elsewhere in previous work.
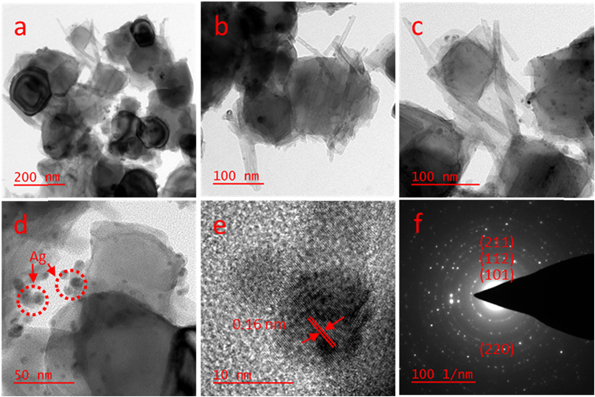
Figure 5. (a)–(d) TEM, (e) HR-TEM, and (f) SAED.
Download figure:
Standard image High-resolution imageHigh resolution transmission electron microscopy (HRTEM) image was shown in figure (5(e)), which revealed a well distribution of silver into the TiO2 surface. From these micrographs, the atomic arrangement, and grain size of Ag–TiO2 were detected. The lattice fringes of d spacing 0.16 nm can be appointed to (211) (JCPDS#0000–021–1272). This result is consistent with the findings of XRD observations.
The selected area electron diffraction (SAED) pattern of TiO2 shown in figure 5(f) which displays separated diffraction rings matching TiO2 anatase phase. It also verifies the growth of tetragonal anatase TiO2 by displaying more than four diffraction rings of the TiO2 crystal planes (101), (112), (211), and (220). Whereas, the brighter lattice fringes denoted to Ag dopant. Moreover, the sharp lattice fringes in patterns of SAED was formed by combination of the separate spots. It is worth to make comparison with some important previous work. As example in 2005 Lee et al described that the Ag doped TiO2 nanoparticles were synthesized via the sol gel technique via a reduction agent. The structure of the synthesized TiO2-Ag nanoparticles was an anatase phase. The synthesized TiO2-Ag nanoparticles exhibited a spherical shape. By calcination TiO2 for 300 °C, the crystal size was around 5–6 nm while for Ag nanoparticles raised from 10 to 15 nm by increasing AgNO3 ratio [56].
3.4. XPS analysis
X-ray photoelectronic spectroscopy (XPS) spectrum was shown in figure 6. The obtained XPS spectra were evaluated with SmartSoft program then handled with Multipack PHI. The values of binding energy were compared to the standard carbon adventitious C 1s signal (284.8 eV) which is usually occurred due to the exposure to environment. Spectra are often equipped with Gauss–Lorentz curves. The spectrometer's energy wide scan was measured using photoelectron lines of O 1s, Ti 2p, Ag 3d and C 1s at 530 eV, 465 eV, 370 eV and 285 eV, respectively. Since the XPS studies were performed for powder sample, the C 1s core level spectrum displayed the attendance of adventitious carbon species. They match to C–O and C–C bonds, at binding energies ∼284.7, and 286.5 eV, respectively.
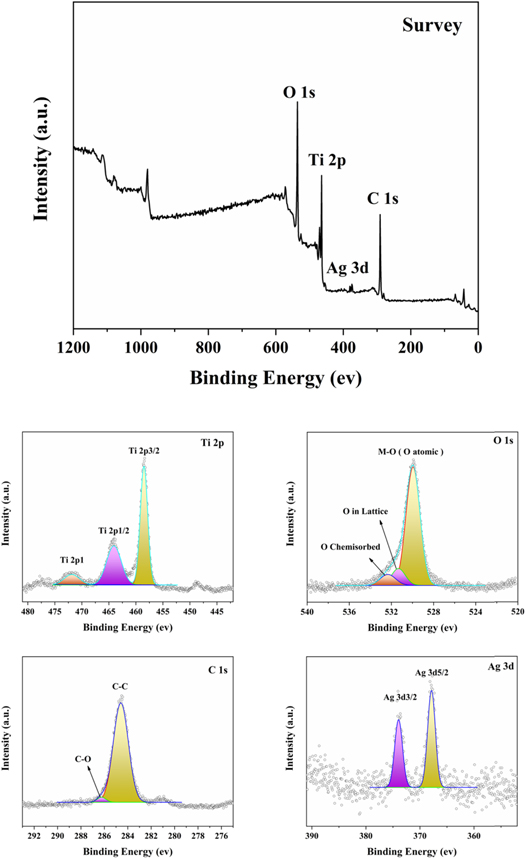
Figure 6. (a) XPS survey spectra assigned to Ag–TiO2 nanoneedles, (b) XPS spectra of Ti 2p region for Ag–TiO2 nanoneedles, and (c) XPS spectra of Ag 3d region corresponds to Ag–TiO2 nanoneedles. The XPS spectra's binding energies are all measured with regard to the C1s peak at 285 eV.
Download figure:
Standard image High-resolution imageThe spectrum shape of Ti 2p core level proposes the existence of an important part of TiO2, beside the predictable Ti2O3 (binding energy of Ti 2p1 ∼ 472 eV, Ti 2p 1/2 ∼ 465 eV and Ti 2p 3/2 ∼ 458 eV). Because XPS is a surface profiling method, the existence of oxygen in TiO2 may result from the powders' fractional surface oxidation prior to examination. These results are in good agreement with previous work [57].
The findings, besides the TiO2 species, demonstrate the existence of Ag 3d 3/2 and 3d 5/2 at BE of 374 eV and 367.5 eV in the XPS spectrum of the Ag–TiO2 sample, showing that Ag has been effectively grown on the surface of TiO2, which is comparable to FESEM photographs. These results in consistence with earlier reported results [58].
3.5. BET analysis
The BET studies including N2 adsorption-desorption isotherm curves of the prepared sample are shown in figure 7. It is clearly observed that at low relative pressure below 0.1 P Po−1 (region i), the isotherm adsorption constantly raised due to the presences of micropores. By increasing the relative pressure higher than 0.1 until 0.53 P Po−1 (region ii), weak hysteresis loop could be observed due to the existences of mesopores. Further increment in relative pressure (region iii) demonstrated that the sample exhibited hysteresis loop in the range of 0.53 to 0.84 P Po−1 which could be assigned that the sample exhibited hollow structure. At higher relative pressure more than 0.84 (region iv), small hysteresis loop could be noticed, which could be attributed to the large mesopores [59]. These mesopores structure may enhance the photocatalytic behavior of the sample.

Figure 7. N2 adsorption- desorption isotherm BET of Ag–TiO2.
Download figure:
Standard image High-resolution imageThe Barrett–Joyner–Halenda (BJH) method represented in figure 8. The curve of pore size distribution (PSD) demonstrating that the adsorption average pore size is equal to 5.2410 nm. It is obviously noticed in figure 8 that the pore volume is equal to 0.159716 cm3 g−1. The results demonstrated that the micropore surface area is equal to 88.5738 m2 g−1. The inset figure revealed that the surface area (BET) of the TiO2- Ag nanoparticles is equal to107.1327 m2 g−1. The high surface area could be ascribed to the presence of Ag which is in agreement with earlier work, hence it was found that the surface area increased from 51 to 110.5 m2 g−1 due to doping TiO2 with Ag. Therefore, doping with silver caused a significant increment in the surface area compared to bare TiO2. They mentioned that higher specific surface area of TiO2 doped with silver would be advantageous for greater adsorption of MO in water solution, as well improved degradation activity may be predicted [60]. Other researchers studied the pore size of TiO2 and found it to be between 2–5 nm [61].

Figure 8. The distribution of pore size of Ag–TiO2.
Download figure:
Standard image High-resolution imageThe sample Ag–TiO2 has a high specific surface area, which might be attributed to the exposure to N2 during the preparation process. At high temperatures, AgNO3 decomposes in the presence of DI-water to produce Ag, thinning the nanoneedles wall and leaving holes, causing the needles wall to shatter under the impact of a significant volume of gas.
3.6. UV analysis
An ultraviolet–visible spectrophotometer was utilized to analyze the optical absorption spectra. Figure 9 depicts the UV/Vis spectrum of Ag–TiO2. The low absorption edge in visible area was evident in the absorption spectrum of Ag-doped TiO2. Ag–TiO2 nanoneedels exhibited an absorption edge at 303 nm and a peak at 358.6 nm which indicated that the absorbance red shifted toward longer wavelength caused by the electron transition from the semiconductor's valence band to the conduction band. Tauc model was used to analyze the UV/Vis results. These results were plotted and are shown inset in figure 9. It could be noticed that the Ag–TiO2 exhibited energy gap of 3.2 eV.
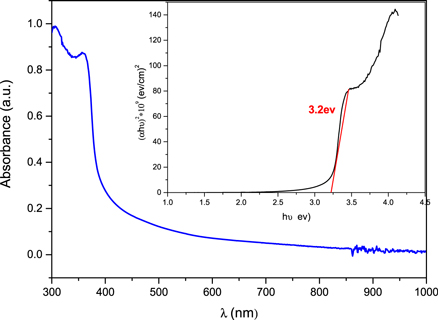
Figure 9. Absorbance spectrum of Ag–TiO2. The inset is the Tauc plot of Ag–TiO2.
Download figure:
Standard image High-resolution imageIt is well known that the nanomaterials exhibited larger electron band gap (Eg) than the bulk size of the same materials. It was reported that the Eg of TiO2 is comparatively large and it depends on the phase hence it is around 3.2 eV for anatas [62], 3.0 eV for rutile [63] and 3.4 eV for brookite [64]. However, the nanosize of these phases exhibited higher energy gap as well, hence the TiO2 nanoparticles in anatas phase exhibited 3.4 and 3.5 eV [65].
For comparison, previous work reported that the pure TiO2 nanotubes exhibited an energy gap of 3.3 eV [66]. Therefore, our results showed a slight reduction of bandgap energy by doping TiO2 with Ag. In addition, previous work investigated the effect of doping Ag to TiO2 on the optical properties. They found that pure TiO2 exhibited absorbance edge at 340 nm with a bandgap of 3.29 eV [67]. Other researchers reported that the presence of Ag in TiO2 displayed a redshift toward the visible region. Indeed, they predicted that the addition of silver ions is often used to create transitional energy states resulting from the high electronic interaction between the orbitals of TiO2 and silver [68].
3.7. MB degradation
In this work the UV irradiation was used due to the large band gap which it needs high photon energy. Although Ag was doped in TiO2 structure but the Eg still large this is due to the small amount of Ag, hence the reduction of Eg depends on dopants ratio in the host material. To evaluate the photocatalytic activity of the synthesized nanoparticles, the decolorization of the methylene blue -as a wasted water- was investigated as shown in figure 10. It has been established that the photocatalytic reaction is strongly influenced by essential factors like the crystallization of the substance, the dimension, the surface area the ability of the absorption. MB was utilized as an indication of free radical removal and hence photoreduction. The photo-reduction of the MB of all Ag–TiO2 powders over 50 min period was found to be greater than 40%. The greatest reduction of the MB dye occurred between 30 and 50 min in the majority of the solutions. Overall, the 4 mg of Ag–TiO2 nanoneedles realized the maximum and faster MB degradation. As predicted, the control solutions of MB and MB with Ag–TiO2 exhibited no degradation because Ag–TiO2 particles mainly display photocatalytic activities during UV light environments. Visible light retains the energy to cross the energy gap and initiate a photocatalytic process. Unlike the pure TiO2 powder, which is solubilized easily in the MB, the residual Ag–TiO2 particles did not disperse well, given the significant processing. However, part of the powder would settle at the bottom of the container.

Figure 10. The absorbance upon UV irradiation time as a photocatalytic performance of Ag–TiO2.
Download figure:
Standard image High-resolution imageThe values of the calibration curve for MB, expressed by the dye concentration as a function of absorbance, are shown below in figure 11. The Lambert-Behr law states that the relationship between concentration and absorbance is linear, thus increasing the concentration will cause the absorbance to increase. Finally, it was found from the figure that the value of the slope = 0.2336.
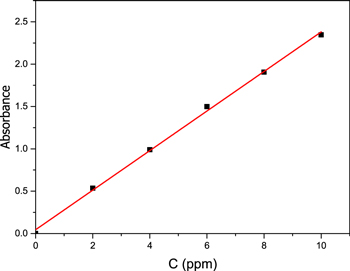
Figure 11. Calibration curve of dye (MB).
Download figure:
Standard image High-resolution imageIn figure 12, (4 mg) of the photocatalyst represented by silver decorated titanium dioxide was used, where the graph represents the relationship between (ln Co/Ct) with time (min) with correspond matching line (red line). The highest rate of reaction velocity, k, and PDE% were calculated to be 0.0788 min−1 and 98.7%, respectively for dose 4 mg.
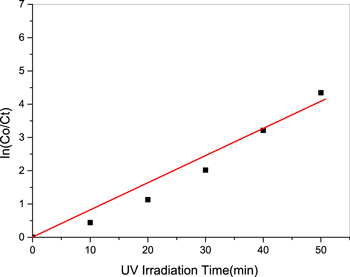
Figure 12. The relationship between (ln Co/Ct) with exposure time (min) to UV light for weight (4 mg).
Download figure:
Standard image High-resolution imageFigure 13 represents the PDE % of various catalyst dose ca, 3, 4, 5 and 6 mg. The results revealed that the lowest PDE % was recorded using 3 mg of Ag–TiO2 hence about 40% of MB removal was obtained after 50 min UV irradiation. Meanwhile the highest PDE% (98.7%) was realized using 4 mg of the prepared sample. By increasing the dose of Ag–TiO2 to 5 mg the removal was reduced to 72%. Further increment in dose up to 6 mg reduced the ability of MB degradation to 57%. These results were tabulated in table 1.
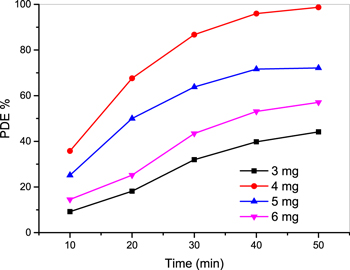
Figure 13. PDE % upon exposure time (min) to UV light for different weight (3, 4, 5 and 6 mg).
Download figure:
Standard image High-resolution imageTable 1. k and PDE in relation to the dosage of Ag–TiO2 sample.
| Dose (mg) | k (min −1) | PDE % |
|---|---|---|
| 3 | 0.012 | 44.13872 |
| 4 | 0.788 | 98.70068 |
| 5 | 0.294 | 72.15163 |
| 6 | 0.176 | 57.07249 |
The pseudo first-order degradation rate constant is denoted by k as depicted in figure 14. The degradation rate constant improved from 0.012 to 0.788 min−1 as the dose of Ag–TiO2 increased from 3 to 4 mg. Further increments in Ag–TiO2 reduced the degradation rate to 0.294 and 0.176 min−1 corresponds to 5 and 6 mg, respectively. This could be attributed to the fact that when Ag–TiO2 dose increase may block the light penetration and therefore inhibit the degradation process [69, 70].

Figure 14. k min−1 for different weight (3, 4, 5 and 6 mg).
Download figure:
Standard image High-resolution image
Several studies were conducted to investigate the ability of pure and doped TiO2 for photocatalytic application. As example, by using an ion-exchange technique, Ag3PO4 was combined with Bi4Ti3O12 to create Bi4Ti3O12/Ag3PO4 heterojunction nanocomposites. The composites showed better performance compared to bare Bi4Ti3O12 and Ag3PO4 nanoparticles in terms of photocatalytic activity [71]. At air pressure, Ti vapor annealing was used to create B-TiO2, with Ag surface modification. After 60 min of visible light irradiation, the degradation rate of RhB reached 97.76 percent [72]. Other work reported that the anatase phase of TiO2 was prepared to investigate the effect of grain size on photocatalytic efficiency. The findings showed that the photocatalytic degradation rate of TiO2 nanoparticles in the anatase process rose dramatically as the grain size increased from 6.6 to 26.6 nm. They assume that increasing the grain size of the TiO2 anatase process will inhibit the undesired redox reaction of hydroquinone-benzoquinone, thereby facilitating the full decomposition of phenol and phenolic compounds [73]. By comparing our results with previously published work, we can conclude that our photocatalyst has higher efficiency for degradation with a shorter time.
4. Conclusion
TiO2 nanoneedles decorated with Ag nanoparticles were prepared via a facile and novel method. Due to the remarkable properties of heterojunction of silver doped TiO2 (Ag–TiO2), it has been demonstrated to be a promising option for photocatalytic degradation under solar light irradiation. The physicochemical characterization of the composites indicates their improved performance over the bare components namely TiO2 and Ag. Ag–TiO2 nanoneedles were very effective for MB degradation in an aqueous environment. The MB degradation rate was enhanced by increasing the dose to 4 mg, after which it gradually declined.
Acknowledgments
The authors acknowledge the College of Science at University of Kerbala and University of Alkafeel.
Data availability statement
All data that support the findings of this study are included within the article (and any supplementary files).