
Abstract
In this paper, the effect of annealing treatment on the microstructure and hardness of extruded Mg-9Gd-4Y-2Zn-0.5Zr alloy (wt. %) was discussed. The microstructure evolution of the alloy under different annealing conditions was studied by optical microscope (OM), scanning electron microscopy (SEM) and electron backscatter diffraction (EBSD), and the variation of hardness was analyzed. With the increase of annealing temperature, the large deformed grains first break into small recrystallized grains. When the temperature continues to increase, the recrystallized grains grow abnormally with the precipitation of chain phase and the fragmentation of lamellar long-period stacking ordered (LPSO) phase. The alloy does not recrystallize at low temperature, and the recrystallize grains grow abnormally at high temperature. The increase of annealing time will also lead to abnormal growth of recrystallized grains. The texture gradually diffuses from the classical extrusion texture to the extrusion direction (ED). The results show that under the condition of 430 °C × 5 h, the recrystallization volume of the alloy is the largest, the recrystallization grain distribution is uniform, and the hardness value is the highest.
Export citation and abstract BibTeX RIS

Original content from this work may be used under the terms of the Creative Commons Attribution 4.0 licence. Any further distribution of this work must maintain attribution to the author(s) and the title of the work, journal citation and DOI.
1. Introduction
Magnesium (Mg) alloy has the characteristics of low density, high specific strength, good electromagnetic shielding and light weight, which is the best material for lightweight equipment. It is widely used in mechanical vehicles, military aerospace and other fields, and has great strategic significance for national defense security and civil science and technology progress [1, 2]. However, due to the special dense hexagonal structure of Mg alloy, its strength and ductility at room temperature are poor [3, 4], which affects the development of Mg alloy. Therefore, how to improve the strength of Mg alloys is widely concerned. Alloying is considered to be one of the most effective methods to improve mechanical properties [5, 6]. Zn, Al, Mn and other elements have been widely used in the development of new Mg alloys [7, 8]. Heating simple Mg alloys to high temperatures is also limited because the microstructure of fine grained alloys is often unstable and exhibits extensive grain growth. Attempts have been made to improve their thermal stability by adding different alloying elements. In this regard, it is reported that the addition of Gd and other rare earth (RE) elements significantly improves the mechanical properties at high temperatures due to solid solution and precipitation strengthening [9, 10]. Therefore, in the past decades, Mg-RE alloys containing LPSO phases have attracted wide attention due to their excellent properties at high temperatures [4, 5, 11].
In addition, grain refinement is an effective way to improve the mechanical properties of alloys and metals [12, 13], which is considered to be the only way to improve the strength and ductility of Mg alloys [2, 14]. Subsequently, many new technologies have been developed to produce ultra-fine grained Mg alloys, such as equal channel angular extrusion and reciprocating upsetting extrusion [15–17]. Dynamic recrystallization (DRX) by large plastic deformation [2, 15]. In addition to dynamic recrystallization, recrystallized grains can also be nucleation and growth in the intermediate annealing between each two deformation passes or in the subsequent annealing process of the deformed alloy, namely, the static recrystallization (SRX) process [10, 18, 19]. Annealing can refine grains, form new microstructure, soften and restore ductility and work ability of deformed materials [2]. In recent years, many studies have analyzed the static recrystallization process of cold rolled Mg-Gd-Y alloy after deformation. L Y Zhao et al [17, 20–22] analyzed the nucleation orientation, grain orientation evolution and preferential growth process of cold rolled Mg-Gd-Y alloy during static recrystallization [15, 23]. Many studies have also analyzed the effect of twinning on the recrystallization behavior. Taking S H Lu et al [17] as an example, the microstructure evolution of forging samples during annealing at 450 °C was tracked, and the tensile twinning and its contribution to SRX were analyzed in detail. Few studies on My-Gd-Y-Zn-Zr alloy focus on the formation and growth of LPSO phase during heat treatment, mainly focused on the formation and growth of LPSO phase during heat treatment. Jianxiong Xiao et al [7] studied the effect of annealing time on grain size and LPSO phase of Mg-6.9Gd-3.2Y-1.5Zn-0.5Zr alloy. He proved the morphology change of recrystallized grain internal phase and the influence of LPSO on recrystallization behavior during annealing. However, the effect of annealing temperature and time on microstructure and mechanical properties of extruded Mg-9Gd-4Y-2Zn-0.5Zr alloy is still unclear.
In this study, the Mg-Gd-Y-Zn-Zr alloy after solution extrusion was treated by peak aging, followed by annealing at 350 °C–450 °C and 1 h–20 h for the same time at different temperatures and annealing at the same temperature for different time. The effects of time and temperature on the grain size and precipitates of the alloy during annealing were observed, and the evolution of texture during annealing and the promotion or inhibition of precipitation relative to recrystallization grain nucleation and growth were analyzed. The effect of annealing time and temperature on the microstructure evolution and mechanical properties of the alloy was clarified by comparing the hardness changes after secondary aging treatment.
2. Experiment
In this experiment, Mg-9Gd-4Y-2Zn-0.5Zr alloy was used for research. The semi-cylindrical as-cast sample with the size of Φ5 × 5 mm was solution treated at 520 °C for 24 h, and then the extrusion sample with extrusion ratio of 16: 1. Then, the sample was subjected to peak aging treatment at 200 °C for 9 h and cooled in water [24–26].
In order to observe the recrystallization behavior of the alloy at different temperatures and different time, and the precipitation phenomenon and texture change during the recrystallization process. Several samples annealed at different temperatures are defined as T350 sample, T420 sample, T430 sample, T450 sample. The experimental design is shown in table 1. All the annealing experiments were completed in the resistance furnace, and the furnace temperature change was controlled within 5 °C during annealing. The extruded sample was cut along the direction parallel to the extrusion, and characterized and analyzed. After sandpaper grinding and mechanical polishing, the corrosion was carried out with acetic acid, alcohol, water and picric acid, and the microstructure was observed under OM (Zeiss). The polished sample was ion thinning to remove the surface stress layer and put into the scan electron microscope (SEM, SU-5000) for EBSD test. The EBSD data were analyzed by Channel 5 software, open OSC file to clean up the noise, cleaning work is divided into three times: First, select Grain CI Standardization in cleanup date option, select Cleanup and add to project as new dataset in Operation option, click OK to complete the first cleaning. Select Grain Dilabon in the cleanup date option, select Cleanup inplace in the Operation option, and click OK to complete the second cleanup. Select Neighor Orientation Correlation in the cleanup date option, select Cleanup inplace in the Operation option, and click OK to complete the third cleanup. Map, Chart and Texture are used to analyze the OSC file after cleaning. The steps of IPF diagram are as follows: { none } option is selected at Grayscal in Map Style option, Inverse Pole Figuire option is selected at Color, large angle grain boundary (15°–100°) and small angle grain boundary (0°–15°) are added in Boundaries option, line width and color are selected as coarse black line and fine white line respectively. The steps to draw the GS (Grain Size) diagram are: select the Grain Size (diamter) in the Type option of Chart, select the Log diagram in X-Axi at the Parameters in the Edit option, and click to determine to generate the grain size diagram; the steps to draw the PF graph are: select the Add PF option in the Texture option, add the texture of the 0001 surface, click OK and open the New Texture Plot, click OK to generate the PF graph. The observation directions of all samples were parallel to the ED. In order to compare the effect of annealing behaviors on the mechanical properties of the alloy, the alloy with the best comprehensive mechanical properties after annealing was selected for the second peak aging treatment at 200 °C for 47 h, and the hardness changes of the alloy after two aging were observed. The UHL VMH-002VM microhardness tester was used for hardness measurement, and it was maintained for 15 s under 200 g load. The average value of 10 points was taken for each measurement.
Table 1. Experimental design.
| Effect of temperature (time control for 5 h) | Selection of temperature: 350 °C, 420 °C, 430 °C, 450 °C |
| Effect of time (temperature control for 420 °C, 430 °C) | Time selection: 5 h, 8 h, 10 h |
3. Microstructure characterization
3.1. Microstructure analysis of alloy in initial state
Taking the sample state after peak aging as the initial state, the initial OM microstructure of the alloy is shown in figure 1, which is mainly composed of block LPSO phase (shown by blue arrow) and large long stripan deformation grains (shown by red arrow) [27, 28]. The characteristics of deformation grains are that large grains are compressed perpendicular to the extrusion direction and elongated along the direction parallel to the extrusion. The alloy exhibits obvious bimodal microstructure, and the coarse deformed grains are surrounded by fine dynamic recrystallization grains, as shown by the green arrow in the figure 1 [24, 29, 30]. Figure 2 shows the KAM diagram of the aged alloy. It can be seen from the figure that there is a high dislocation density at the grain boundary of the deformed grain of the strip, and it gradually decreases to the grain interior, indicating that the residual stresses generated after extrusion are mostly concentrated at the grain boundary of the deformed grain.
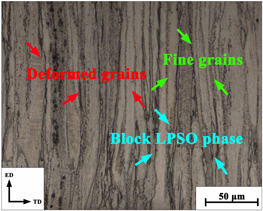
Figure 1. OM images of extruded aged alloy.
Download figure:
Standard image High-resolution image
Figure 2. KAM images of extruded aged alloy.
Download figure:
Standard image High-resolution image3.2. Effect of annealing temperature on recrystallization behavior
In order to observe the effect of annealing temperature on the static recrystallization behavior of Mg-9Gd-4Y-2Zn-0.5Zr alloy, an annealing experiment was carried out in the temperature range of 350 °C–450 °C. The microstructure of the alloy annealed at several low, medium and high sample temperatures for 5 h under OM is shown. Figure 3(a) comparison of the alloy annealed at 350 °C for 5 h The initial grains in figure 1 have no obvious recrystallized grains, which are mainly composed of large deformation grains (red arrow) and fine granular grains (green arrow). Fine grains are speculated to be recrystallized grains that have just occurred nucleation, which indicates that there is an obvious nucleation process, but the occurrence rate of static recrystallization is very slow at low temperatures [19, 31]. Figures 3(b), (c) is the microstructure of the alloy annealed at 420 °C and 430 °C for 5 h under OM. It can be seen that the recrystallization rate of the alloy is obviously faster at higher temperature. At 420 °C, there is still a large strip deformation grain that does not recrystallize. In contrast, the recrystallization occurs more completely at 430 °C with higher temperature, and a relatively complete static recrystallization occurs. There is basically no large deformation grain. It can be seen that only a small part of the matrix is not dissolved. The growth of SRX grains is not isotropic, that is, the growth is delayed in some regions. A large number of chain phases precipitated above recrystallized grains during annealing, as shown by the yellow arrow in figure 3(c) [32–35]. Figure 3(d) is the microstructure of the alloy annealed at 450 °C for 5 h. It can be seen from the figure 3 that most of the deformed grains have static recrystallization, but because of the high temperature, most of the recrystallized grains have abnormal growth behavior, and there are still some undissolved phases. Compared with 420 °C or 430 °C, although the coarse matrix dissolves much more, the grain size is too large, which will affect the comprehensive mechanical properties of the alloy, so it is not the most suitable annealing temperature.
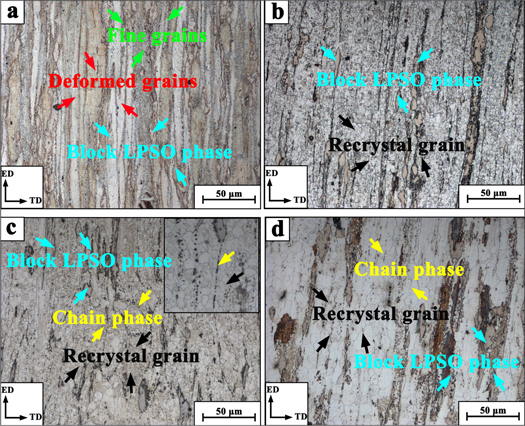
Figure 3. The OM microstructure of the alloy annealed at different temperatures for 5 h (a) 350 °C (b) 420 °C (c) 430 °C (d) 450 °C.
Download figure:
Standard image High-resolution imageFigure 4 shows the SEM images of the initial state of the alloy and annealing at 420 °C × 5 h and 430 °C × 5 h.According to the analysis of SEM images, a large number of chain phases (shown by yellow arrows) precipitated in the upper layer of the matrix during annealing, most of which gathered at the recrystallized grain boundaries and were parallel to the ED [36]. The energy spectrum analysis is shown in table 2. The main components of precipitation are Mg matrix and rare earth elements Gd and Y. It is found that the precipitation number of chain phase at 430 °C is significantly greater than that at 420 °C, that is, the occurrence of recrystallization behavior is accompanied by the precipitation of phase, and the precipitation rate and precipitation number of chain phase increase with the increase of temperature. According to the 500 times magnification in the red frame, it is found that a large number of block phase precipitates in the upper layer of lamellar LPSO phase except the annealed Chain-like granular precipitate. Table 2 is the energy spectrum analysis of the block phase. It is concluded that the composition of the phase is mainly Y and Gd. According to the composition analysis of the phase, it is speculated that the block phase should be rich in RE.
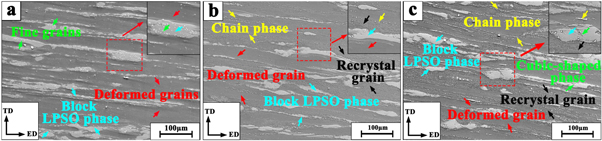
Figure 4. The SEM microstructure of the alloys in different states (a) Extrusion aging state (b) Annealing at 420 °C for 5 h and (c) Annealing at 430 °C for 5 h.
Download figure:
Standard image High-resolution imageTable 2. Component weight of precipitated phase (unit:%).
| Mg | Y | Zr | Gd | Zn | |
|---|---|---|---|---|---|
| Chain phase | 72.33 | 8.74 | 0.78 | 17.80 | 0.35 |
| Block phase | 3.35 | 49.23 | 5.42 | 41.66 | 0.34 |
3.3. Effect of annealing time on recrystallization behavior
According to the annealing pre-experiment, the recrystallization effect is relatively optimal when the annealing temperature is 420 °C and 430 °C in the temperature range of 350 °C–450 °C. The diagram is OM after annealing at 420 °C and 430 °C for 8 h and 10 h. By comparing (b) (c) annealing at 420 °C and 430 °C for 5 h in figure 3, it is found that with the increase of annealing time, the size and number of coarse deformed grains gradually decrease, and the finer static recrystallized grains are replaced. The volume fraction of recrystallization at 420 °C for 8 h is higher than that at 5 h, and the deformation grains of large blocks are reduced. After annealing at 430 °C for 8 h, the original deformed grains basically disappeared, but the grain size increased significantly. In addition, compared with 430 °C × 8 h and 420 °C × 8 h, shown in figures 5(a), (b), it is found that the effect of temperature on recrystallization behavior is much greater than that of time on recrystallization behavior. Longer annealing can promote the uniformity of recrystallized grains when recrystallization occurs incompletely, but further increasing the annealing time will only make the grains grow abnormally when recrystallization occurs relatively complete.

Figure 5. OM microstructure of alloys with different annealing time: (a) annealing at 420 °C for 8 h, (b) annealing at 430 °C for 8 h, (c) annealing at 420 °C for 10 h, (d) annealing at 430 °C for 10 h.
Download figure:
Standard image High-resolution imageAt 10 h, precipitation and precipitation behaviors were observed in different degrees at both temperatures. At 420 °C, most fine lamellar LPSO phases (shown by blue arrows) and a small number of deformed grains were mixed in the middle of recrystallized grains. At 430 °C, only a few narrow recrystallized grain strips (shown by black arrows) were transformed into precipitates, and a large number of chain phases were precipitated on the recrystallized grain strips. It shows that the recrystallization grains with larger volume fraction will not be produced after annealing for a certain time, even the precipitation may hinder the recrystallization behavior of recrystallization grains further. According to the amplification diagram of annealing at 420 °C and 430 °C for 10 h, it is found that a large number of short lamellar phases with different tilt angles precipitated at the upper or boundary of recrystallized grains can be observed under the OM at both temperatures after annealing for 10 h. It is speculated that the phase precipitation should be generated after the recrystallization occurs completely and the recrystallization grain growth process reaches the limit after continuing heating [37, 38].
By comparing the OM microstructure of the alloy at several annealing temperatures and time, it is concluded that the optimal annealing condition is 430 °C × 5 h. Under this annealing condition, the recrystallization volume fraction of the alloy is large, the grain refinement effect is good and the size distribution is uniform, and there is no abnormal growth grain [39, 40]. The grain size is relatively uniform at 420 × 8 h, but the grain size is slightly larger than that at 430 × 5 h. Lower annealing temperature and shorter annealing time can not make the recrystallization behavior completely, higher temperature and longer annealing time will lead to abnormal grain growth.
3.4. Analysis of EBSD
The microstructure of the alloy was characterized by EBSD. Figure 6 shows the grain orientation diagram and Grain size diagram of the alloy in different states. Figure 6(a) is the overall orientation image of the initial alloy. The initial alloy is composed of elongated grains distributed along the extrusion direction. The orientation of a single grain is the same, and the orientation of similar grains is similar. A large number of small angle grain boundaries are distributed at the grain boundaries, as shown in the white part of figure 6(a). During the extrusion process, the grains are elongated along the extrusion direction, and a large number of fine dynamic recrystallization grains are distributed at the grain boundaries. The grain size shows a bimodal distribution. As shown in figure (c), the percentage of small grains and large grains is higher, so it shows a higher percentage peak. The orientation image of small grains in the initial state is shown in figure 6(b), and the volume fraction of small grains is 34.3%. Figures 6(d), (e) is the orientation image of the whole grains and small grains annealed at 420 °C for 5 h. The grains with grain size less than 10 μm are defined as crystalline grains [41, 42], and the volume fraction of recrystallization reaches 49.4%. However, the distortion energy stored in the crystal is not enough due to the low temperature and short heating time. There are still some large deformed grains without recrystallization. There is still a high dislocation density at the boundary of deformed grains, and small angle grain boundaries are still dense in deformed grains. Figure 6(f) is the grain size distribution of annealed at 20 °C for 5 h. Due to the occurrence of return behavior, some medium-sized grains have static recrystallization behaviors, and the bimodal structure is more obvious. Figures 6(g), (h) and (j), (k) are orientation images of whole grains and recrystallized grains annealed at 420 °C for 8 h and 430 °C for 5 h, respectively. It can be seen that with the increase of annealing time and annealing temperature, the volume fraction of recrystallization increases to more than 60%, and the large deformation grains almost disappear. After annealing at 430 °C for 8 h, the deformed grains are basically transformed into small recrystallized grains. There is no large amount of deformed grains, and the small angle grain boundary is basically disappeared [43]. However, some grains have abnormal growth. The grain size changes from the initial bimodal structure to the small grain size, and the recrystallization volume fraction reaches 70%. Compared with several states, the grain size distribution of the alloy at 430 °C * 5 h is the most uniform, the recrystallization volume fraction is higher and there is no abnormal growth phenomenon.

Figure 6. EBSD IPF maps and PF of samples: (a)–(c) aging state, (d)–(f) 420 °C × 5 h, (g)–(i) 420 °C × 8 h, (j)–(l) 430 °C × 5 h, (m)–(o) 430 °C × 8 h. (a), (d), (g), (j), (m) is the IPF maps of full grains, (b), (e), (h), (k), (n) is the IPF maps recrystal grain, (c), (f), (i), (l), (o) is the PF maps of samples in different states.
Download figure:
Standard image High-resolution image4. Discussion
In this paper, the effects of temperature and time on the recrystallization behavior during annealing treatment are mainly studied. In the previous section, we mainly analyzed the microstructure changes of grain size and precipitation phase during annealing. However, the performance changes caused by microstructure changes are not clear.
Texture is a key factor affecting mechanical properties of wrought magnesium alloys [44]. In close-packed hexagonal metals, preferential growth of basal oriented grains in magnesium alloys has been reported, and it is believed that this preferential growth is the main reason for the formation of basal texture [43]. Figure 7 shows the PF diagram of the basal plane under different annealing conditions. It can be seen that the alloy has obvious extrusion texture, and the peak texture strength reaches 11.56 after aging. With the increase of annealing time, the texture is dispersed to the extrusion direction, and the maximum texture strength of the basal plane decreases. The results show that with the annealing treatment, the basal texture is weakened, and the dense hexagonal crystal deflects in all directions. At 430 °C × 5 h, it has shown a relatively uniform distribution, and the peak texture intensity is also reduced to 3.31. This may be due to texture weakening caused by grain refinement during annealing [45].
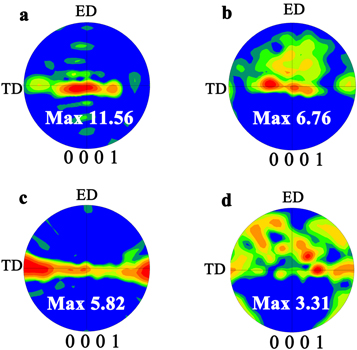
Figure 7. PF diagram of alloys under different conditions: (a) aging state (b) 420 °C × 5 h (c) 420 °C × 8 h (d) 430 °C × 5 h.
Download figure:
Standard image High-resolution imageFigure 8 describes the occurrence of static recrystallization behavior during annealing. Figure a shows that the composition of the original grains is mainly lamellar LPSO phase and the original deformed grains. After low temperature or short time annealing, the lamellar LPSO begins to break, and the static recrystallized grains first occur from the grain boundaries with higher residual stress [46]. As the annealing temperature increases or as the annealing time increases, the recrystallization behavior at the grain boundaries gradually spreads to the middle of the deformed grains, and static recrystallization occurs at the broken lamellar LPSO phase, as shown in figure (c). When the annealing behavior continues, accumulated enough energy, static recrystallization behavior gradually complete. This is similar to the research of S H Lu [17].
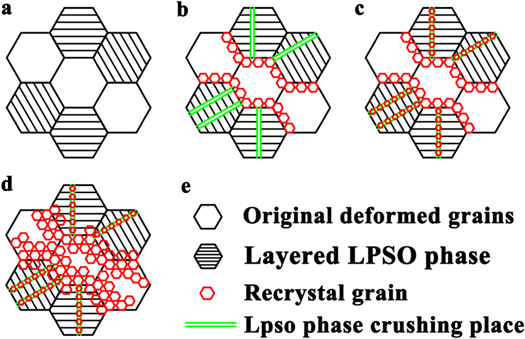
Figure 8. The occurrence process of i static recrystallization behaviors during annealing.
Download figure:
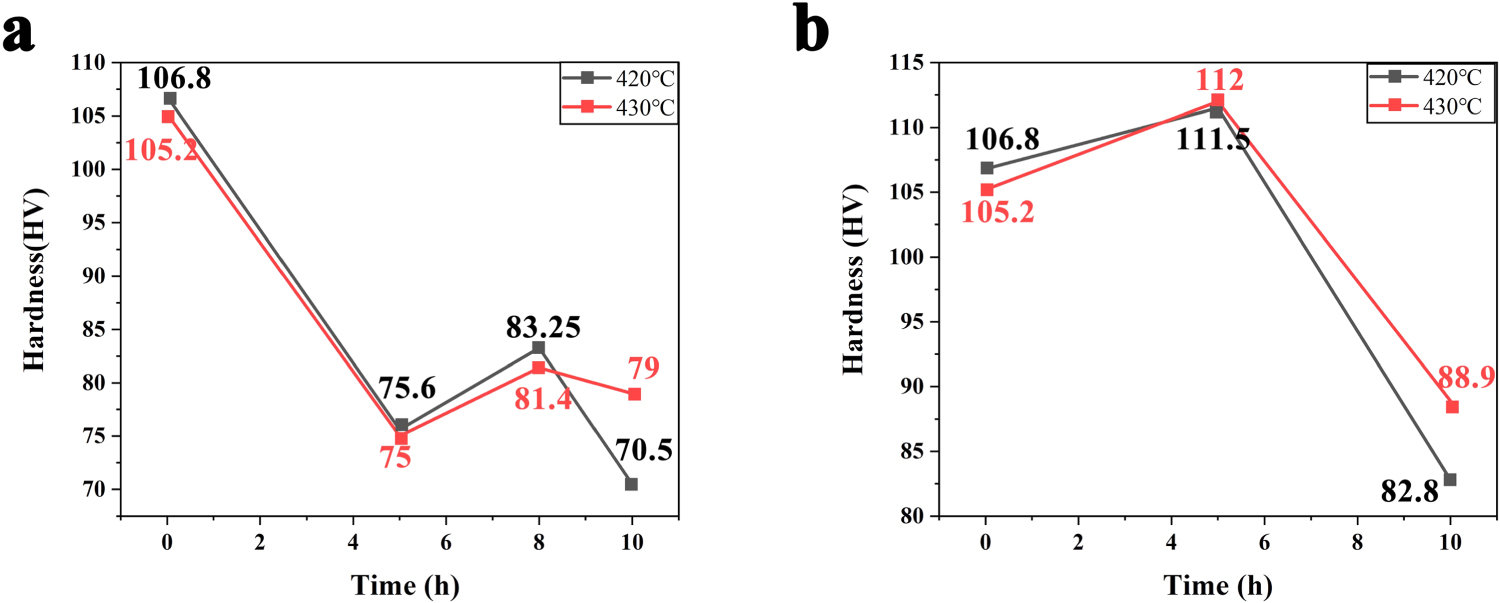
Standard image High-resolution imageFigure 9(a) shows the hardness comparison curves of the alloy after one aging at 420 °C and 430 °C for different annealing time. Figure 10 shows the standard deviation and variation coefficient of two aging states before and after annealing [47]. As shown in the figure 9, the hardness of the alloy at aging state is higher, and the hardness decreases significantly after annealing. The hardness changes at the two temperatures are similar. The hardness of the alloy decreased continuously in the first five hours and increased from 5 h to 8 h. According to the microstructure analysis of the alloy, the increase of hardness caused by grain refinement at 5 h was greater than that caused by annealing. The abnormal growth of recrystallized grains at 8 h resulted in the decrease of properties and hardness of the alloy [48, 49]. Figure 9(b) is the hardness curve of the alloy annealed at 420 °C and 430 °C for two times. It can be seen from the figure that the hardness of the alloy is improved after annealing for 5 h and then secondary aging treatment, and the hardness begins to decrease after 5 h, which is consistent with the change trend of hardness during annealing. Comparing the two figures, it is found that the hardness of the alloy at two temperatures is similar, and the static recrystallization behavior after annealing can improve the mechanical properties of the alloy [24]. After secondary aging, the hardness at 430 °C × 5 h is slightly higher than that at 420 °C × 5 h, which is in line with the grain refinement effect at 430 °C × 5 h shown above.

Figure 9. Hardness of alloys under different aging conditions: (a) Comparison of hardness between 420 °C and 430 °C alloy after first aging (b) Comparison of hardness between 420 °C and 430 °C alloy after second aging.
Download figure:
Standard image High-resolution image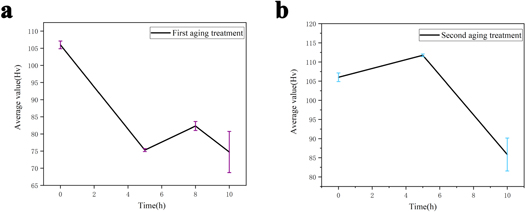
Figure 10. Standard deviation and variation coefficient of two aging treatments before and after annealing.
Download figure:
Standard image High-resolution image
5. Conclusion
In this paper, the effects of static recrystallization behavior of Mg-Gd-Y-Zn-Zr alloy annealed at different temperatures and time on the microstructure and hardness of the alloy were systematically discussed and studied. The main conclusions are as follows:
- 1.The RE Mg alloy extruded with large extrusion ratio was annealed. When annealing temperature was 430 °C and annealing time was 5 h, the recrystallized grains were fine and uniform, and the volume fraction of recrystallized grains was small.
- 2.A large number of blocky and granular phases are precipitated during the annealing process of RE Mg alloy, and the hardness of the alloy can be significantly improved within a certain range.
- 3.The static recrystallization behavior generated by annealing will produce the phenomenon of texture weakening, and the texture parallel to the ED is deflected perpendicular to the ED.
Acknowledgments
The present research was supported by the National Natural Science Foundation of China (Grant No.52075501)and the open fund project of Hubei Key Laboratory of Advanced Technology for Automotive Components (XDQCKF20211002) and High Performance Magnesium Alloy XXX Multidirectional Extrusion Forming Technology (JCKY2018408B003).
Data availability statement
All data that support the findings of this study are included within the article (and any supplementary files).