
Abstract
We report a systematic investigation on structural and thermoelectric properties of Spark plasma sintered Lead telluride synthesized by hydrothermal route and a low temperature aqueous chemical route without using any organic solvent and surfactant. The as-synthesized powder samples obtained from these two different synthesis routes were identically subjected to spark plasma sintering. The size of nanocubes formed by the hydrothermal method, as evident from TEM-HRTEM images, is 50 nm; however, the samples synthesized by aqueous chemical route shows mixed morphology with particle size < 50 nm. The thermoelectric properties of spark plasma sintered bulk nanostructured samples have been measured from RT to 700K. Notably, large Seebeck coefficient and small electrical resistivity values are observed in the sample synthesized by the hydrothermal route, which is ascribed to the charge carrier energy filtering effect. A maximum reduction of ∼38% and ∼58% has been observed in the sample synthesized by the hydrothermal route and aqueous chemical route, respectively, compared to the bulk ingot. The maximum figure of merit attained is 0.18 at 673 K in the lead telluride sample synthesized by the hydrothermal route.
Export citation and abstract BibTeX RIS

Original content from this work may be used under the terms of the Creative Commons Attribution 4.0 licence. Any further distribution of this work must maintain attribution to the author(s) and the title of the work, journal citation and DOI.
1. Introduction
Thermoelectric energy conversion technology utilizes the Seebeck and Peltier effect for the interconversion between thermal and electrical energy. There has been a renewed interest in thermoelectric technology due to a large interest in harvesting the waste heat and solid-state refrigeration-based devices [1]. This technique is more significant in the areas where there is ample quantity of waste heat and is likely to play a crucial part in clean and renewable energy [2]. The conversion efficiency of a thermoelectric material is determined by the dimensionless figure of merit zT, which is, in turn, the function of the intrinsic material parameters,

Where S, σ , and κ represent the Seebeck coefficient, electrical conductivity, and coefficient of thermal conductivity at the temperature T [3]. Hence, to boost the thermoelectric performance of a material, the Seebeck coefficient and electrical conductivity need to be enhanced while simultaneously maintaining small values of thermal conductivity. However, the complicated relationship between these material parameters impedes the efforts in obtaining high TE performance and the widespread use of thermoelectric technology [4]. Nanostructured thermoelectric materials are of great interest as they offer a unique way to independently tune these material parameters and hence enhance the zT value [5]. Recent advances show that it is possible to improve the zT values in nanostructured material by reducing the lattice component of thermal conductivity through the intensive scattering of the phonons at grain boundaries/crystal interfaces and enhancing the thermoelectric power factor by carrier energy filtering and quantum confinement effects [6].
Lead telluride is considered as an outstanding material for power generation in the mid-temperature range due to its appropriate physical and chemical properties. In the last decade, numerous state-of-the-art strategies have been applied in PbTe alloys to enhance thermoelectric performance. The efforts mainly rely upon two diverse strategies: (1) by improving the power factor through tuning the band engineering through resonant doping [7], band flattening [8], band convergence [9], band gap enlargement [10], and band alignment [11] and (2) by reducing the thermal conductivity by designing all scale hierarchical architecting from mesoscale, atomic-scale to nanoscale [12]. Nanostructured lead telluride synthesized by numerous bottom-up methods such as wet chemical routes have been reported in the last few years [13–17]. However, very few of them have taken note of their thermoelectric performance [16, 17]. Further, the complex process control, high reaction temperature, longer synthesis duration, and surfactants/capping agents used in the synthesis process limits the use of the synthesized product in applications. Hence, the synthesis of lead telluride nanostructures under simple mild conditions without any organic surfactant and solvent is of great interest.
In the present work, we report the synthesis of lead telluride by two different routes, a low-temperature aqueous chemical route and a hydrothermal route without using any organic surfactant or organic precursors, and the thermoelectric properties. The nanoparticles synthesized through both the methods are in sufficiently large quantities and are easily further processed through spark plasma sintering. The present study aims to investigate the outcome of nano-structuration on the thermoelectric properties of PbTe. We have systematically investigated the thermoelectric properties (S, σ and κ) across a broad temperature range 300–700 K. One of the main outcomes of this study is that the total thermal conductivity of samples at room temperature synthesized by hydrothermal route and aqueous chemical route, respectively, are ∼38% and 58% less than the thermal conductivity of bulk PbTe ingot. A minimum lattice thermal conductivity of 0.64 W m−1 K−1 at 473 K is achieved in the sample synthesized by aqueous chemical route which is significantly smaller than the thermal conductivity of bulk PbTe ∼ 1.50 at 450 K.
2. Experimental section
Analytically pure lead acetate [Pb(CH3COO)2], Tellurium metal powder (Te), Sodium borohydride (NaBH4), and sodium hydroxide (NaOH) have been procured from Sigma Aldrich.
2.1. Preparation of PbTe
Aqueous chemical route: Approximately 5 g NaOH powder was dissolved in double-distilled water at 323 K. When NaOH is completely dissolved, 2 g NaBH4 and 0.01 mol Te metal powder were added to the aqueous NaOH solution with constant magnetic stirring. After the change in the color of the solution to dark purple, 0.01 mol lead acetate aqueous solution was added to the beaker drop-by-drop. Once the reaction is completed, the beaker was allowed to cool to room temperature, and the obtained black powder was filtered out and washed with distilled water, acetone, and ethanol. At last, the powder sample was dried in air ambient for 3 h at 323K.
Hydrothermal synthesis route: The stoichiometric amount of lead acetate and tellurium powder were added to a beaker containing an aqueous solution of NaBH4 with constant magnetic stirring. After some time, 20 ml aqueous NaOH solution was added to the beaker, and the resulting solution was transferred to a Teflon-lined stainless-steel autoclave. Finally, the autoclave was filled to 80% of the total capacity with distilled water and maintained at 433 K for 14 h in a furnace. After the reaction was over, the autoclave was cooled to room temperatures. The obtained black powder was filtered out and washed with distilled water, acetone, and ethanol. Lastly, the powder sample was dried in air ambient for 3 h at 323 K, as in the former route.
2.2. Sintering
The as-synthesized PbTe nanopowders were loaded in graphite die and consolidated using spark plasma sintering (SPS) using Syntex, Japan make furnace at a temperature of 773 K for 8 min under a pressure of 20 MPa.
A schematic of the synthesis process is shown in figure 1.
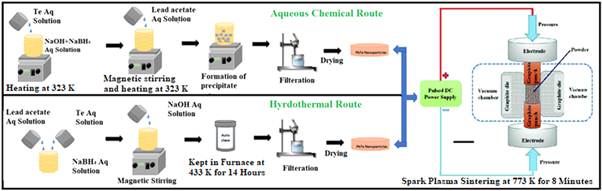
Figure 1. Schematic of Synthesis process (a) aqueous chemical route, (b) hydrothermal route. From [18]. Reprinted with permission from Elsevier.
Download figure:
Standard image High-resolution image2.3. Characterization
The XRD measurements on as-synthesized Lead telluride samples were performed by employing a diffractometer (Philips Xpert Pro) using Cu-Kα radiation from 20° to 80° with a step size of 0.02°. Microstructure of both the as-synthesized samples and the SPS'ed (Spark Plasma Sintered) PbTe samples have been investigated by FESEM (field emission scanning electron microscope) (Jeol JSM-7800F) and (EDS) energy dispersive patterns. The morphology of nanostructured PbTe samples was determined by using TEM (Transmission electron microscopy) and HR-TEM (high-resolution transmission electron microscopy (JEM 2100F JEOL).
2.4. Measurements
The thermoelectric properties of the SPS'ed lead telluride samples have been investigated from room temperature to 700 K. The thermal conductivity of the bulk nanostructured samples was calculated using the expression  where
ρ
, Cp and D are the density, specific heat and thermal diffusivity of the sample, respectively. The density of the samples was measured using Archimedes method, and the thermal diffusivity (D) was determined by employing Laser Flash Apparatus ((LFA 1000), Linseis Messgeraete GmbH, Germany NPL). Specific heat capacity value has been adapted from data reported by Quin B et al, (2019) [19]. After the measurement of thermal diffusivity on the samples, rectangular pellets were cut out from the SPS'ed discs for the simultaneous measurements of Seebeck coefficient and electrical conductivity by employing ULVAC ZEM 3 in a Helium atmosphere.
where
ρ
, Cp and D are the density, specific heat and thermal diffusivity of the sample, respectively. The density of the samples was measured using Archimedes method, and the thermal diffusivity (D) was determined by employing Laser Flash Apparatus ((LFA 1000), Linseis Messgeraete GmbH, Germany NPL). Specific heat capacity value has been adapted from data reported by Quin B et al, (2019) [19]. After the measurement of thermal diffusivity on the samples, rectangular pellets were cut out from the SPS'ed discs for the simultaneous measurements of Seebeck coefficient and electrical conductivity by employing ULVAC ZEM 3 in a Helium atmosphere.
3. Results and discussions
3.1. Structural analysis
The XRD diffractograms of the as-synthesized lead telluride samples from both the routes have been demonstrated in figure 1, along with the Rietveld refinement profiles.
As can be observed from figure 2, all the prominent diffraction peaks can be indexed to the FCC PbTe structure with space group Fm-3m (225) JCPDS #78-1905. There are no diffraction peaks from any impurity in the XRD diffractogram (See figure 2(b)), confirming that single phase PbTe has been successfully synthesized by using a simple hydrothermal reaction The intensity of the XRD peaks observed in the lead telluride sample synthesized by the hydrothermal method is relatively higher in contrast to the sample synthesized by aqueous chemical route (See figure 2). It indicates that the sample synthesized by the hydrothermal route is more crystalline in comparison to the sample synthesized by the aqueous chemical route. Further, the sharp peaks indicate that the crystallite size of the lead telluride sample synthesized by hydrothermal method is larger in comparison to the sample synthesized by aqueous chemical route which is also consistent with the HR- TEM observations (See figure 3).On the contrary, the sample synthesized by the aqueous chemical precipitation method results in PbTe product having relatively small-sized nanoparticles (broad peaks) with a few additional peaks corresponding to traces of unreacted Te in the sample (See figure 2(a)). Further, two peaks of very low intensity (marked by *) couldn't be identified as the Braggs position due to both the phase lies very close and hence peaks possibly. The calculated lattice constant using Rietveld refinement for the sample synthesized by hydrothermal route is 0.64556 nm and that synthesized using aqueous chemical route is 0.64590 nm; both values are in close agreement with the literature value (0.64540 nm) [20].
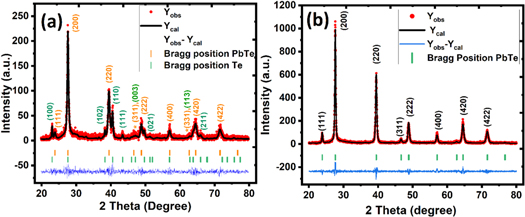
Figure 2. X-ray diffractogram and Rietveld refinement profiles of the lead telluride prepared by (a) aqueous chemical route, and (b) Hydrothermal routes.
Download figure:
Standard image High-resolution image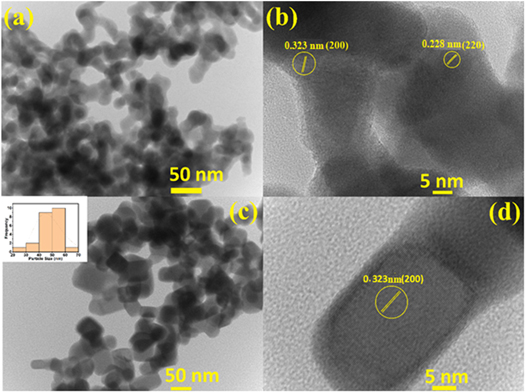
Figure 3. TEM/HR-TEM image of the as- synthesized lead telluride sample by (a), (b) aqueous chemical route, (c), (d) hydrothermal route (inset in figure 3(c) shows the size distribution histogram of lead telluride nanoparticles synthesized using hydrothermal route as calculated using the corresponding TEM image).
Download figure:
Standard image High-resolution imageThe value of various parameters obtained by the Rietveld refinement has been shown in table 1.
Table 1. The value of various parameters obtained by the Rietveld refinement.
| Refined parameters | Sample A (Aq) | Sample B (Hy) | |
|---|---|---|---|
| PbTe | Te | PbTe | |
| a(nm) | 0.64590 | 0.44546 | 0.64556 |
| b(nm) | 0.64590 | 0.44546 | 0.64556 |
| c(nm) | 0.64590 | 0.59229 | 0.64556 |
| α (°) | 90 | 90 | 90 |
| β (°) | 90 | 90 | 90 |
| γ (°) | 90 | 120 | 90 |
| Phase percentage (%) | 89.92 | 10.08 | 100 |
| Rp (%) | 21.1 | 12.2 | |
| Rwp (%) | 29.9 | 18.2 | |
| Rexp (%) | 28.41 | 16.0 | |
| Chi square (χ2) | 1.10 | 1.17 | |
We have calculated the crystallite size for the (200) peak using the Debye–Scherrer equation,

Where K, λ, β, and θ are Scherrer constant, wavelength of copper Kα radiation, FWHM (full width of the peak at half maximum) and Bragg's angle, respectively. The value of Scherrer constant lies between 0.89 to 0.94. The (200)-diffraction peak yields a crystallite size of 23.5 nm for the sample synthesized by the aqueous chemical route and 29.0 nm for the sample synthesized by the hydrothermal route. It is to be noted that crystallite size is not necessarily the same as that of particle size. Further, the broadening of the XRD peak can also be due to the internal stress and defects induced during the synthesis process. Hence, the crystallite size as estimated using Scherrer equation is expected to be smaller than the actual value [20]. The calculated crystallite size for both the synthesized samples is far lesser than Bohr's excitonic radius of lead telluride (∼152 nm) [21]. It is noteworthy that the Seebeck coefficient could be remarkably enhanced in the nanostructured systems due to carrier filtering and quantum confinement effects [22].
3.2. Morphological analysis
Figure 3(a) shows the TEM image of as-synthesized lead telluride nanoparticles synthesized by aqueous chemical route. It can be observed from the figure that the nanoparticles exhibit mixed morphology with particle size < 50 nm (See figure 3(a). The HR-TEM image of the lead telluride sample synthesized by aqueous chemical route has been depicted in figure 3(b). The clear lattice fringes as evident in HR-TEM image have the interplanar spacing of 0.323 nm and 0.228 nm, which corresponds to (200) and (220) plane of lead telluride. Figure 3(c) presents the TEM image of the lead telluride sample synthesized by hydrothermal route. It is evident from the figure that the as-synthesized nanoparticles have cubic morphology with edge length ∼50 nm. The inset in figure 3(c) shows the size distribution histogram for PbTe nanoparticles synthesized using the hydrothermal route. Figure 3(d) presents the HR-TEM image of the single particle of lead telluride sample synthesized by hydrothermal route. The lattice fringes observed in figure 3(d) have an interplanar spacing of 0.323 nm which corresponds to (200) plane of lead telluride crystal.
The clear lattice fringes observed in HR-TEM images (See figure 3(b) and d)), indicates that lead telluride nanoparticles synthesized from both the routes are perfectly crystalline. The FESEM-EDS images of SPS'ed PbTe samples are shown in figures 4(a)–(c) for aqueous chemical route and figures 4(d)–(f) for hydrothermal route. It was revealed from the elemental mapping images (b), (c), and (e), (f) that both the elements (Pb, Te) are uniformly distributed in the whole matrix, confirming that homogeneous composition has been achieved in both the samples.
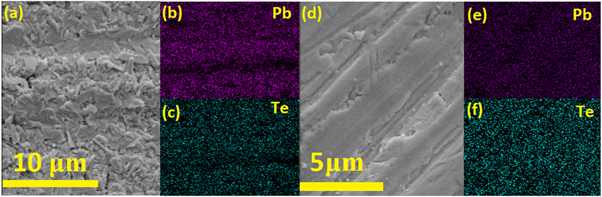
Figure 4. FESEM-EDS Images of sintered pellets of lead telluride synthesized by aqueous chemical route (a)–(c) and hydrothermal route (d)–(f).
Download figure:
Standard image High-resolution imageThe FESEM images of the sintered pellets are shown in figure 5.
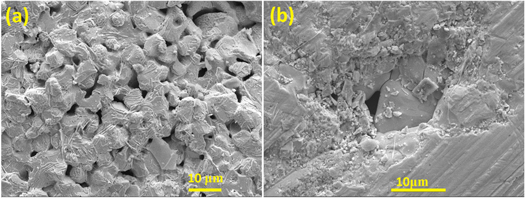
Figure 5. FESEM images of the spark plasma sintered samples of lead telluride, synthesized by (a) aqueous chemical route and (b) hydrothermal route.
Download figure:
Standard image High-resolution imageThe images reveal the porous nature of the samples synthesized by the aqueous chemical route, while the sample synthesized by the hydrothermal route appears relatively compact and distinctly dense. The existence of pores in the former is also consistent with the measurement of density in them. The density of the sample synthesized by the aqueous chemical route is close to 78%, and that of the sample synthesized by the hydrothermal route is 88% of the theoretical density. The relatively smaller density in our SPS'ed samples in comparison to the samples synthesized by the top-down approach (ball milling) [23] confirms the presence of porosity in the SPS'ed samples. In order to achieve higher densities, remarkably excessive sintering temperatures and prolonged durations are required, which may result in inevitable grain growth. The relationship between thermal conductivity and volume of pores inside a material is given by,

Where,
κ
is the coefficient of thermal conductivity with porosity,  is the coefficient of thermal conductivity with 100% total density, and P is the porosity. As per the equation, an increase in porosity has a detrimental effect on the thermal conductivity due to additional scattering of phonons across the pores in the porous material [24, 25].
It was reported that a nearly 100% enhancement in zT could be achieved by porous architecture engineering [26]. However, there will always be a tradeoff between the beneficial effect of reduction in thermal conductivity and the detrimental impact on the electrical conductivity.
3.3. Thermoelectric properties
In this section, the impact of microstructure on the transport properties of synthesized nanostructured lead telluride samples will be addressed. The temperature dependent Seebeck coefficient and electrical conductivity are presented in figures 6(a) and (c), respectively. Furthermore, the thermoelectric properties of raw ingot of the PbTe and also of the PbTe-nanowires synthesized by another chemical route retrieved from [27] and [28], respectively, will be used for the sake of comparison with the results of the present study.
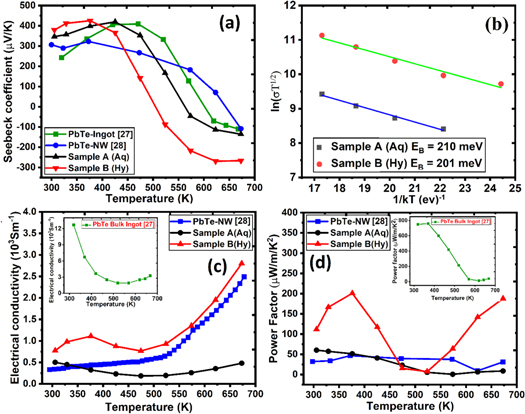
Figure 6. (a) Temperature dependent Seebeck coefficient, (b) variation of ln ( σ T1/2) with 1/kT, (c) Temperature dependent electrical conductivity, and (d) Temperature dependent Power factor.
Download figure:
Standard image High-resolution imageThe SPS'ed discs of PbTe synthesized from both the aqueous chemical (aq) and hydrothermal (Hy) routes exhibited a p-type Seebeck coefficient from RT to ∼500 K as shown in figure 6(a), suggesting that the matrix is Te rich in both the samples. A conversion from p-type to n-type has been observed at ∼550 K for sample A (aq) and at ∼ 500 K for sample B (Hy). Such a behavior is also consistent with the PbTe raw ingot synthesized by conventional melting and quenching or chemical route [27, 28]. The total Seebeck coefficient of a semiconductor with bipolar conduction involving two different types charge carriers is given by,

Where Se , and Sh are the Seebeck coefficients of the two types of carriers, and σ e and σ h are the contributions of the two charge carriers to electrical conductivity. At temperatures below 500 K, the second term in the numerator of equation (2), i.e., (Sh σ h) dominates over the first term leading to a positive Seebeck coefficient in this temperature range. As PbTe is a narrow band gap semiconductor, the number of charge carriers in the conduction band increases progressively with the increase in temperature due to thermal excitation leading to an increase in Se and the first term of equation (1). Consequently, the overall Seebeck coefficient decreases at T > 500 K. The dominance of intrinsic charge carriers at high temperatures is also consistent with the enhanced electrical conductivity at temperatures > 500 K, as evidenced in the lead telluride sample synthesized by hydrothermal method (See figure 6(c). The Seebeck coefficient exhibits a maximum value of 426 μV K−1 at 375 K (Sample B) and 420 μV K−1 at 425 K (Sample A). The values are comparable to the reported values in PbTe synthesized by chemical route (i.e., 322 μV K−1 at ∼ 373 K [28]). It is to be noted that we obtained a significantly enhanced Seebeck coefficient in both types of samples (i.e., Aq & Hy types) compared to the bulk ingot 243 μV K−1 at ∼ 320 K.
Figure 6(c) presents the temperature dependent electrical conductivity of both the samples in comparison with the literature. One can observe the temperature-activated electrical conductivity in both samples which is more intense in the lead telluride sample synthesized hydrothermal method. It was reported by Nolas et al, (2009) that the electrical transport properties of PbTe synthesized by wet chemical route depends upon the surface oxygen adsorption, stoichiometry, and density [29]. The density of our synthesized samples has been measured using the Archimedes method. We hypothesize that the lower density of sample synthesized by the aqueous chemical route is responsible for lower electrical conductivity relative to the sample synthesized by the hydrothermal route. The electrical conductivity of PbTe synthesized by hydrothermal route can be further improved by optimizing the sintering conditions (temperature, time, and pressure). Similar electrical behavior is observed in the nanostructured lead telluride samples synthesized from other wet chemical routes [29, 30]. Such temperature dependence of electrical conductivity can be ascribed to the charge carriers scattering from the potential barriers at crystal interfaces and grain boundaries. The charge carriers with low energies are trapped at grain boundaries, and those having sufficient energy are allowed to pass. The trapping of low-energy charge carriers by grain boundaries is also favorable for improving the Seebeck coefficient. The measurement of room temperature Seebeck coefficient is also in accordance with the hypothesis. The room temperature Seebeck coefficient of sample synthesized by aqueous chemical route is 347 μV K−1, and that of sample synthesized by hydrothermal route is 380 μV K−1, which are significantly enhanced as compared to Seebeck coefficient of bulk PbTe ingot 243 μV K−1 at 320 K [22]. The remarkably enhanced Seebeck coefficient values observed in the present case could be a signature of the carrier filtering effect in our nanostructured samples [31]. The height of the potential energy barrier at crystal interfaces/grain boundaries can be estimated according to the following equation,

Where σ eff is the effective electrical conductivity, k is the Boltzmann constant, T is the absolute temperature, and EB is the height of the grain boundary potential energy barrier. In order to justify this assumption, we have plotted ln( σ T1/2) versus 1/kT in figure 6(b). The linear fit of the data sets confirms the applicability of the carrier filtering model. The height of the potential energy barrier comes out to be ∼ 210 meV in the sample synthesized by the aqueous chemical route and ∼201 meV in the sample synthesized by the hydrothermal route. The calculated height of the potential energy barrier is relatively large in contrast to the energy barrier reported by Scheele et al, EB = 140 meV [32]. These higher values of potential energy barrier are also consistent with the lower electrical conductivity observed in our synthesized samples.
Figure 6(d) presents the temperature-dependent power factor (=S2 σ of the synthesized samples. It can be observed from the figure that the power factor of synthesized samples is significantly lower than the bulk ingot. The power factor of the sample synthesized by hydrothermal route reaches a value of 201 μW m−1 K−2 at a temperature ∼ 376 K, and 188 μW m−1 K−2 at 673 K. However, the power factor of sample synthesized by aqueous chemical route remains low ∼ 60 μW m−1 K−2 at room temperature. The lower power factor in our samples may be attributed to lower values of electrical conductivity due to the scattering of the charge carriers at numerous interfaces. We propose that the decreased electrical conductivity in our samples is not fully compensated by the enhanced Seebeck coefficient. The comparative values of thermoelectric parameters S, σ and κ at three different temperatures i.e., 303 K, 473K and 673K has been shown in table 2.
Table 2. The comparative values of thermoelectric parameters S, σ and κ at three different temperatures i.e., 303 K, 473K and 673K.
| Seebeck coefficient S (μV K−1) | Electrical conductivity σ (S m−1) | Power factor (S2 σ ) (μW m−1 K−2) | Thermal conductivity κ (W m−1 K−1) | Figure of merit (zT =  T) T) | ||||||
|---|---|---|---|---|---|---|---|---|---|---|
| Temp. (K) | A (Aq) | B (Hy) | A (Aq) | B (Hy) | A (Aq) | B (Hy) | A (Aq) | B (Hy) | A (Aq) | B (Hy) |
| 303 K | 346.5 | 379.3 | 501 | 775 | 60 | 111 | 0.96 | 1.43 | 0.015 | 0.025 |
| 473 K | 352.7 | 141.3 | 231 | 875 | 23 | 15 | 0.65 | 0.96 | 0.007 | 0.003 |
| 673 K | −135.7 | −266.9 | 480 | 2800 | 9 | 188 | 0.66 | 0.76 | 0.003 | 0.176 |
The principal benefit of nanostructured materials in comparison to bulk materials is the significant decrease in lattice thermal conductivity. The temperature dependent total and lattice thermal conductivity has been presented in figures 7(a) and (b), respectively.
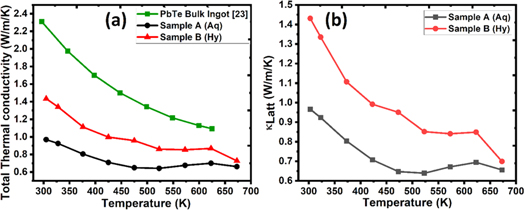
Figure 7. Temperature dependence of the (a) Total thermal conductivity, and (b) Lattice thermal conductivity contribution in the PbTe samples synthesized using two routes (Aq & Hy). A comparison is also made with the data reported on bulk ingot sample of PbTe [27].
Download figure:
Standard image High-resolution imageIt can be readily observed from figure 7, that the thermal conductivity of samples synthesized from both the routes is remarkably reduced in comparison to the thermal conductivity of bulk ingot [27] in the entire measurement temperature range. This result demonstrate successful reduction in the thermal conductivity to ∼38% in the sample synthesized by hydrothermal route and to ∼58% in the sample synthesized by aqueous chemical route when compared to the thermal conductivity of bulk ingot. Furthermore, figure 7 reveals that the total thermal conductivity is close to the lattice thermal conductivity, and it might be attributed to the inferior electrical conductivity of our synthesized samples.
The total thermal conductivity of a material is comprised of two components, i.e., the electronic component ( κ El ) and the lattice component ( κ L ). Further, the electronic component of thermal conductivity is directly proportional to electrical conductivity through Wiedemann–Franz law ( κ El = LσT), where L,σ, and T are the Lorentz number, electrical conductivity, and absolute temperature, respectively. The value of Lorentz number can be estimated from the absolute values of Seebeck coefficient according to the following equation [33],

In the above equation, S is in the units of μV K−1, and L is in 10−8 WΩK−2.
The value of the electronic thermal conductivity is computed from the estimated values of Lorentz number and experimentally measured electrical conductivity values (figure 8(a)). It is directly observed from figure 8(a) that the electronic thermal conductivity increases with the increase in temperature and displays the same behavior as that of electrical conductivity.
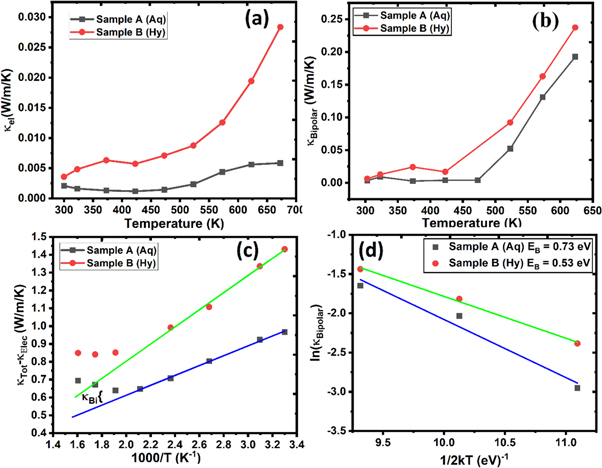
Figure 8. Temperature dependent (a) Electronic component of thermal conductivity, (b) Bipolar component of thermal conductivity, (c) difference of total thermal conductivity and electronic thermal conductivity, and (d) plot of ln ( κ Bipolar) versus 1/2kT.
Download figure:
Standard image High-resolution imageThe electrical band gap of lead telluride is ∼0.3 eV at room temperature [34, 35]. In such a narrow band gap semiconductor, a notable contribution to thermal conductivity comes from bipolar diffusion of charge carriers. This contribution is termed as bipolar thermal conductivity and is found to increase with temperature. Besides an additional contribution to thermal conductivity, such as bipolar effects also lowers the Seebeck coefficient's absolute value and hence are responsible for inferior thermoelectric performance.
The total thermal conductivity is given by,

To estimate the bipolar thermal conductivity, we have used a simple method proposed by Zhao et al, [9].
The lattice thermal conductivity can be approximated as

Where M, V are the average mass and average atomic volume per atom, θD is the Debye temperature, and γ the Gruneisen parameter [10]. At low temperatures, we can approximate the acoustic phonon scattering as the governing mechanism and hence  which is
  The latter is found to be inversely proportional to temperature (see figures 7(b), 8(c)). As the temperature is increased,
  begins to diverge from the linear correspondence between
  and inverse temperature. The value of bipolar thermal conductivity can be computed by extrapolating the linear correspondence between
  and inverse temperature as specified by the solid line marked by blue color (Sample A) and green color (Sample B). The variation of bipolar thermal conductivity with temperature is presented in figure 8(b). It is evident from the figure that the bipolar thermal conductivity becomes considerable at temperatures more than 450 K.
The energy barrier for bipolar diffusion is computed using the relationship between  and temperature,

Where EB is the energy barrier for bipolar diffusion and A is a pre-exponential coefficient. To estimate the energy barrier for bipolar diffusion, we have plotted ln( κ Bipolar) versus 1/2kT for the synthesized samples (figure 8(d)). The linear fitting of the datasets yields an energy barrier value of 0.73 eV for sample B, and 0.53 eV for sample A.
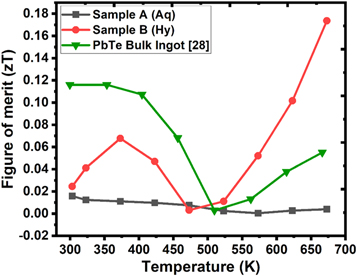
The temperature dependent dimensionless figure of merit has been depicted in figure 9. The figure of merit of PbTe bulk ingot has been retrieved from [27]. Although the power factor of the sample synthesized by the hydrothermal route is relatively smaller than the bulk ingot, the figure of merit is distinctly on the higher side.
Figure 9. Temperature dependent figure of merit of PbTe sample synthesized by aqueous chemical route (black curve), hydrothermal route (red curve) in comparison to the PbTe bulk ingot (green curve).
Download figure:
Standard image High-resolution image
The large value of figure of merit in case of PbTe synthesized using hydrothermal route is due to significantly smaller thermal conductivity in the nanostructured sample. The figure of merit reaches to a maximum value of 0.18 at 673 K in the sample synthesized by the hydrothermal route. On the other side, the dimensionless figure of merit of the sample synthesized by the aqueous chemical route remains low in the entire measurement temperature range owing to its poor electrical properties.
4. Conclusions
In summary, we have reported the structure and thermoelectric transport properties of nanostructured lead telluride samples synthesized by an aqueous chemical method and a hydrothermal method. The as-synthesized nanoparticles were consolidated by using spark plasma sintering. Thermoelectric properties have been measured on the bulk nanostructured samples from room temperature to 700 K. The large values of room temperature Seebeck coefficient in both the samples in contrast to the bulk ingot have been attributed to the carrier energy filtering effect. However, it was found that the enhancement in the Seebeck coefficient could not fully compensate for the decrease in electrical conductivity due to scattering of charge carriers at numerous interfaces. Thermal conductivity is significantly decreased in the nanostructured samples over the entire measurement temperature range leading to a maximum figure of merit of 0.18 at 673 K in the sample synthesized by the hydrothermal route. On the other hand, the sample synthesized by aqueous chemical route shows low crystallinity, higher porosity and the presence of unreacted Te as secondary phase thus leading to relatively lower values of zT. It is to be noted that the present work mainly focusses on the synthesis and thermoelectric properties of undoped lead telluride. It is expected that zTmax values of the nanostructured lead telluride synthesized as in the present work can be further enhanced by process optimization and controlled doping.
Acknowledgments
The authors declare no conflict of interest.
Data availability statement
The data that support the findings of this study are available upon reasonable request from the authors.