
Abstract
A stepwise induction cladding process was studied using both simulations and experiments. Three types of commonly applied alloy powders were coated onto a grey cast-iron substrate. A coupled electromagnetic and heat transfer model is proposed to analyse the stepwise induction cladding process. From the electromagnetic field and heat distribution, it can be clearly seen that the eddy current, which was generated by the alternating magnetic field, was generally distributed within the coating and the thin layer near the substrate surface, which in turn resulted in Joule heating. The simulation results provide a clear picture of the process of an alloyed coating metallurgically bonding to the substrate, which is difficult to observe experimentally. To verify the numerical calculations, experimental studies on induction cladding under the same process parameters as the simulation were performed. The maximum temperatures on the outside surface of the graphite tube and the substrate were in reasonable agreement with the simulation and experimental results. Finally, the characteristic microstructure, porosity, and hardness of the coatings were analysed.
Export citation and abstract BibTeX RIS

Original content from this work may be used under the terms of the Creative Commons Attribution 4.0 licence. Any further distribution of this work must maintain attribution to the author(s) and the title of the work, journal citation and DOI.
Introduction
Induction cladding is a feasible coating fabrication technique that can produce anti-wear and anti-corrosion coatings on metal components. Compared to other surface coating techniques, such as laser cladding [1], arc welding, and microwave cladding [2], induction cladding can fabricate metallurgically bonded coatings at a lower cost and with a considerably higher efficiency as well as provide energy savings and the ability to clad large areas [3].
Many studies in this area have been focused on cladding material compounds [4], cladding process improvements [5], and coating performance [6]. However, there are far fewer investigations concerned with the numerical simulations of the induction cladding process.
Induction cladding is a complex physical and metallurgical process because the temperature depends on the electromagnetic and thermal properties of the material. The temperature profile is a complicated function of the current density, frequency, material characteristics, inductor design, and coupled interactions between multiple physical fields [7]. In addition, owing to limited experiments, the complicated electromagnetic field and temperature profile within the coating and substrate are difficult to measure directly. Furthermore, the cladding coating has a unique microstructure and phase composition generated by non-equilibrium solidification, which in turn has a strong effect on the coating performance. Therefore, research on mathematical models that accurately describe induction cladding will provide a clear picture and deep understanding of the induction-clad coating formation mechanism, help optimise the process parameters, and consequently improve the coating quality. Sadeghipour [8] numerically simulated the induction heating of a steel billet and obtained the transit power density and temperature field. Maten [9] established a two-dimensional model that included the relative movement between the inductor and the specimen and simplified the boundary conditions. Chaboudez [10] built a three-dimensional model of induction heating and compared numerical simulations and experiments. Shokouhamand [11] investigated the effect of the rotation speed, dielectric (air) space, and inductor design on the temperature field distribution during the induction heating process of sleeve-shaped parts. The hardening depths and residual stress evolution during the inductive hardening process of low-alloyed steel were predicted using a multiphysics finite-element method (FEM). The sensitivity of important parameters related to the material properties on the simulation results was analysed [12]. The self-consistent boundary value problem of electrodynamics and thermal conductivity was considered in a numerical simulation study of the induction heat treatment of titanium disks [13]. Liu [14] investigated the temperature field distribution in an induction cladding process by fabricating a Ni-based coating on a cylindrical rod. The deviation between the numerical calculation and the experiments was less than ±25 °C, verifying the reliability of the numerical model. Sun [15] modelled an alloyed layer coated on a steel plate using induction cladding and investigated the relationship between the process parameters and the melting area. From the literature review above, it is clear that most numerical investigations have focused on the induction heating process of a single material, and there are limited numerical studies on the coating fabrication process using induction cladding.
The aim of this work is to numerically analyse and experimentally study the stepwise induction cladding of coatings on a cylindrical grey cast-iron substrate. In order to improve the accuracy of numerical analysis, a complete geometric model in real experimental case was built, and the complex heat transfer conditions and boundaries were taken into account. Three types of commonly used alloy powders were used as coating materials. The electromagnetic field and temperature profile were calculated using the FEM software COMSOL5.2, and the numerical model was calibrated by the experiments. The characteristic microstructure, porosity, and hardness of the coatings obtained under the same process parameters as those used in the simulation were investigated.
Experimental procedures
Experimental materials and setup
Nickel-based, iron-based, and cobalt-based alloy powders (developed by the Shenyang Rare Metal Institute, China) were selected as the coating materials, and cylindrical bars of HT 300 grey cast iron were used as the substrates. The chemical composition and properties of the materials are listed in table 1.
Table 1. Chemical compositions (wt.%) of selected materials.
| C | Cr | Fe | Ni | Si | Co | Mn | W | Mo | Nb | B | |
|---|---|---|---|---|---|---|---|---|---|---|---|
| Ni 60 | 0.02 | 4.90 | 0.15 | Bal. | 1.80 | — | — | — | — | — | 0.72 |
| Fe 105 | 0.77 | 17.00 | Bal. | 8.00 | 1.20 | — | 0.40 | — | 1.80 | 0.5 | — |
| Co 158 | 0.75 | 24.64 | 0.98 | 10.44 | 0.40 | Bal. | 0.29 | 7.53 | — | — | — |
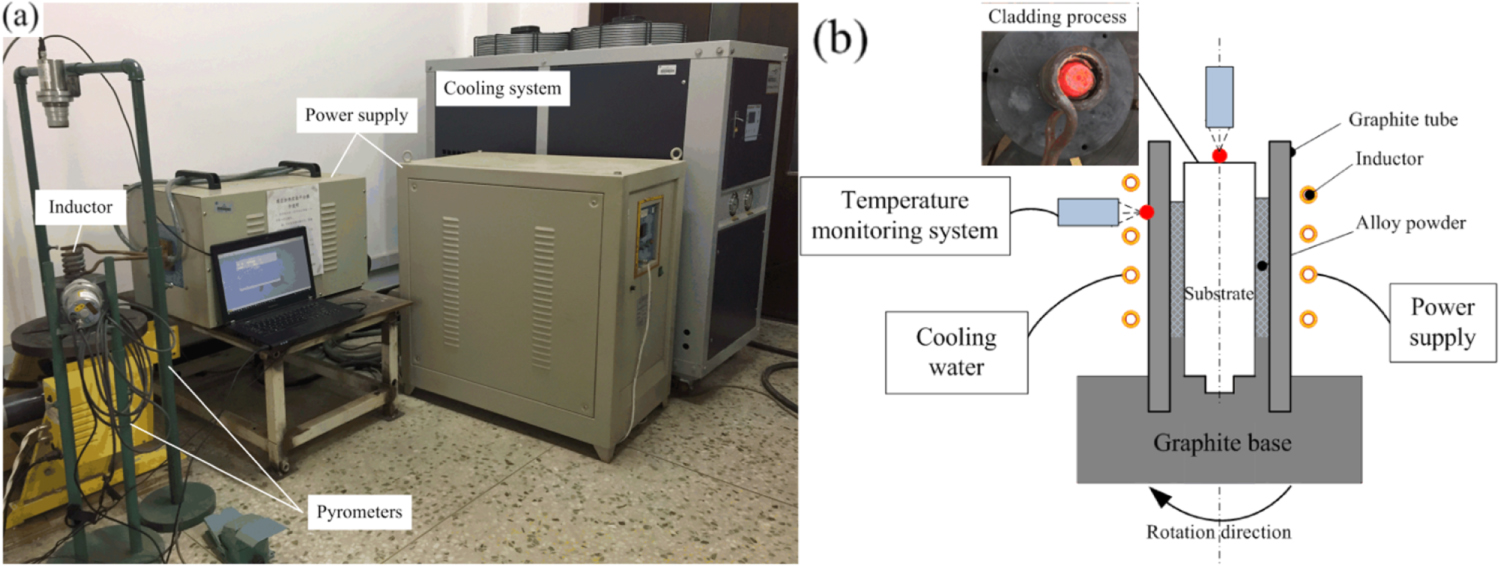
The experimental studies were performed on a custom-built induction cladding apparatus, which contained three main components: the power supply (maximum current of 150 A; maximum frequency of 40 kHz), cooling system, and rotary platform. A cylindrical bar of HT 300 grey cast iron was placed inside a hollow graphite tube at the centre of the rotary platform, and the alloy powder was placed in the gap between the graphite tube and the substrate. A copper inductor with circulating cooling water was placed around the graphite tube to supply the electromagnetic field, as shown in figure 1. Two infrared temperature pyrometers (Keller, Germany) with measurement ranges of 250 °C–2000 °C (PA 30FA2) and 500 °C–2500 °C (PA 30FA2) were employed to measure the temperature at the top end of the substrate and the outside surface of the graphite tube, respectively. The emissivity of the graphite tube and substrate is set as 0.8 and 0.4 respectively. Based on our previous studies, the stepwise induction heating process can fabricate a high-quality coating [16]. The optimized process parameters for the different coatings are listed in table 2.

Figure 1. Picture and schematic of the experimental apparatus.
Download figure:
Standard image High-resolution imageTable 2. Experimental parameters.
| Preheating | Heating 1 | Heating 2 | ||||
|---|---|---|---|---|---|---|
| Sample | Current/A | Time/s | Current/A | Time/s | Current/A | Time/s |
| Ni-based coating | 10 | 90 | 20 | 90 | 30 | 9 |
| Fe-based coating | 10 | 90 | 20 | 11 | 10 | 30 |
| Co-based coating | 10 | 90 | 20 | 90 | 30 | 30 |
Coating characterisation
The specimen coated with the alloy layer was cut along the cross-sectional direction using an electrical discharge machine (EDM). The detailed sample-cutting approach is depicted in figure 2. The metallographic specimens were polished with 180–1500 grit sandpaper, then polished with diamond powder, and finally eroded with an alcohol solution containing 4% nitric acid (volume fraction). The microstructure of the coating was observed using optical microscopy (OM, GX 51, Olympus, Tokyo, Japan) and scanning electron microscopy (SEM, Supra 55 Sapphire).
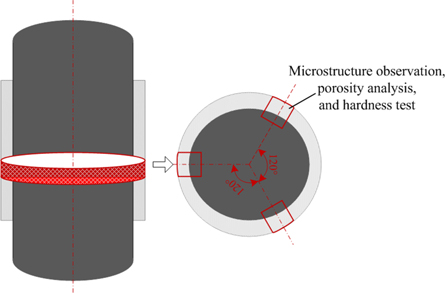
Figure 2. Schematic of specimens used to investigate coating properties.
Download figure:
Standard image High-resolution imageThe porosity of the coating was quantitatively defined as the ratio of the pore area to the field image area [17]. The images acquired using OM were processed using Image J software. To improve the measurement accuracy, ten images were randomly selected for each specimen.
The microhardness in the transverse section of the coatings was measured using an HX-200 Vickers microhardness tester (LW-HV 1000, Beijing Lewei Wulian Science and Technology Co. Ltd, China) with a load of 200 g for 10 s, and a point was measured every 50 μm.
Mathematical and numerical modelling of the induction cladding process
Calculation object and domain
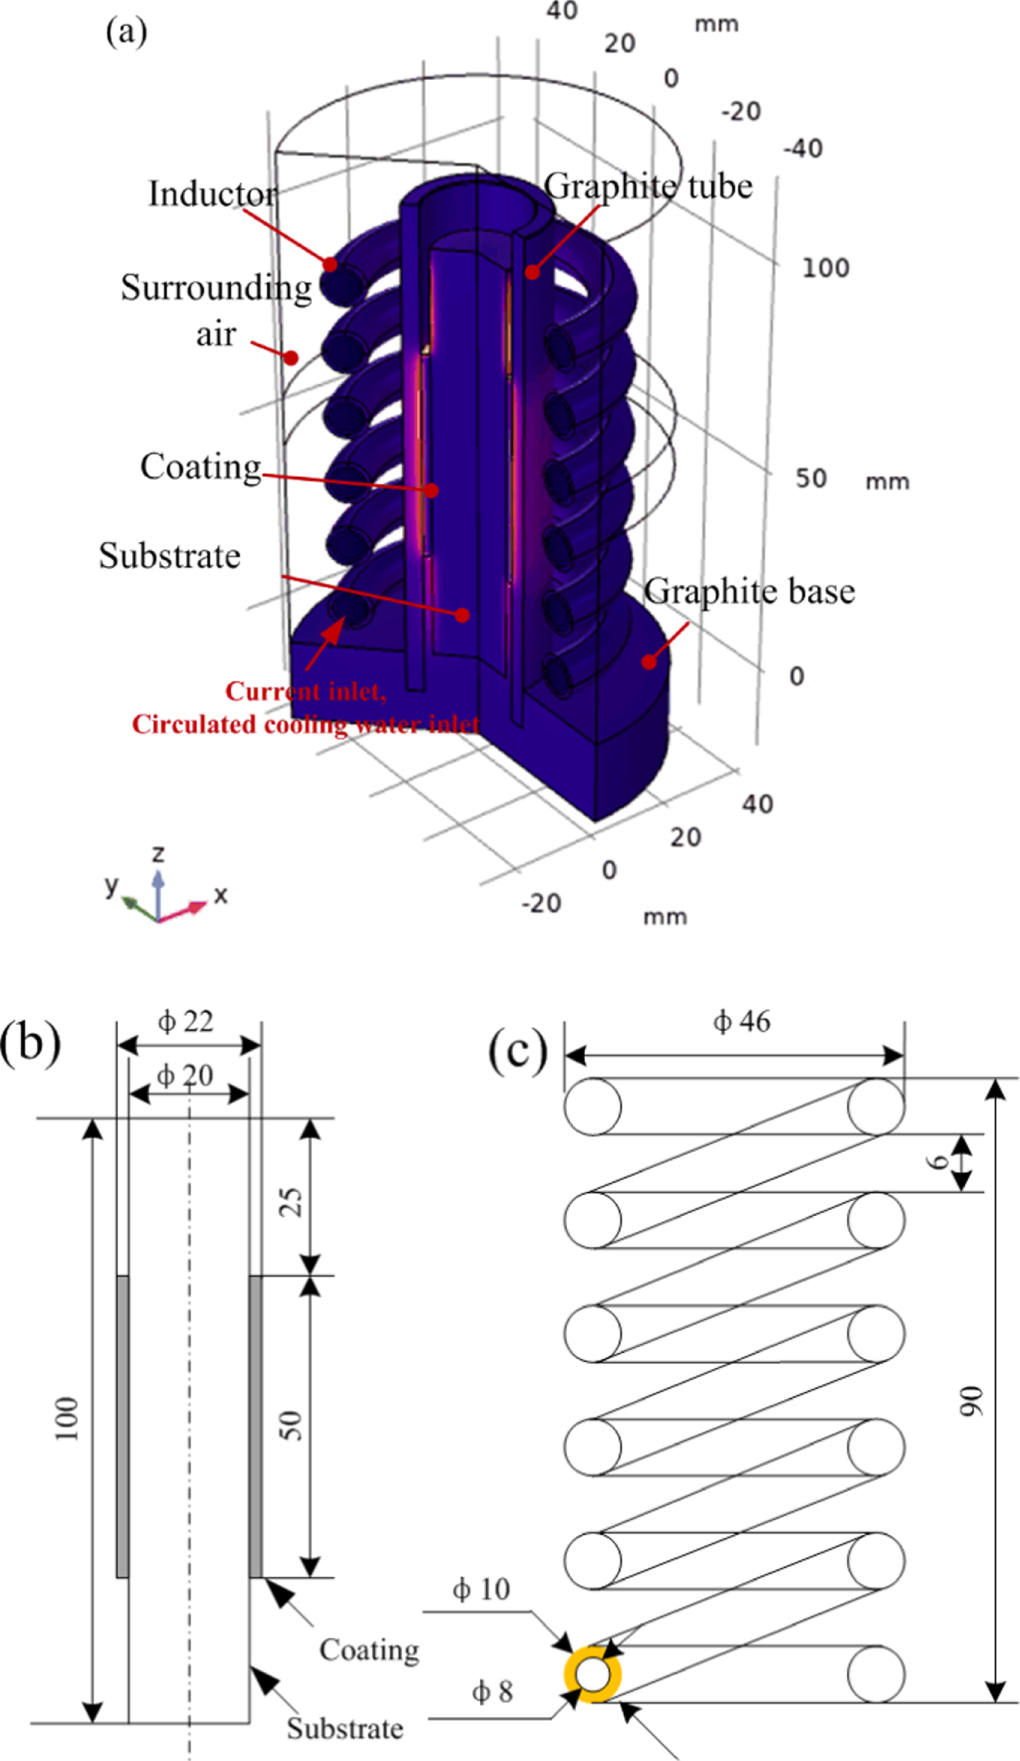
A rotating axisymmetric geometry based on the experimental layout is shown in figure 3(a). The substrate was a cylindrical rod with a diameter of 20 mm and height of 100 mm. The thickness and height of the coating were 1 mm and 50 mm, respectively (see figure 3(b)). The graphite base rotated during the entire simulation process. The inductor was a hollow copper coil with circulated cooling water flowing in it. The geometric parameters of the inductor are shown in figure 3(c). The calculation domain was a cylinder with a diameter of 80 mm and a height of 150 mm, and its boundary was also the electromagnetic and temperature field boundary.

Figure 3. Schematic of (a) the calculation model and domain, and the dimensions of the (b) coating sample and (c) copper inductor.
Download figure:
Standard image High-resolution imageBasic assumptions
- (1)Two-dimensional modelling is adequate for the rotational symmetry calculation object and domain [7].
- (2)The helicity of the spiral inductor is ignored and depicted by a single-turn coil, whose number is equal to that of the experimentally applied inductor [18].
- (3)For the coating materials, some property parameters of the bulk material are used instead of those of the corresponding alloy powder.
- (4)The movement of the graphite base and the above parts are considered in the boundary condition.
- (5)The heat generated by the hysteresis loss and displacement current is not considered in the model because the frequency of the current used in most induction heating applications is lower than 10 MHz.
Governing equations/mathematical model
The basic principles of induction cladding involve the electromagnetic field and heat transfer. The theoretical background of the mathematical and numerical model is briefly presented in this section.
Maxwell equations:


where E and H are the electric field intensity and magnetic field intensity, respectively, and B and J are the magnetic flux density and current density, respectively.
Constitutive equations used to solve Maxwell equations:


where  and
and  are the magnetic permeability and electrical conductivity, respectively.
To compute the magnetic induction, we use a magnetic vector potential (A) and an electric scalar potential ( ) to express the magnetic and electric fields.


The electromagnetic field equation can be rewritten as

Based on the Joule heat effect, the coating and substrate are heated by the eddy current induced by the electromagnetic field. The temperature evolution within the coating and substrate can be expressed as follows:

where ρ, c, and k are the material density, specific heat, and thermal conductivity, respectively. The heat source during coating fabrication is the eddy current on the right side of equation (8).
Boundary conditions and other settings:
- (1)The boundary of the electromagnetic field was set to zero magnetic vector potential, while the air boundary of the temperature field was room temperature. The bottom surface of the graphite base was assigned a coefficient of thermal conductivity of 50 W/(m2·K).
- (2)The cooling water flow in the copper inductor was circulated by a pump, and the temperature of the water flow was maintained at 12 °C during the entire experimental process. The value of forced convective cooling on the inner surface of the inductor was selected to be 10, 000 W/(m2·K) [13].
- (3)The relative rotating speed of the specimen was approximately 10 r/min, the external surface of the graphite tube was subjected to natural convection with air [19], and the air temperature was room temperature.
- (4)The Curie point of most alloyed powder material is approximately 200 °C, and in the initial stage of induction heating, the heating temperature of the coating exceeded 200 °C very quickly. Therefore, ferromagnetism is not considered in this model.
The thermally dependent material parameters of the coating and substrate were obtained using JMAT-pro software and from the literature [15].
The coupled electromagnetic and heat transfer model was directly solved using the FEM software COMSOL5.2. COMSOL employs an unstructured grid to mesh the geometric model. The size of the surface mesh in the graphite base, substrate, inductor, and air ranged from 1.17 to 0.0167 mm, while the size of the surface mesh in the graphite tube and coating varied from 0.279 to 8.33 × 104 mm. To improve computation efficiency while retaining computational accuracy, auto mesh refinement (AMR) was also used.
Numerical results
From the electromagnetic distribution and temperature field shown in figure 4, it can be seen that the eddy current generated by the alternating electromagnetic field was mostly distributed in the coating and a thin surface layer based on the skin effect [20]. The penetration depth of the eddy current was approximately equivalent to the coating thickness. In contrast, the current density in the substrate was extremely low. In turn, owing to the Joule heating effect, the coating and the thin layer of the substrate were heated during an extremely short time. Consequently, the alloy coating was metallurgically bonded to the substrate.
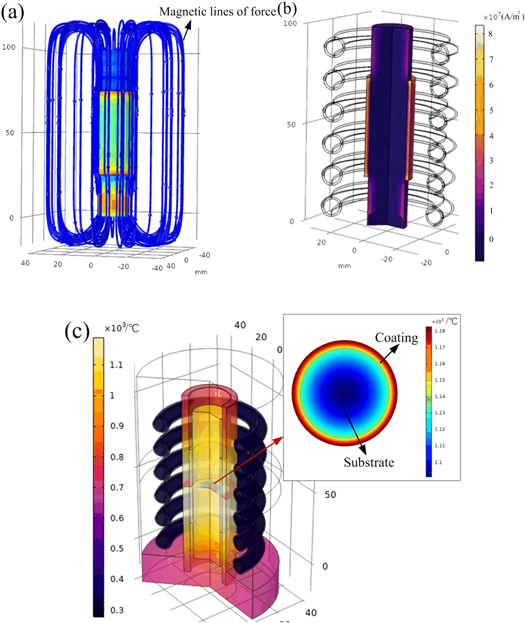
Figure 4. (a), (b) Electromagnetic distribution and (c) temperature field of the Ni-based alloy coating.
Download figure:
Standard image High-resolution imageThe temperature distributions at various times are shown in figure 5. During the initial heating stage, most of the electromagnetic energy was concentrated within the coating; thus, the temperature of the coating increased. As induction heating proceeded, the maximum temperature moved towards the interface between the coating and substrate, and consequently, the bottom end of the coating was heated as well, which was the main heating source for metallurgical bonding. As the heating time increased, the heat in the coating gradually transferred to the substrate, causing the temperature in the substrate to increase. The temperature profile of the substrate appears to be high because of the small diameter of the substrate. In practical applications, the size of the workpiece is considerably larger than the coating thickness; therefore, the inductive heat will have a minimal impact on the substrate.

Figure 5. Temperature evolution of the Ni-based alloy coating.
Download figure:
Standard image High-resolution imageThe temperature profiles of the outside surface of the graphite tube and at the top end of the substrate are shown in figure 6. It can be seen that the highest temperatures from the simulated and measured results were in good agreement. The temperature profile of the substrate was in good agreement in terms of the curved shape, while there were some differences between the simulated and measured temperature profiles of the outside surface of the graphite tube. It can be observed that the calculated maximum temperature of the graphite tube was 109 °C higher than the experimental result. The predominant factor in the divergence was that during the induction cladding, the tested point on the outside surface of the graphite tube rotated with the graphite base, while the measured point on the substrate was considered to be fixed. Moreover, two peaks occurred near the highest temperature range in the graphite tube in the simulated results, which was the latent heat, indicating that the phase transformation occurred in a short period of time during induction cladding. In addition, the thermometer failed to detect this melting process owing to measurement error and the rotating test point. Furthermore, it can be noted that the maximum temperature at the interface was higher than that of the graphite tube (approximately equal to the outside surface of the coating because of the high heat conductivity of graphite. The highest eddy current density occurred at the interface between the coating and the substrate, resulting in the highest Joule heating at the interface. In addition, the melting point of Ni-based alloy powder is 960 °C–1040 °C, and that of grey cast iron is approximately 1400 °C; thus, induction cladding can achieve the temperature required for fabricating a coating that is metallurgically bonded to the substrate surface. The computed and measured maximum temperatures of the three types of alloy coatings are listed in table 3. It is noted that the relative simulation error ranges from 8.9% to 0.84%, which approximates the analytical results obtained by Liu [21]. This shows that the simulated results are in good agreement with the experimental results, indicating that the proposed coupled model is suitable for induction cladding applications.
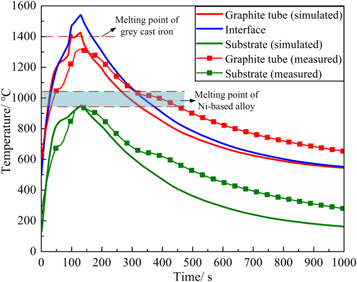
Figure 6. Comparison of the simulated and experimental temperature profiles (Ni-based coating sample).
Download figure:
Standard image High-resolution imageTable 3. Maximum temperatures of the outside surface of the graphite tube and substrate.
| Ni-based | Fe-based | Co-based | ||||
|---|---|---|---|---|---|---|
| Graphite tube | Substrate | Graphite tube | Substrate | Graphite tube | Substrate | |
| Simulated/°C | 1426 | 952 | 1320 | 926 | 1327 | 936 |
| Measured/°C | 1317 | 944 | 1583 | 973 | 1389 | 956 |
| Relative simulation error/% | 7.64 | 0.84 | 8.9 | 5.08 | 4.67 | 2.14 |
Experimental results
The photographs in figure 7(a)–(c) show the samples with induction-clad coatings. The surfaces of the Ni- and Co-based coatings were much smoother than that of the Fe-based coating. The molten Fe-based alloy powder solidified inhomogeneously on the surface of the outer wall, and a small amount of the molten Fe-based alloy leaked onto the substrate surface. For the Co-based coating, slight melting occurred at the bottom section of the substrate. Figure 7(d)–(f) present SEM images of the microstructure near the coating surface, where block-like, acicular, and short rod-like microstructures were distributed in the top layer of the Ni-based alloy coating [22]. The microstructure of the Fe-based alloy coating presented a network-like block structure and black particles dispersed in the light grey region [6]. The microstructure of the Co-based coating contained dark grey irregular-shaped blocks and white dendrite-like features distributed in the light grey matrix.
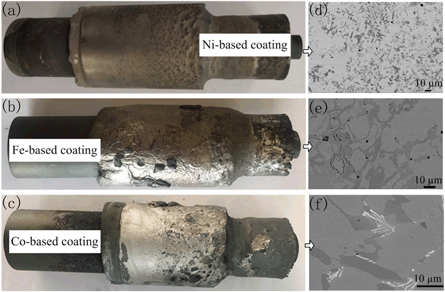
Figure 7. Photographs and microstructures of induction-clad coatings.
Download figure:
Standard image High-resolution imageThe characteristic morphologies and porosities of the coatings are shown in figure 8; several pores were scattered within the coatings. The average porosity values of the Ni-, Fe-, and Co-based alloy coatings were 0.63%, 0.35%, and 0.18%, respectively, which are close to those of laser-clad coatings (typically less than 1%) [23]. The two main reasons for the pore generation in the coating are as follows: (1) the molten liquid alloy cannot fill the voids created due to the volume shrinkage of the melting alloy powder; and (2) the remaining gas in the alloy powder does not escape during solidification of the liquid alloy.
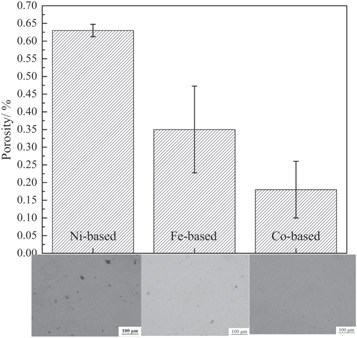
Figure 8. Characteristic morphologies of the coatings and their porosity.
Download figure:
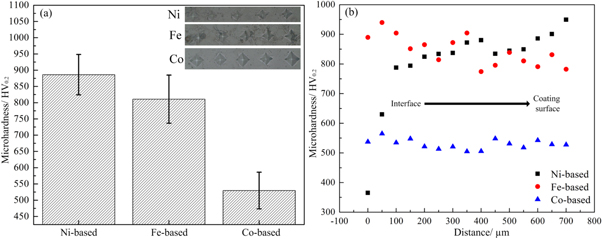
Standard image High-resolution imageThe average Vickers hardness values of the coating surface and cross-sectional microhardness profiles are shown in figure 9. The hardness values of the Ni-, Fe-, and Co-based alloy coatings was approximately 886, 811, and 530 HV0.2, respectively. Moreover, the inset in figure 9(a) shows indentations on the coating surface, which illustrates that the Co-based alloy coating possessed a lower hardness than those of the Ni- and Fe-based coatings owing to the relatively larger indentation area. The microhardness of the Ni- and Fe-based alloy coatings varied more dramatically than that of the Co-based alloy coating along the direction from the interface between the coating and substrate to the coating surface, as shown in figure 9(b). The results show that the Co-based coating had a considerably more even distribution of microstructure and phase composition along the thickness of the coating [6].
Figure 9. Vickers hardness of (a) the coating surface and (b) along the cross section.
Download figure:
Standard image High-resolution image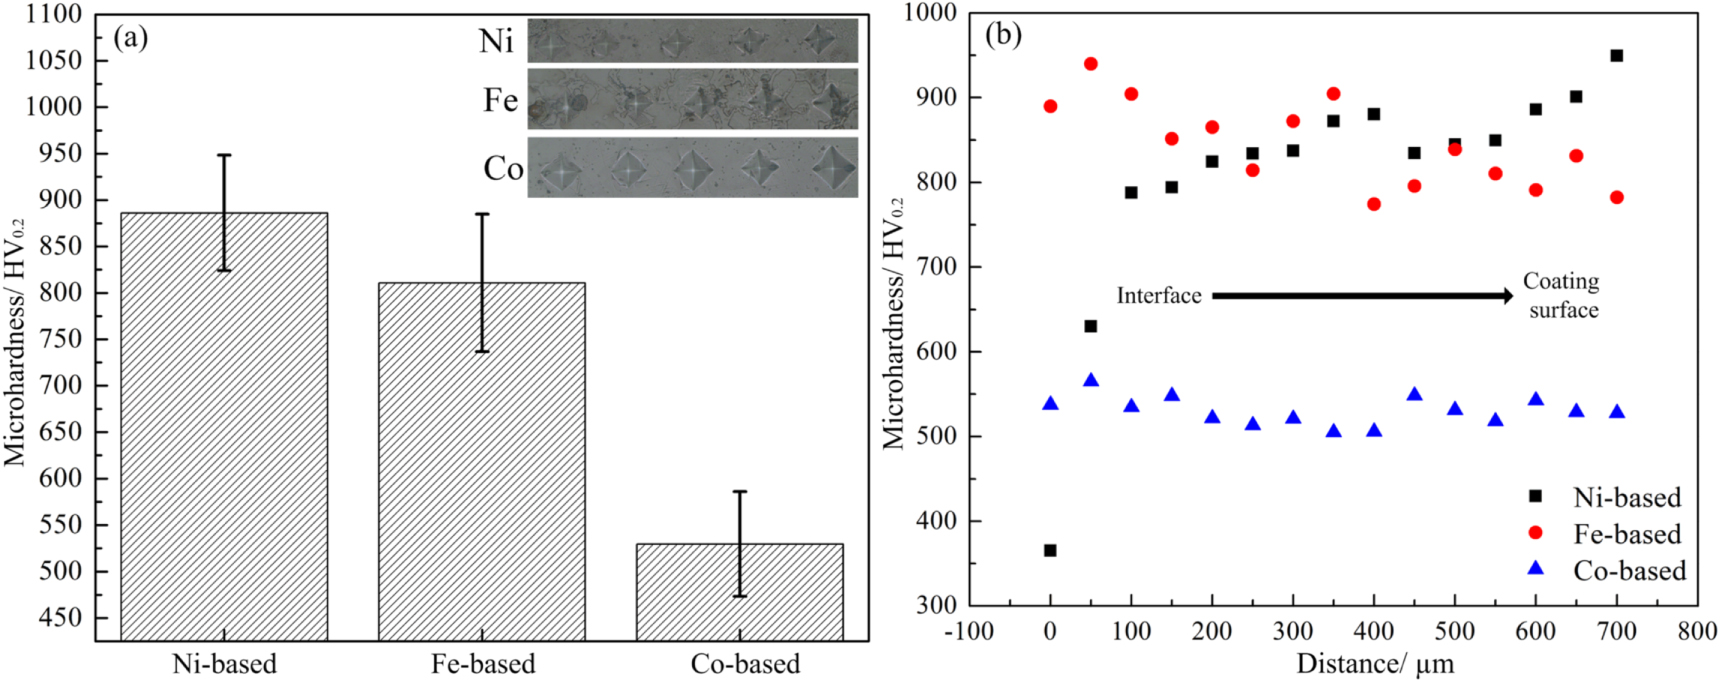
1. Conclusions
- (1)A coupled electromagnetic and heat transfer model was developed to provide a deep understanding of the induction cladding process. The dominant heating source in a coating metallurgically bonded with the substrate is derived from Joule heating and the skin effect.
- (2)The relative error between the maximum temperatures obtained by the simulation and those measured by the infrared pyrometer varied from 0.84 to 8.9%. This indicates that the simulation model was in good agreement with the physical experiments.
- (3)Using the same process parameters as in the numerical analysis, three types of alloy powders were coated onto the substrate. The morphologies of the three types of alloy coatings were noticeably different. The average porosities of the Ni-, Fe-, and Co-based alloy coatings were 0.63%, 0.35%, and 0.18%, respectively. The mean values of Vickers hardness of the Ni-, Fe-, and Co-based alloy coatings were 886 HV0.2, 811 HV0.2, and 530 HV0.2, respectively.
Acknowledgments
The authors appreciate the financial support from the National Natural Science Foundation of China (grant number 51605066), Liaoning Province Natural Science Foundation (grant number 2020-HYLH-22), Chinese Postdoctoral Science Foundation (grant number 2020M670734), Fundamental Research Funds for the Central Universities (grant number 3132019366) and Large Instruments and Facilities Shared Foundation of Dalian Maritime University.
Data availability statement
All data that support the findings of this study are included within the article (and any supplementary files).