
Abstract
The current investigation evaluated the service life and characteristics of fusion-bonded epoxy (FBE) and liquid epoxy coatings applied on ST37 substrates to determine the optimal properties for the inner coatings of the drill pipes in the practical operating conditions. For this purpose, various mechanical tests of flexibility, hardness, adhesion resistance, impact resistance, and wear resistance along with corrosion tests of salt spray, acid immersion, and impedance tests were employed. The mechanical test results verified that FBE coating with 88 Shore D hardness and 25 MPa adhesion strength had the lowest weight loss during the wear test and provided the most desirable mechanical properties among the liquid coatings. Furthermore, the FBE sample was found to have the maximum flexibility and the highest impact resistance. The corrosion test results revealed that the FBE sample had the lowest corrosion rate, which can offer extended durability for the internal coating of the drill pipes. The results also showed that the higher compactness of the FBE coating structure, as well as the lower permeability against the penetration of aggressive agents, were the primary factors accountable for the superior service life.
Export citation and abstract BibTeX RIS

Original content from this work may be used under the terms of the Creative Commons Attribution 4.0 licence. Any further distribution of this work must maintain attribution to the author(s) and the title of the work, journal citation and DOI.
1. Introduction
Drill pipes are the most important and widely used equipment for drilling the oil and gas wells, which their main task is to transfer various fluids such as drilling mud, acid, and saltwater into/out of the well. Drill pipes are prone to corrosion due to the presence of corrosive agents such as CO2, H2S, drilling mud salts, and organic acids of the crude oil [1, 2]. These factors usually cause localized corrosion, especially pitting of the drill pipe surfaces. Strong fluid stream and abrasion corrosion at the damages areas can cause formation of the porosities at the pipe surface. The destruction of the pipes during the drilling process leads to the costs of the replacement and system shut down in addition to heavy damages due to loss of the equipment inside the well [1–3].
Yan et al [4] investigated the causes of a drill pipe failure during the well drilling operation after 210 h operation which results showed that the main reason for the failure was sulfide stress corrosion cracking. Cobo et al [5] investigated corrosion of the rotors with hard-chromium coating in drilling mud. The results showed that hard-chromium coatings protect the steel surface as long as no surface defects exist in the coating. However, corrosion occurs due to the surface damage and contact of the corrosive fluid with the metal surface since the coatings do not provide sacrificial protection. The surface defects occur for various reasons such as improper preparation of the substrate and mechanical damage of the coating during operation [6–9]. Klapper et al [10] investigated the pitting corrosion of the austenitic stainless steels in a simulated drilling environment. The polarization test results demonstrated that by decreasing pH, elevating the temperature, and increasing the chlorine concentration pitting severity increased. Chudyk et al [11] investigated the corrosion of drill pipes in contact with drilling fluids. The results exhibited the occurrence of pitting corrosion on the surface of the specimens. Besides, presence of chlorine ion was identified as the basic cause of corrosion, which its concentration in the service environment had a significant effect on the corrosion rate. Evaluation of references revealed that although work has been done on corrosion and destruction of metal bodies of drilling pipes, but a few research has been done on the destruction of internal coatings, which is one of the main causes of pipe destruction.
The use of epoxy coatings is a cost-effective technique to protect metals in the corrosive environments. These coatings act as a physical barrier against corrosive agents caused by their high cross-linking density [12–15]. However, the presence of defects in the coating because of processes such as corrosion of substrate, blister, and cracking caused by mechanical damage, develops a local corrosion cell leading to reduction of adhesion of the coating and eventually coating breakdown [16–20]. Among epoxy coatings, there are two groups of liquid and powder coatings that powder coatings surpassed liquid coatings due to applied easily by faster speed and and noticeable reduction of wasted material [13, 17, 21, 22]. Malik et al [23] investigated the mechanical and corrosion behavior of FBE coatings in an aqueous medium. The results showed that FBE coatings had high adhesion and flexibility and no delamination or cracking was observed during the tests. Also, the coatings remained intact after autoclaving and salt spray tests, and no trace of scaling, discoloration, thickness reduction, or stickiness was observed. Mobin et al [22] investigated the service life of FBE coatings for water transfer conditions. The coatings were placed in three different environments for 10 months and then were subjected to electrochemical impedance and adhesion strength tests. The electrochemical impedance results showed that for all coating samples prolonging the immersion time did not have a significant effect on the coatings resistance. Besides, increase of chlorine ion levels in the medium did not have a considerable effect on the service life of the samples. The results of Husain et al [21] experiments showed that powder coatings are resistant to corrosion and destruction in different environments. Furthermore, Pandis et al [24] investigated the corrosion resistance of polymer coatings enriched by zinc and iron. The results confirmed the high corrosion resistance of the coating specimens in highly acidic media. The most desirable corrosion resistance was obtained for a type of epoxy coating, in which the resin and hardener were enriched with zinc. In general, despite the importance of the drill pipe internal coatings in the oil and drilling industries, to date no detailed study has been carried out on the analysis of the mechanism of degradation of these coatings, which emphasizes the necessity of a comprehensive investigation into this field. In recent years, several studies have been conducted on epoxy composite coatings using micro and nanoparticles in the matrix of the epoxy resins to improve their service life [25, 26]. Although a few recent studies confirmed the superior resistance of epoxy composite coatings to the conventional types, the widespread use of these coatings in the industrial applications has remained impossible due to the high cost. Therefore, it is essential to investigate the degradation mechanisms, estimate the lifespan, and determine the risk of using conventional coatings [3, 27, 28].
Considering the high importance of inner coatings of the drill pipes for protecting and increasing the efficient service life of the pipes, it is vital to study and compare the protective properties of the coatings, so as to select and characterize coatings with higher durability. The purpose of this study was to investigate the degradation mechanisms of inner coatings of drill pipes. Furthermore, it was attempted to compare the mechanical and chemical properties of the FBE coating to the liquid coatings in drill pipe applications and to determine the performance and efficiency of these coatings for protecting the inner surfaces of the drill pipes.
2. Materials and method
2.1. Sample preparation
FBE and liquid epoxy coatings were applied on ST37 steel substrates. The specifications of the applied coatings are given in table 1. Prior to the application, the specimens were subjected to sandblasting to remove any surficial oxides or contaminations, degreased with acetone, and dried in oven. For sticking solid particles on substrate and reaction of resin and hardener component of powder, the specimens were heated at 200 °C for 20 min. The powder coating was sprayed on the surface of the preheated samples to a thickness of 200 μm. After application of the coating the samples were heated at 220 °C for 15 min for curing. Figure 1 shows the DSC diagram of the applied coating before and after the curing. It is evident that the glass transition temperature difference was 0.25 °C, which is ideal according to the ISO 21809-2 standard. The samples dimensions and the thickness of the substrates were selected according to the ASTM standards of each test.
Table 1. Specifications of different applied coatings.
| Param | Coating #1 | Coating #2 | Coating #3 | Coating #4 |
|---|---|---|---|---|
| Sample | FBE | TC2000 | TK34 | WT200 |
| Type | FBE | Liquid epoxy | Liquid epoxy | Liquid epoxy |
| Resin | Novolac | Phenolic | Phenolic | Novolac |
| Color | Gray | Yellow green | Blue green | Brown |
| Applied Thickness | 180 ± 10 μm | 180 ± 10 μm | 180 ± 10 μm | 180 ± 10 μm |
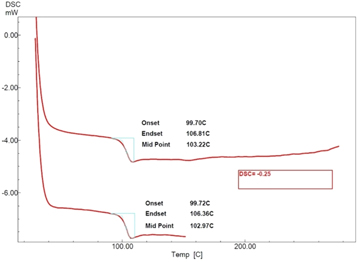
Figure 1. DSC diagram of FBE coating applied, before and after processing.
Download figure:
Standard image High-resolution image2.2. Mechanical tests
2.2.1. Pull-off adhesion test
The Pull-off test was performed by Elcometer 108 machine to examine the adhesion of coatings to the substrate according to ASTM D4541 standard. To perform the test, three coated sample for each coating type with dimensions of 200 × 100 mm2 was used and the average of results is reported.
2.2.2. Hardness measurement
The hardness of the coating specimens was measured according to ASTM D2240 standard using a Teclock G-710 durometer. Coated specimens with dimensions of 200 × 100 × 3.2 mm3 were used for the hardness test. The hardness was measured at five different spots of the coating surface and the mean value was reported.
2.2.3. Wear test
The wear test was performed based on ASTM D4060 standard with Erichsen 317 abrasion resistance tester based on earlier investigations [29–31]. During the test, the coated samples with dimensions of 100 × 70 × 3.2 mm3 were subjected to 1000 wear cycles. From each coating type three replicate samples were tested and the average value was calculated and reported.
2.2.4. Flexibility test
A conical mandrel tester was used to evaluate the flexibility according to ASTM D522 standard. For the test, three coated specimens from each coating type with dimensions of 150 × 100 × 0.5 mm3 were used.
2.2.5. Impact resistance test
To perform the impact test three specimens for each coating type with dimensions of 150 × 100 × 3.2 mm3 according to ASTM D2794 standard were subjected to a coating impact test machine, (Erichsen model 304). The impact height increased gradually until the crack was observed in the coating that determined the impact resistance of the coating (figure 2). The impact site was examined by both a magnifying glass and a Testech DJ-6 leak detector (figures 2(b) and (c)).
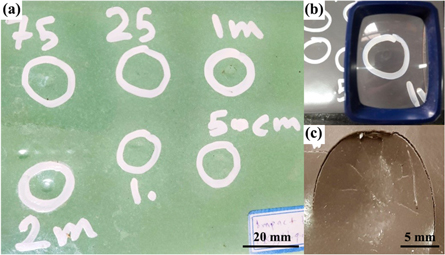
Figure 2. (a) Coated sample after impact test, (b) Check the location of impact with a magnifying glass and (c) Cracking at the impact site in the WT200 coat.
Download figure:
Standard image High-resolution image2.3. Corrosion tests
2.3.1. Electrochemical impedance spectroscopy
The electrochemical impedance spectroscopy (EIS) test was carried out to evaluate the service life of coatings and their corrosion resistance. The experiments were performed using a Potentiostat/Galvanostat EG&G Model 273 A in 3.5 wt% NaCl solution. During the experiments, an Ag/AgCl reference electrode, and a platinum auxiliary electrode were utilized and the coated sample was connected as the working electrode. The frequency range and the amplitude were selected 0.01–100,000 Hz and ±50 mV, respectively.
2.3.2. Salt spray test
According to ASTM B117 standard, the salt spray test was performed on specimens with dimensions of 150 × 100 × 3.2 mm3 using a Gotech device model GT-7004 in 5 wt% NaCl solution at 37 °C for 1000 h. From each coating type five samples were prepared; one with a X-shaped scratch and the rest were intact. At the end of the test, the specimens were gently washed with distilled water and dried immediately.
2.3.3. Acid immersion test
Substrates with the dimensions of 100 × 50 × 3.2 mm3 were coated and immersed in 28% hydrochloric acid solution. From each coating type five samples were prepared; one with an X-shaped scratch and the rest were intact. The samples were kept in contact with the acidic solution for 1000 h. At the end of the test, the specimens were gently washed with distilled water and dried immediately.
2.4. Microstructural characterization
The surfaces of the coatings and the cross-sections of the coating and the substrate were examined using a scanning electron microscope (SEM) (Tescan model VEGA-II) equipped with energy-dispersive x-ray spectroscopy (EDS) analysis.
3. Results and discussion
3.1. Adhesion test
Figure 3(a) shows the results of pull-off adhesion tests for different specimens. According to the results, the FBE coating specimen was the only one which, was not delaminated by the maximum force applied to the dolly. This confirmed that the strength of the substrate/coating interface was higher than the dolly/coating interface, indicating a bonding strength higher than 25 MPa. For samples TK34 and TC2000, the was separated at the dolly/coating interface, indicating that the adhesive strength was not sufficient for the pull-off to occur, i.e. the maximum bonding strength was higher than 15 MPa, which was also ideal. The adhesion strength of sample WT200 was measured about 8 MPa, indicating that the bonding strength at the coating/substrate interface was lower than that of other coatings.
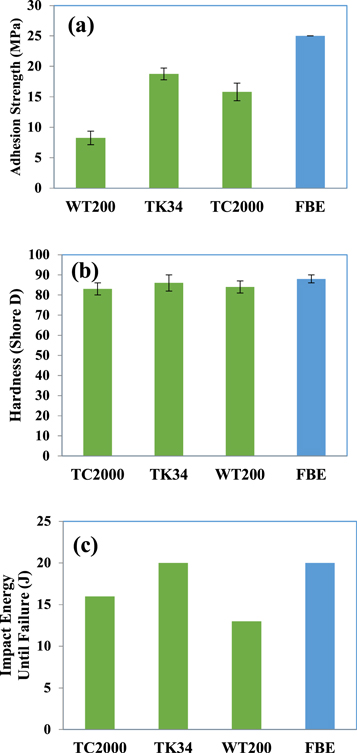
Figure 3. (a) Pull-off adhesion test results, (b) Hardness test results and (c) Impact resistance test results of different coatings.
Download figure:
Standard image High-resolution image3.2. Mechanical properties
3.2.1. Hardness
The hardness of the samples was measured by Shore D scale and the results are displayed in figure 3(b). According to the figure, it is clear that samples TC2000 and WT200 had a similar hardness close to 83 Shore. TK34 specimen had a hardness of 86 Shore and FBE sample had the maximum hardness of 88 Shore.
3.2.2. Impact resistance
Figure 3(c) illustrates the impact test results, in which no cracks were observed in the FBE and TK34 coatings under the highest applied energy (20 J). Samples TC2000 and WT200 were cracked and failed under lower impacts and showed impact resistance of 16 and 13 J, respectively. It should be noted that the minimum permissible impact resistance in ISO 21809-1 [32] is 2 J, which is met by all samples.
3.2.3. Flexibility test
Figure 4a shows the conical mandrel tester during the test. After the bending test, the specimens were examined visually and no cracking or delamination was evident on the surface of coatings (figure 4(b)) that proved the proper flexibility of all coatings. Additionally, the test results showed that sheets and coatings with the thicknesses of 0.5 mm and 200 μm can resist high bending strains without failure.
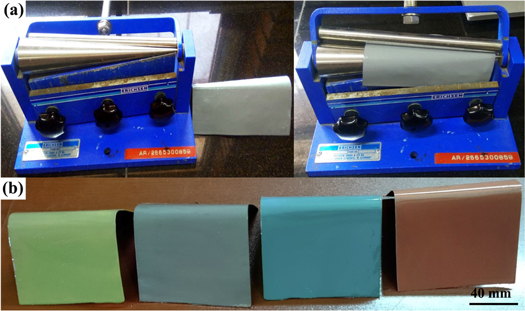
Figure 4. (a) Cone mandrel device for measuring flexibility and (b) Image of four coating samples after the flexibility test.
Download figure:
Standard image High-resolution image3.2.4. Wear test
Figure 5(a) shows the weight loss results of the coated samples during the wear test. According to the figure, it can be seen that the FBE coating had the lowest weight loss (45 mg) and in the second place sample TK34 with a weight loss of 67 mg had the most desirable wear resistance. However, the weight loss values of WT200 and TC2000 were higher and exceeded 236 and 330 mg, respectively. This inconsistency in the weight loss results can be attributed to the dissimilarity of the density and hardness of the coatings (figure 3(b)), so that samples FBE and TK34 had a lower weight loss compared to WT200 and TC2000 coatings due to denser structure and higher hardness [23]. Based on previous studies, the hardness of the surface can highly affect the wear resistance, thus denser coatings have a better wear resistance [33, 34]. Figures 5(b)–(d) reveal the SEM micrographs of the coating worn surfaces. As can be seen, parallel abrasion grooves are visible in all specimens, indicating that the wear mechanism was abrasive wear for all specimens. Given that the wear mechanism was the same for all specimens, it can be concluded that samples with lower weight loss had better wear resistance.
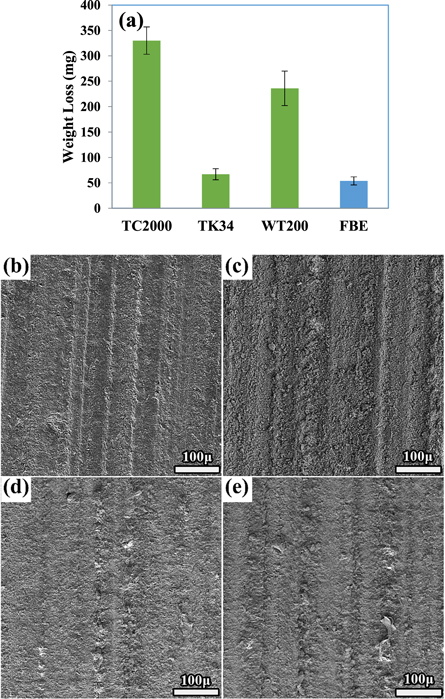
Figure 5. (a) Comparison of weight loss of coatings after applying 1000 wear cycles and SEM microghraph of the worn surface of coatings, (b) FBE, (c) TK34, (d) TC2000 and (e) WT200.
Download figure:
Standard image High-resolution image3.3. Corrosion tests
3.3.1. Salt spray test
Figure 6(a) shows the surface of the scratched specimens after the salt spray test. The scratch site was created deliberately to check the corrosion degree if the liquid penetrates under the coating. The FBE and TK34 coatings still had high adhesion at the scratch site and the coating was not removed easily by the load. In TC2000 and WT200 coatings, a local delamination occurred at the scratch site and corrosion products were observed on the substrate under the coating, which represented the penetration of the solution under the coating. Scratch-free samples were used to study the changes in adhesion strength as well as the discoloration and scaling. The salt spray results are shown in table 2. Every 250 h, one of the samples was removed from the tester and subjected to a pull-off adhesion test. Table 3 demonstrates the change in the surface adhesion of the coatings due to the salt spray exposure. The coating surfaces after the adhesion test is shown in figure 6(b). The adhesion variation trend of different coatings during the test is shown in figure 7. According to the results, the adhesion reduction occurred for all coatings, but the decreasing trend was more severe for the liquid coatings. Despite the reduction in adhesion, the FBE coating still showed an excellent adhesion strength of about 20 MPa after 1000 h salt spray.
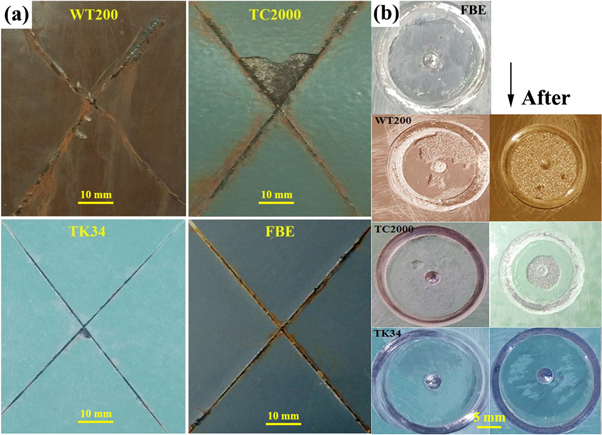
Figure 6. (a) The surface of epoxy coatings after the salt spray test and (b) The surface of the coatings at the adhesion test site before and after 1000 h of salt spray test.
Download figure:
Standard image High-resolution imageTable 2. Salt spray test results for the coated samples.
| Sample | Color change | Delamination of the coating at the scratch site | Progression of corrosion at the scratch site |
|---|---|---|---|
| FBE | — | — | — |
| TK34 | Minor | Very minor | — |
| TC2000 | Visible | Localized | Medium |
| WT200 | Visible | Localized | Minor |
Table 3. The effect of salt spray process on the adhesion tests.
| Pull-off strength (MPa) | Dolly separation site | |||
|---|---|---|---|---|
| Sample | Before the test | After the test | Before the test | After the test |
| FBE | Higher than 25 | 19.89 | None | Dolly |
| TK34 | 18.75 | 9.27 | Dolly | Partial delamination of the coating |
| TC2000 | 15.80 | 4.66 | Partial delamination of the coating | 50% delamination of the coating |
| WT200 | 8.23 | 2.51 | 50% delamination of the coating | Complete delamination of the coating |
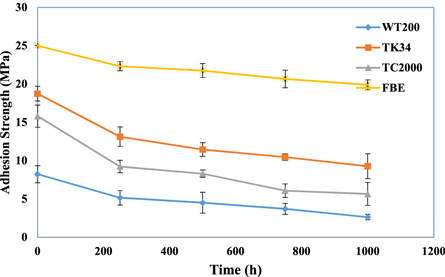
Figure 7. Trend of changes in adhesion strenght of coatings after a salt spray test.
Download figure:
Standard image High-resolution image3.3.2. Acid immersion test
Figure 8(a) shows the surface of the scratched specimens after the acid immersion test in 28% hydrochloric acid. FBE and TK34 coatings displayed high adhesion at the scratch site and the coating was not removed easily by the load. In TC2000 coating, a full delamination occurred at the scratch site and corrosion products were observed under the coating, which implies the penetration of the solution under the coating. In the WT200 coating, local delamination of the coating occurred at the scratch site and corrosion occurred under the coating. Scratch-free samples were used to investigate the changes in adhesion strength as well as the occurrence of discoloration, thickness reduction, blistering, and scaling. The test results are shown in table 4. Every 250 h, one of the coating specimens was removed from the tester and a pull-off adhesion test was performed on it. Table 5 shows the change in the surface adhesion of the coatings due to the acid immersion test. Also, the coating surfaces of the after the adhesion test is shown in figure 8(b). The change in adhesion of different coatings during the acid immersion test is shown in figure 9. Similar to the salt spray test, the results confirmed the adhesion reduction for all coatings, which was more severe than that of the salt spray test. It should be noted that the decreasing trend was more severe in liquid coatings, but for FBE coating, despite the decrease in adhesion after 1000 h, the adhesion strength remained above 15 MPa. Due to the compact structure, the low permeability of FBE coating prevents the penetration of water and aggressive ions to the substrate surface, which maintains the adhesion of the coating [21].
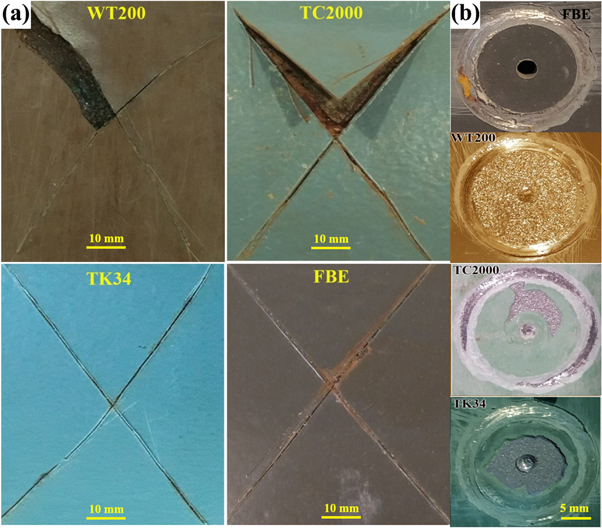
Figure 8. (a) The surface of epoxy coatings after immersion test in 28% hydrochloric acid and (b) The surface of coatings at the adhesion test site after 1000 h of immersion in 28% hydrochloric acid.
Download figure:
Standard image High-resolution imageTable 4. Results of immersion test in 28% HCl solution for the coated specimens.
| Sample | Color change | Delamination of the coating at the scratch site | Progression of corrosion at the scratch site |
|---|---|---|---|
| FBE | Partial | — | — |
| TK34 | Partial | — | — |
| TC2000 | Visible | High | High |
| WT200 | Visible | High | High |
Table 5. The effect of acid immersion process on the coatings adhesion.
| Pull-off strength (MPa) | Dolly separation site | |||
|---|---|---|---|---|
| Sample | Before the test | After the test | Before the test | After the test |
| FBE | Higher than 25 | 16.45 | None | Dolly |
| TK34 | 18.75 | 6.11 | Dolly | 50% delamination of the coating |
| TC2000 | 15.80 | 2.94 | Partial delamination of the coating | 50% delamination of the coating |
| WT200 | 8.23 | 1.69 | 50% delamination of the coating | Complete delamination of the coating |
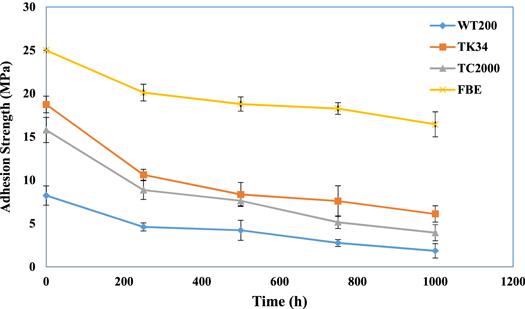
Figure 9. Trend of changes in adhesion strenght of coatings during acid immersion test in 28% hydrochloric acid.
Download figure:
Standard image High-resolution image3.4. Examination of the coatings during practical conditions
Despite the decent service life of the FBE coating during the mechanical and corrosion tests, it was examined in operating conditions. For this purpose, internal surfaces of six drill pipes were coated and employed in practical drilling operations.
3.4.1. Comparison of the lifespan of the drill pipe coatings
Six drill pipe samples with FBE internal coating were connected two different drilling rigs and their efficiency was checked during periodic inspections. Normally, the ideal lifespan of the inner coating of drill pipes in terms of drilling depth is between 30,000 to 40,000 m. The results were attained by visual inspection of 638 drill pipes in the two drilling rigs. After reviewing the results, the average lifespan of the coatings in the drilling rigs was calculated. The average lifespan of the applied FBE coatings was 36,200 m, which was 105% longer than TC2000 (17,623 m) liquid coatings. The service lifespans were determined based on the results of periodic inspections followed by DS1 standard. According to the DS1 standard, if more than 30% of the surface of the inner coating is destroyed, the pipe is considered unserviceable. According to the results, the average lifespan of TC2000 coatings was less than 20,000 m and in some cases it was even less than 10,000 m. Figure 10 shows a typical view of the inner surface of the drill pipes, which shows the destruction of liquid coatings during the drilling operations.
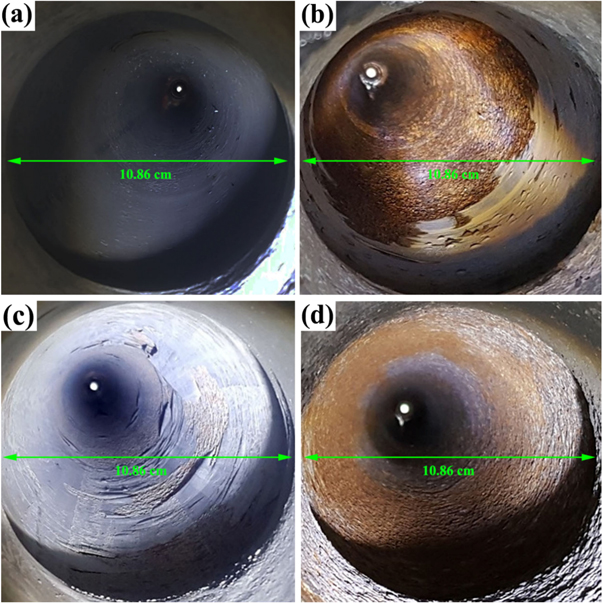
Figure 10. Images of epoxy coatings for drilling pipes: (a) FBE coating, (b) to (d) TC2000 coating.
Download figure:
Standard image High-resolution image3.4.2. Microscopic and surface examinations
To compare the efficiency of FBE coating used in operating conditions, a coated drill pipe specimen was cut after drilling 18120 m. Figure 11(a) and b shows the SEM micrograph of the FBE coating surface and the cross-sectional area of the coating/drill pipe wall interface. No surface defects, cavities or cracks were observed in FBE coating. High compactness and low porosity of the coating is evident in the SEM micrographs. EDS analysis of the surface under the coated samples is shown in figure 11(c). The analysis was similar to the one of steel substrate and no trace of oxygen or other corrosion factors were detected. The novolac epoxy resin of FBE coating has multiple epoxide groups in its structure, contribute to its high cross-linking density, which results in excellent thermal, chemical, and solvent-resistance properties [35].
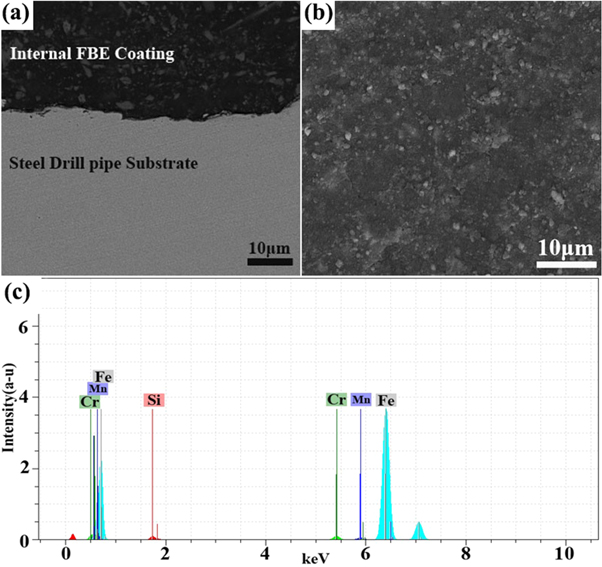
Figure 11. SEM microghraph of: (a) FBE inner coat surface of drilling pipe, (b) Cross-sectional area of FBE coat and drilling pipe after 18120 m of drilling and (c) EDS analysis of the interface of FBE inner coating and substrate after 18120 m drilling.
Download figure:
Standard image High-resolution image3.4.3. Surface adhesion test results
Figure 12 shows the decrease in adhesion strength with prolonging the service hours for the FBE and TC2000 coatings. According to the diagram, after 18120 m of drilling although the adhesion of FBE coating decreased, the reduction was much lower than that of TC2000 coating and the adhesion strength was still acceptable. This confirmed the results of microscopic observations and EIS tests and it can be said that in comparison to liquid coatings the higher compactness and absence of surface defects in the powder coating protects the substrate form penetration of water and corrosive ions. This prevents the occurrence of corrosion and results in lower reduction in adhesion strength.
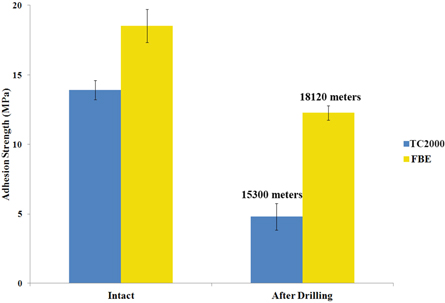
Figure 12. Comparison of changes in adhesion strength of liquid and powder inner coatings.
Download figure:
Standard image High-resolution imageThese results pointed to the importance of adhesion as a critical factor in determining coatings lifetime. When cracks appear on the surface of the coating, the rapid water and ions penetration and the gradual deterioration of epoxy coating structure are stimulated by each other, which will result in accelerating the failure of the internal coating [36–38]. However, FBE coatings have shown excellent corrosion resistance, low water absorption, and good adhesion properties, and these properties qualify them as a suitable choice for internal coating [22, 23].
3.4.4. Electrochemical impedance test results
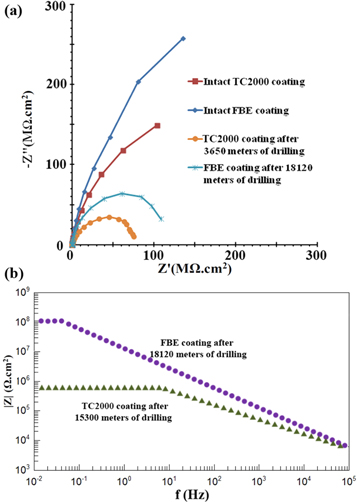
Figure 13(a) shows the Nyquist diagrams of the drill pipes specimens coated by FBE and TC2000 coatings, which were immersed in 3.5 wt% NaCl solution before and after the drilling operation. Although the FBE coating was employed for a longer drilling time, its corrosion resistance was noticeably higher. The Rp value of the FBE coating after 18120 m of drilling was equal to 1.36 × 10⁸ Ω.cm2, which was considerably higher than that of TC2000 specimen and showed full protection of the substrate. In addition, the Bode diagrams of FBE and TC2000 samples in figure 13(b) confirms that the impedance value of FBE coating is higher than that of liquid coatings, despite the fact that it was used for longer service hours.
Figure 13. (a) Nyquist diagrams of internal surfaces of drilling pipes with TC2000 and FBE coatings before and after operation and (b) Bode diagrams of coatings after operation.
Download figure:
Standard image High-resolution image
According to the tests results of the samples extracted from drill pipes with different working hours, it was determined that by increasing the drilling time, defects such as cavities and surface cracks were gradually formed and propagated. The formation of these defects reduces the corrosion resistance of the coatings. The defects expose the metal surface under the coating to the penetration of water and corrosive ions of the drilling fluids and they are considered as corrosion susceptible areas for the drill pipe [39]. They are also greatly reduce the adhesion of the coating to the pipe surface and make the coating delamination easy. However, in denser FBE coatings, the possibility of defects growth and fluid penetration into the coating greatly reduced that improves the lifespan of the component [25, 40].
Normally, coating resistance decreases with exposure time, and in most cases, this process accompanies by water or/and corrosive ions diffusion through the coating and subsequent electrochemical reaction at the interface between the coating and the substrate [24, 25].
4. Conclusions
In the current study, the mechanical properties and corrosion behavior of fusion-bonded epoxy (FBE) and three commercial liquid epoxy coatings (TC2000, TK34, and WT200), which were applied on ST37 substrates were investigated.
The pull-off test showed that the adhesion strength of FBE coating was higher than 25 MPa, while the adhesion strengths of TK34, TC2000, and WT200 coatings were 18, 15, and 8 MPa, respectively. Moreover, the hardness measurement results confirmed that FBE and TK34 coatings had the highest hardness of 88 and 86 Shore, respectively. On the other hand, the hardness of TC2000 and WT200 coatings were almost equal to 83 Shore. The flexibility test results approved that none of the coatings were cracked during the test. The impact tests verified that no crack was observed in FBE and TK34 coatings under the highest applied energy (20 J). The TC2000 and WT200 liquid coatings were cracked and failed under lower energy values of 16 and 13 J, respectively.
The wear test results indicated that for all coatings, the abrasion wear was the dominant mechanism, and the FBE and TK34 coatings had the lowest weight loss of 45 and 67 mg), respectively. Weight loss values of WT200 and TC2000 coatings were determined to be 236 and 330 mg, respectively.
The salt spray test results displayed that FBE and TK34 coatings at the scratch site still had high adhesion strength. For the TC2000 and WT200 coatings, partial delamination occurred at the scratch site, and corrosion products were observed under the coating. It was found that although the decrease in adhesion strength occurred for all coatings, the decreasing trend was more severe for liquid coatings. Despite the reduction in adhesion, the FBE coating maintained its adhesion strength to 20 MPa after 1000 h salt spray. Furthermore, after the acid immersion test, a decrease in adhesion strength was evident for all coatings, which was more drastic than that of the salt spray tests. Similarly, the decreasing trend was more significant for the liquid coatings, but for the powder coating (FBE), the adhesion strength remained above 15 MPa after 1000 h of the test.
Microscopic examinations of the FBE coating applied to the inner surface of the drill pipes under operating conditions showed that despite the longer service hours of the coating than the liquid coatings, there were no surface defects visible in the sample. Additionally, the EIS test results validated that the higher corrosion resistance of FBE coating applied on the inner surface of the drill pipes compared to that of the liquid coatings. Slower degradation in contact with drilling fluids, along with the more compact structure and lower permeability of FBE coating resulted in a much lower rate of adhesion reduction during the operations compared to the liquid coatings that confirmed the higher efficiency of FBE coating for drill pipe applications.