
Abstract
Biomass fuel from plant waste is an important substitute for fossil fuels. The odorous volatile organic compounds (VOCs) is released during the drying process of biomass, which causes harm to the ecological environment and human health. The α-pinene is a typical odorous VOC generating during plant waste drying. Ternary nanocatalyst composed of TiO2, FexOy and MOk (M = Mn, Co, Ce) was manufactured by ultrasonic assisted hydrothermal process. The α-pinene catalytic oxidation property of ternary nanocatalysts were investigate in a dielectric barrier discharge reactor assisted by nonthermal plasma. The pore structure parameters of ternary nanocatalysts were observed qualitatively and analyzed quantitatively by transmission electron microscopy (TEM) and N2 adsorption test, respectively. The phase composition and active element valence of these three kinds nanocatalysts were analyzed and compared by X-ray diffraction (XRD) and X-ray Photoelectron spectroscopy (XPS). The test data showed TiO2-FexOy-CoOk ternary nanocatalyst had more complete microporous and mesoporous pore structure, better element dispersion and stronger redox performance. Meanwhile, TiO2-FexOy-CoOk sample had the best performance with α-pinene catalytic conversion achieving 83.3% and CO2 selectivity higher than 90% at specific energy density (SED) of 620 J·l−1, which was almost half of the energy consumption of single non-thermal plasma catalytic reaction during the nonthermal plasma-catalyst (NTP-C) synergistic catalytic activity experiments. At the same time, the ternary nanocatalysts could obviously reduce the generation concentration of O3 and NOx in the process of α-pinene catalytic oxidation. The synergy effect between TiO2, FexOy and CoOk was better than that of TiO2, FexOy and CeOk or MnOk. It could be expected as an effective method to improve the redox performance of ternary nanocatalysts by optimizing the microstructure and elemental composition, which would also be a promising way to enhance odorous VOCs catalytic oxidation efficiency and reduce the energy consumption in the NTP-C synergistic catalytic system.
Export citation and abstract BibTeX RIS

Original content from this work may be used under the terms of the Creative Commons Attribution 4.0 licence. Any further distribution of this work must maintain attribution to the author(s) and the title of the work, journal citation and DOI.
1. Introduction
Terpenes are kinds of natural hydrocarbon widely existing in vegetation, which can be released by many kinds of plants, vegetables and fruits. According to statistics, the total number of known terpenoids is more than 22000 [1]. Terpenes are typical Volatile organic compounds (VOCs) generating during biomass fuel drying process, and are considered as one of the main sources of odorous VOCs [2]. As important components of air pollutants, VOCs have become the focus of the atmospheric environment research all over the world [3–5]. Many VOCs have special odors, which will not only affect the ecological environment, but also cause people's strong discomfort and endanger human health seriously [6–8]. Reducing the content of terpenes has important ecological significance and social value [9].
A variety of methods have been used to remove high concentrations of VOCs from exhaust gases, including adsorption [10], thermal oxidation [11], catalytic oxidation [12] and photocatalysis [13]. Traditional removal methods are not suitable for the removal of VOCs with low concentration. Because the overall catalytic efficiency of traditional technology does not reach the active window under low concentration of VOCs, which leads to the sharp increase of the cost for VOCs degradation per unit concentration [14]. Thus, it is necessary to develop alternative technologies to make up for the defects of traditional technologies, which can successfully remove low concentration VOCs from biomass fuel drying. Nonthermal plasma (NTP) technology provides an advanced method for VOCs elimination efficiently [15, 16]. Oxygen and other oxidants produced by plasma can oxidize low concentration VOCs from biomass. However, the generation of highly reactive and toxic by-products, such as O3 and NOx , is considered to be a problem in the process of VOCs removal using NTP technology [17]. O3 is the most undesirable by-product in NTP exhaust gas emission, which has thermal stability above 250 °C [18]. The residual O3 can damage facilities and harm to human health, due to its strong oxidizing property [19].
Using catalyst combined with NTP catalytic reactor to eliminate VOCs can decrease the undesired by-products which usually generates during NTP catalysis alone. The concentration of O3 formation has a close relation with the catalyst position in NTP catalytic reactor. On the basis of relative location between catalyst and discharge zone, it can be divided into two types: the catalyst locating in discharge zone as a one-stage system, referred to as in plasma catalysis (IPC), and the catalyst locating at the discharge zone downstream as a two-stage system, referred to as post plasma catalysis (PPC) [20]. PPC technology has higher performance in O3 removal [21].
In PPC process, various types of catalyst supports are widely used to remove VOCs, such as zeolite [15], TiO2 [22], SiO2 [23] and Al2O3 [24]. Meanwhile, many different kinds of active metal elements have been introduced as the main active materials of catalysts for VOCs catalytic oxidation completely, such as precious metal elements of Pt [25], Pd [26], Au [27], Ag [28], and transition metal elements of Mn [29], Fe [30], Co [31], Ni [32] and Cu [33]. These active metal elements are used as doping components in catalysts to offer extra catalytic active sites [34–36]. Iron, as the cheap metal, is used as impregnated materials for VOCs removal desirably. However, its practical application is limited to vehicle and factory due to the high temperature window of VOCs catalytic reaction. The high cost of operating temperature limits the applicability of Fe-based catalysts to reduce low concentration VOCs [37]. In this regard, PPC technology combined with Fe-based catalysts has potential application prospects in the removal of low concentration VOCs from biomass fuel drying.
At the same time, the composite catalysts of nano-sized metal oxide particles have shown excellent performance in catalytic degradation of VOCs [38–41]. Fe-based metal oxide (Fe3O4 [42], Fe2O3 [43]) composite nanoparticles were used as suitable adsorbents to remove humic acid and other types of VOCs from the environment. Under visible light irradiation, the degradation rate of FeMgAl spinel nanoparticles for direct blue 129 reached 94% [44]. Nano Mn-Zn metal oxide particles showed high photocatalytic activity for congo red dye degradation in aqueous solution at room temperature, 96% of congo red degraded within 15 min [45]. Mn-Mg spinel nanoparticles photocatalytic degrade 95% of reactive blue 21 degraded within 60 min in aqueous solution at room temperature [46].
With the increasingly stringent requirements of environmental protection, the green method of synthesizing nanocatalyst has also been deeply studied. The green sol-gel method is used to synthesize nano composite materials with advantages of non-toxic, economical, time-consuming and environment-friendly [47]. Moradnia used green sol-gel method to prepare spinel MgFeCrO4 magnetic nanoparticles with baicalin gel, providing a natural and cheap sol-gel method [48]. Taghavi prepared CoCr2O4 cubic spinel nanoparticles by green sol-gel method [49]. Using water instead of organic solvents to achieve green and sustainable chemical processes has always been one of the goals of green chemistry, and it is also a challenging topic for chemists [50]. Raizada prepared silver doped Bi2O3/g-C3N4 nano-catalyst by hydrothermal method for the photocatalytic degradation of imidacloprid [51]. The degradation rate of imidacloprid reached 93%, showing significant recoverability and stability in 10 catalytic cycles. Through a simple one-step hydrothermal method, Mohammadi successfully designed an effective heterogeneous nano-catalyst by immobilizing WO4 2- on the surface of carbon quantum dots (CQDS) [52]. Compared with the traditional electric heating, the reaction time of ultrasonic radiation synthesis of nanoparticle materials is much shorter, and provides better particle size and morphology control [53, 54]. Ultrasonic treatment has influence on the morphology and size of the obtained nanoparticles [55–57]. The nanomaterial of FeS2-Bi2O3 prepared by ultrasonic assisted hydrothermal method exhibited a high degradation efficiency for phenytoin sodium under UV irradiation, with the degradation rate reaching 97.5% after 50 min [58].
In this study, in consideration of the economic feasibility, we prepared ternary mixed-oxide nanocatalyst with TiO2, Fex Oy and MOk (M = Mn, Co, Ce) by ultrasonic assisted hydrothermal method, and established a nonthermal plasma-catalyst (NTP-C) synergistic catalytic system in PPC method to remove α-pinene, a kind of typical VOCs species releasing during biomass fuel drying process. By comparing the removal efficiency of α-pinene, the catalytic selectivity of CO2 and the by-product generation concentrations of O3 and NOx in the NTP-C synergistic catalytic system, the VOCs catalytic properties of ternary mixed-oxide nanocatalysts under different specific energy density (SED) were evaluated.
2. Materials and Methods
2.1. Catalysts preparation
The ternary mixed-oxide nanocatalysts were manufactured by ultrasonic assisted hydrothermal process. Fe(NO3)3·9H2O (99.9%, analytically pure, Macklin, Shanghai, China), Co(NO3)2·6H2O (99.99%, analytically pure, Macklin, Shanghai, China), Ce(NO3)3·6H2O (99.9%, analytically pure, Macklin, Shanghai, China) and Mn(NO3)3·6H2O (98%, analytically pure, Macklin, Shanghai, China) were used as precursors of iron oxides, cobalt oxides, cerium oxides and manganese oxides, respectively. The nano-TiO2 particles was generated from the precursor of Tetra-butyl ortho-titanate (TBOT). Fe(NO3)3·9H2O and Co(NO3)2·6H2O were dissolved into deionized (DI) water orderly at ambient temperature. Under the condition of ultrasonic wave and continuous magnetic stirring, appropriate amount of ethanol was added to the mixture. The stainless steel autoclave with poly tetra fluoroethylene (PTFE) lining was heated at 175 °C for 12 h. Subsequently, the autoclave was cooled to the environment temperature, and TBOT was added to the above mixed solution drop by drop and stirred continuously under the action of ultrasonic wave, until the precipitation was formed. Aging again in autoclave at 175 °C for 4 h. Finally, the mixture was collected after repeated centrifugation and washing. The precipitates were desiccated at 135 °C for 10 h, and calcined at 450 °C for 3.5 h under air flow. The prepared nanocatalysts were ground and sieved for VOCs catalytic reaction test and physicochemical characteristics analysis. The nanocatalyst sample with molar ratio of Fe:Co:Ti = 1.5:1.0:17.5 was expressed as TiO2-Fex Oy -CoOk . The TiO2-Fex Oy -CeOk or TiO2-Fex Oy -MnOk nanocatalyst was prepared by using Ce(NO3)3·6H2O or Mn(NO3)2·6(H2O) instead of Co(NO3)2·6H2O, respectively, as shown in table 1. As comparison samples, binary mixed-oxide catalysts of Fex Oy -CoOk , Fex Oy -CeOk , Fex Oy -MnOk were also prepared in the manner described above but not included TBOT.
Table 1. The molar ratios and mass ratios of metal elements in ternary mixed-oxide nanocatalysts.
| Samples | Ti molar ratio | Ti mass ratio | Fe molar ratio | Fe mass ratio | M molar ratio | M mass ratio | Notes |
|---|---|---|---|---|---|---|---|
| TiO2-Fex Oy -MnOk | 17.5 | 15.24 | 1.5 | 1.52 | 1.0 | 1.0 | M = Mn |
| TiO2-Fex Oy -CoOk | 17.5 | 14.22 | 1.5 | 1.42 | 1.0 | 1.0 | M = Co |
| TiO2-Fex Oy -CeOk | 17.5 | 5.98 | 1.5 | 0.60 | 1.0 | 1.0 | M = Ce |
| Fex Oy -MnOk | / | / | 1.5 | 1.52 | 1.0 | 1.0 | |
| Fex Oy -CoOk | / | / | 1.5 | 1.42 | 1.0 | 1.0 | |
| Fex Oy -CeOk | / | / | 1.5 | 0.60 | 1.0 | 1.0 |
2.2. Experimental setup
The schematic diagram of NTP-C synergistic catalytic system for α-pinene degradation was shown in Scheme
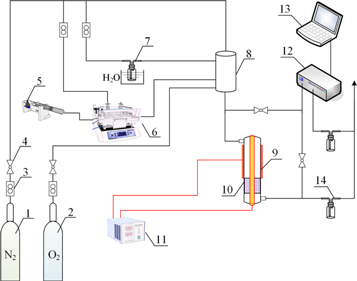
Scheme 1. diagram of the experimental system. 1, N2 standard gas; 2, O2 standard gas; 3, mass flowmeter; 4, shutdown valve; 5, injection pump shutdown valve; 6, evaporator; 7, water carrier; 8, gas mixer; 9, non-thermal plasma reactor; 10, nanocatalysts; 11, power generator; 12, flue gas analyzer; 13, record system; 14, gas washing bottle.
Download figure:
Standard image High-resolution imageIn this experiment, the plasma reactor was designed in dielectric barrier discharge (DBD) method with a quartz tube as the discharge barrier. The length and outer diameter of the quartz tube was 300 mm and 12 mm, respectively. And the wall thickness was 0.6 mm. The high-voltage electrode of DBD plasma reactor was a copper rod placed in the center of quartz tube in the size of diameter at 3.2 mm and length at 300 mm. While, the low-voltage electrode of DBD was a copper mesh wrapped on the outer wall of quartz tube. The width of copper mesh was 25 mm, which was the length of discharge area exactly. The CTP-2000 (Suman, Nanjing, China) AC power converter was introduced as the discharge energy generator with voltage, current and frequency controlled accurately. The output voltage waveform was sinusoidal, the frequency was adjusted from 6 kHz to 11 kHz and the peak voltage was arranged from 4 kV to 18 kV. The 0.2 g ternary mixed-oxide nanocatalysts of 40–80 mesh, were loaded into the catalyst bed downstream of the plasma reactor with GHSV at 300000 ml·(g·h)−1.
The inlet and outlet concentrations of α-pinene in the reactor were supervised by a VOCs gas analyzer Ultra RAE 3000 (RAE, California, USA), and the conversion rates of COx (CO2 and CO), and the concentrations of NOx (NO2, NO and N2O) were measured by a portable special gas analyzer TD500-sh (Shouhe, Beijing, China). The concentration of O3 was measured by O3 monitor TYBX31C (Tangyi, Shanghai, China). The varying concentrations of α-pinene and COx , and by-product generation concentrations of O3 and NOx were tested and evaluated. The α-pinene conversion and CO2 selectivity were calculated as follows:


Where [C10H16]in and [C10H16]out were the inlet and outlet concentrations of α-pinene, respectively. [CO] and [CO2] were the concentrations of CO and CO2 in the NTP-C synergistic catalytic reactor downstream. In order to ensure the accuracy of the experimental results, each experiment was repeated three times. And in each test, the nanocatalyst was adsorbed and saturated by C10H16 before measuring the catalytic conversion.
2.3. Catalyst characterization
The surface areas and pore size distributions of the three kinds of ternary mixed-oxide nanocatalysts were measured by Tristar II(3020) micro pore analyzer (Maxon, Illinois, USA). The adsorption isotherms of the prepared nanocatalysts for N2 were measured at 77 K after degasification in vacuum at 623 K for 10 h. Brunauer–Emmett–Teller (BET) and Barrett–Joyner–Halenda (BJH) were used to calculate the specific surface areas and the pore size distributions of the nanocatalysts, respectively. The characteristic peaks of x-ray diffraction (XRD) was tested Bruker D 8 advance analyzer (Bruker, Frankfurt, Germany), under the radiation of Mo Kα, with the diffraction intensity from 10° to 90°, the step size of 0.02°, and the point counting time at 1 s. The element phases in the nanocatalysts were distinguished by comparing the characteristic peaks of XRD patterns with international center for diffraction data (ICDD). The transmission electron microscope (TEM) of JEM 2010(HR) (JEOL, Tokyo, Japan) was used to capture the advanced microstructure picture of nanocatalysts. Thermal Escalab 250XI (Thermo Fisher, Boston, USA) was adopted as the analytical equipment for x-ray Photoelectron spectroscopy (XPS). The x-ray source was 150 W, the reference line was C 1 s at 284.6 eV, the radiation of Al Kα was 1486.6 eV, the pass energy was 46.95 eV, and the accuracy of binding energy was ±0.3 eV.
3. Results and discussion
3.1. Catalytic activity of mixed-oxide nanocatalysts on α-pinene removal efficiency and CO2 selectivity
3.1.1. The α-pinene removal activity of mixed-oxide nanocatalysts
The variation of α-pinene removal efficiency with different SED was studied under the same test conditions. The ternary mixed-oxide nanocatalysts could further promote the degradation of α-pinene with plasma compared with the binary mixed-oxide catalysts. As shown in figure 1(a), the catalytic conversion of α-pinene was obtained 80% at about SED 1200 J·l−1 when α-pinene was oxidized in a single plasma catalytic reaction. After adding mixed-oxide nanocatalysts into the plasma catalytic system, the removal efficiency of α-pinene was significantly improved, with the order of TiO2-FexOy-CoOk > TiO2-FexOy-CeOk > TiO2-FexOy-MnOk > FexOy-CoOk > FexOy-MnOk > FexOy-CeOk. Among these nanocatalysts, FeCoOx/TiO2 sample had the best performance with the α-pinene catalytic conversion reaching 83.3% at SED 620 J·l−1, which was almost half of the energy consumption of single plasma catalytic reaction.
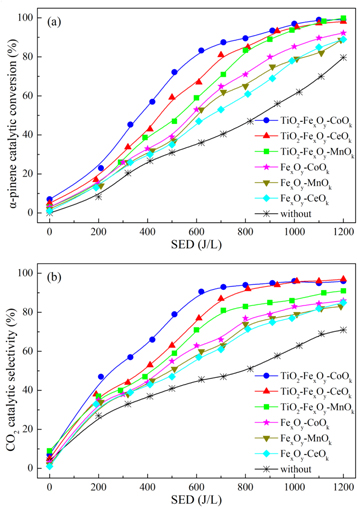
Figure 1. Mixed-oxide nanocatalysts effects on α-pinene catalytic conversion and CO2 selectivity. (a) α-pinene catalytic conversion; (b) CO2 selectivity.
Download figure:
Standard image High-resolution imageIn addition, the combination of NTP and mixed-oxide nanocatalysts also significantly improves the CO2 selectivity compared with the single plasma catalytic reaction, as shown in figure 1(b). At about 620 J·l−1, the selectivity of CO2 was only 45.6% under the single plasma catalytic reaction and no more than 60% under NTP-C catalytic system with binary mixed-oxide nanocatalysts. In contrast, when ternary mixed-oxide nanocatalysts were set in NTP-C system, the CO2 selectivity increased obviously, and the maximum reached 90.6% with TiO2-FexOy-CoOk nanocatalyst under SED 600 J·l−1. Therefore, it could be proposed that α-pinene was more easily degraded and completely oxidized to carbon dioxide under the catalytic reaction of plasma combining with ternary mixed-oxide. These results also indicated that mixed-oxide nanocatalysts played a significant part in VOCs degradation and oxidation products formation, which could improve the energy utilization efficiency and VOCs catalytic effects.
3.1.2. The by-product generation of mixed-oxide nanocatalysts
O3 produced during the plasma catalytic reaction process was an undesirable by-product because it could lead to the emission of secondary pollutants. Figure 2(a) showed O3 production as a function of SED during α-pinene catalytic oxidation. The results showed that the concentration of O3 in the reaction products catalyzed by NTP without catalysts was significantly higher than that with mixed-oxide nanocatalysts. Meanwhile, the ternary mixed-oxide nanocatalysts exhibited lower O3 generation concentration compared to the binary ones.

Figure 2. Mixed-oxide nanocatalysts effects on O3 formation and NOx generation. (a) O3 formation concentrations; (b) NOx generation concentrations; (c) NOx components at SED of 200 J·l−1, 600 J·l−1 and 1200 J·l−1.
Download figure:
Standard image High-resolution imageThe formation concentration of O3 decreased with the increase of SED, which was due to the active electrons collided with N2 and O2 to generating N and O atoms during the plasma catalytic reaction in the gas mixture. The chemical bond dissociation energies of N2 and O2 were 945 kJ mol−1 and 498 kJ mol−1, respectively [21]. Therefore, under the relatively low SED, O2 was more likely to react with high-energy electrons, resulting in more oxygen radicals and ozone formation during the plasma catalytic reaction. When the SED increased high enough, oxygen free radicals and ozone could react with N free radicals to form NO or NO2. For this reason, the concentration of O3 began to decrease with the further increase of SED. However, compared with the single NTP catalytic reaction, the plasma combined with mixed-oxide nanocatalysts could effectively reduce the emission of O3. When SED was 600 J·l−1, the export volume of O3 decreases from 109 ppm to 81 ppm under the catalytic reactions with TiO2-Fex Oy -CoOk nanocatalyst. It was inferred that the oxygen atoms decomposed from O3 on the surface of the nanocatalyst might participate in the catalytic oxidation of α-pinene, or it might convert into chemically adsorbed oxygen to be fixed [6]. But which reaction path would this kind of oxygen atom take still needed a deep investigation during the process of α-pinene catalyzed by NTP combined with ternary mixed-oxide nanocatalysts.
In addition, the NOx generation caused by NTP-C process for α-pinene was also studied. The concentrations of NOx generation on mixed-oxide nanocatalysts and blank tube were measured and compared as shown in figure 2(b). In all test conditions, the NOx generation concentrations improved with the SED increasing. Both binary and ternary mixed-oxide nanocatalysts were beneficial to restrain NOx generation. In order to further understand the catalytic reaction process, the NOx composition was analyzed at SED of 200 J·l−1, 600 J·l−1 and 1200 J·l−1 as exhibited in figure 2(c). It could be seen that the formation of NO2 was higher than NO and N2O in either the single plasma catalytic reaction or the plasma coupled with mixed-oxide nanocatalysts. In consideration of the results of O3 concentration showed in figure 2(a), it could be inferred that the reaction efficiency of NO oxidation to NO2 was related to the consumption of O3. Furthermore, the concentrations of NOx generation on ternary mixed-oxide nanocatalysts were significantly lower than that on the binary ones in the process of α-pinene catalytic oxidation. Further compared the test data of ternary mixed-oxide nanocatalysts, it could be found that, the gain effect of Co, Mn and Ce doping into TiO2-Fex Oy on inhibiting the by-product formation of NOx followed the order of TiO2-Fex Oy -CoOk > TiO2-Fex Oy -CeOk > TiO2-Fex Oy -MnOk .
3.1.3. The long-term tests with ternary mixed-oxide nanocatalysts
The long-term catalytic oxidation of α-pinene under the plasma catalytic reaction on ternary mixed-oxide nanocatalysts were carried out at about SED of 600 J·l−1. The catalytic stability of these nanocatalysts were shown in figure 3. In the long-term test, the removal rate of α-pinene on TiO2-FexOy-CoOk, TiO2-FexOy-CeOk and TiO2-FexOy-MnOk nanocatalyst were almost kept at about 83.3%, 68.7% and 60.6%, respectively, which were basically the same as the α-pinene removal rate shown in figure 1. Therefore, the ternary mixed-oxide nanocatalysts with cobalt, manganese or cerium as the doping element had good stability for NTP-C catalytic oxidation of α-pinene.
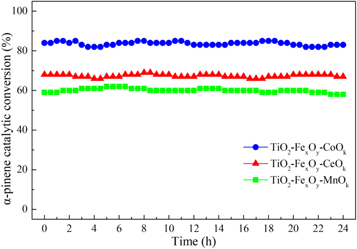
Figure 3. The long-term tests with ternary mixed-oxide nanocatalysts.
Download figure:
Standard image High-resolution image3.2. Characterization of the catalysts
3.2.1. BET analysis
The test data of N2 adsorption and desorption process was profiled in figure 4, and the pore structure characteristics of these ternary mixed-oxide nanocatalysts in specific surface area (SBET), total pore volume (Vt) and average pore size (Da) were summarized in table 2. According to SBET, Vt and Da results, the pore structure characteristics of TiO2-FexOy-CoOk nanocatalyst were better than those of TiO2-FexOy-CeOk and TiO2-FexOy-MnOk nanocatalysts. The SBET of TiO2-FexOy-CoOk nanocatalyst was increased by 36.8% compared with TiO2-FexOy-CeOk nanocatalyst and 73.8% higher than that of TiO2-FexOy-MnOk nanocatalyst. In the comparison of specific space volume, the Vt of TiO2-FexOy-CoOk nanocatalyst was 21.5% and 25.5% larger than that of TiO2-FexOy-CeOk and TiO2-FexOy-MnOk nanocatalyst, respectively. While, the Da of TiO2-FexOy-CoOk nanocatalyst was reduced by 39.6% compared with TiO2-FexOy-CeOk nanocatalyst and 54.9% lower than that of TiO2-FexOy-MnOk nanocatalyst. It was supposed that, Fe-Co, Fe-Ce and Fe-Mn oxides could be well dispersed on the surface of nano-TiO2, and Ti-Fe-Co oxide species were better dispersed on the surface of nanocatalyst in comparison. Thus, the effects of Ti-Fe-Co oxide species on promoting the formation of micropores, increasing SBET and Vt, and reducing Da, were much more remarkable. Although the Ti–Fe–Co, Ti–Fe–Ce and Ti–Fe–Mn oxides led to some changes in SBET, Vt and Da of the nanocatalysts, the data of pore structure characteristics still stayed in the same order of magnitude. This was due to the mesopores in nano-TiO2 occupied a very important proportion in these nanocatalysts [37]. Although the formation of micropore could improve the pore structure characteristics, to a certain extent, it would be inhibited by mesoporous existing in the nanocatalysts [59, 60].

Figure 4. N2 adsorption and desorption curves for ternary mixed-oxide nanocatalysts. (a) N2 adsorbed volume under different relative pressure; (b) pore volume in various pore diameter.
Download figure:
Standard image High-resolution imageTable 2. Pore structure characteristics of ternary mixed-oxide nanocatalysts.
| Samples | SBET (m2·g−1) | Vt (cm3·g−1) | Da (nm) |
|---|---|---|---|
| TiO2-Fex Oy -MnOk | 97.3 | 0.374 | 51.43 |
| TiO2-Fex Oy -CeOk | 123.6 | 0.413 | 38.36 |
| TiO2-Fex Oy -CoOk | 169.1 | 0.502 | 23.17 |
3.2.2. TEM measurements
The microstructure of these three different kinds of ternary mixed-oxide nanocatalysts was observed by TEM. Figure 5(a) exhibited the TEM image of TiO2-FexOy-CoOk nanocatalyst. The TiO2-FexOy-CoOk nanocatalyst was composed of uniform and fine ellipsoidal nanoparticles, and the particle size tended to be consistent. There was no obvious agglomeration between the particles. The surface of the nanoparticles was smooth and the shape was regular. The complete pore structure with both micropore and mesoporous was formed in TiO2-FexOy-CoOk nanocatalyst. It could be observed from figure 5(b) that, compared with TiO2-FexOy-CoOk nanocatalyst, the nanoparticle size of TiO2-FexOy-CeOk nanocatalyst was larger and presented irregular polygon instead of regular ellipsoid. A small quantity of nanoparticles accumulated slightly, resulting in the collapse of pore structure, which caused the reduction of SBET and Vt. The figure 5(c) showed the micromorphology of TiO2-FexOy-MnOk nanocatalyst. Compared with TiO2-FexOy-CoOk and TiO2-FexOy-CeOk nanocatalysts, the particle size of TiO2-FexOy-MnOk nanocatalyst was further larger, and some nanoparticles were compactly agglomerated. Compared figure 5(c) with figures 5(a) and (b), it could be observed that the micropore and mesoporous structure of TiO2-FexOy-MnOk nanocatalyst was significantly reduced. These results were consistent with the data of BET test. In order to have a clearer understanding of the crystalline phase composition, high resolution TEM was carried out on TiO2-FexOy-CoOk nanoparticle to observe and detect the species structure. As shown in figure 5(d), the collaborative doping of FexOy-CoOk species had little effects on basic morphology of anatase TiO2 with the lattice spacing of 0.352 nm corresponding to (101) plane and 0.235 nm matching to (004) plane exhibiting obviously, which was consistent with XRD results discussed following.
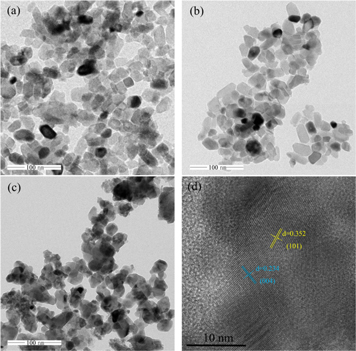
Figure 5. TEM results of ternary mixed-oxide nanocatalysts. (a) TEM of TiO2-Fex Oy -CoOk nanocatalyst; (b) TEM of TiO2-Fex Oy -CeOk nanocatalyst; (c) TEM of TiO2-Fex Oy -MnOk nanocatalyst; and (d) HRTEM of TiO2-Fex Oy -CoOk nanocatalyst.
Download figure:
Standard image High-resolution image3.2.3. XRD analysis
Figure 6 showed the XRD results of ternary mixed-oxide nanocatalysts. The different phase compositions of the three kinds of catalysts were searched and matched by MDI jade 6.5 software. In the XRD results of TiO2-FexOy-CoOk, TiO2-FexOy-CeOk and TiO2-FexOy-MnOk, there were strong and significant diffraction peaks of anatase TiO2, with a typical diffraction peak of 2θ at 25.3°, 37.8°, 43.0°, 53.9°, 62.7°, 68.8°, 70.3° and 75.1° approximately, corresponding to the XRD patterns of ICDD PDF#71-1166 [23]. However, in different nanocatalysts, the diffraction angle of each corresponding peak of anatase TiO2 was not the same, and there were different degrees of shifts. The results showed the diffraction peak of nano-TiO2 in TiO2-FexOy-CoOk sample was weaker and wider compared to that of TiO2-FexOy-CeOk and TiO2-FexOy-MnOk, which indicated that FexOy-CoOk loading reduced the crystallinity of TiO2. In TiO2-FexOy-CoOk nanocatalyst, the diffraction angle of each diffraction peak of anatase TiO2 was also the smallest. This could be due to the interaction between FexOy-CoOk and nano-TiO2 stronger than that between FexOy-CeOk (FexOy-MnOk) and nano-TiO2 [22].
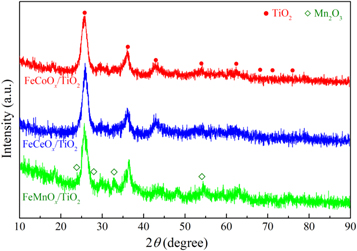
Figure 6. XRD test results of ternary mixed-oxide nanocatalysts.
Download figure:
Standard image High-resolution imageIn TiO2-FexOy-MnOk nanocatalyst, the weak diffraction peaks of Mn2O3 crystal were observed. The typical diffraction peaks matched the crystallographic plane reflection (ICDD PDF#78-0390) with 2θ values of 23.08° (211), 26.72° (220), 32.87° (222) and 56.89° (433), accordingly [61, 62]. FexOy or CoOx in TiO2-FexOy-CoOk nanocatalyst had no obvious characteristic peak reflection, which indicated that the active species had high dispersion on the surface of nanocatalyst. It might also be due to the particle size formed was too small to be recognized, or the active species of FexOy or CoOx entered the anatase TiO2 lattice [63, 64]. The same situation of low or absent FexOy and CeOx peaks intensity occurred in TiO2-FexOy-CeOk nanocatalyst, it could be considered that FexOy and CeOx active species also had high dispersion.
3.2.4. XPS and EDX analysis
For obtaining a better understanding of the oxidation state and surface composition of metals in ternary mixed-oxide nanocatalysts, XPS analysis was introduced. Figure 7 exhibited the XPS spectra of Fe 2p, O 1 s, Ti 2P, Co 2p, Ce 3d and Mn 2p in these three kinds of nanocatalysts. According to Gaussian fitting, the valence states of each element were calculated. Table 3 summarized the specific binding energies and individual element concentrations at different valence states.
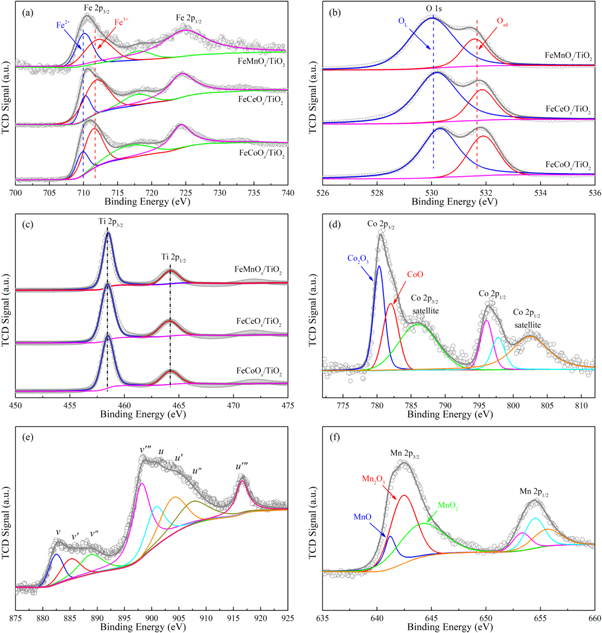
Figure 7. XPS spectra curve fitting of ternary mixed-oxide nanocatalysts. (a) XPS spectra of Fe 2p; (b) XPS spectra of O 1 s; (c) XPS spectra of Ti 2p; (d) XPS spectra of Co 2p; (e) XPS spectra of Ce 3d; (f) XPS spectra of Mn 2p.
Download figure:
Standard image High-resolution imageTable 3. Surface atomic compositions of the catalysts determined by XPS.
| Binding energy (eV)/Atomic composition (%) | |||||||||||
|---|---|---|---|---|---|---|---|---|---|---|---|
| Fe | O | Co | Ce | Mn | |||||||
| Samples | Fe2+ | Fe3+ | OL | Oad | Co2+ | Co3+ | Ce3+ | Ce4+ | Mn2+ | Mn3+ | Mn4+ |
| TiO2-Fex Oy -CoOk | 709.8 | 711.6 | 530.3/ | 531.9/ | 782.2/ | 780.3/ | −/− | −/− | −/− | −/− | −/− |
| 41.3 | 58.7 | 56.4 | 43.6 | 38.7 | 61.3 | ||||||
| TiO2- Fex Oy -CeOk | 710.1 | 712.0 | 530.2/ | 531.8/ | −/− | −/− | 885.2/ | 882.1/ | −/− | −/− | −/− |
| 44.6 | 55.4 | 63.9 | 36.1 | 42.7 | 57.3 | ||||||
| TiO2-Fex Oy -MnOk | 710.2/ | 712.2/ | 530.0/ | 531.7/ | −/− | −/− | −/− | −/− | 641.5/ | 642.6/ | 644.3/ |
| 51.7 | 48.3 | 75.2 | 24.8 | 19.7 | 39.1 | 41.2 | |||||
In TiO2-FexOy-CoOk, TiO2-FexOy-CeOk and TiO2-FexOy-MnOk, the XPS spectra of Fe 2p were shown in figure 7(a), in which two separate peaks according with Fe 2p3/2 (appearing at 709.9 eV approximately) and Fe2p1/2 (appearing at about 723.8 eV) [65]. Meanwhile, the Fe3+ peak appeared at about 717.8 eV was regarded as the satellite peak of Fe2O3. The wide Fe 2p3/2 peak could be divided into two overlapping characteristic peaks. A characteristic peak was located at 709.8 eV, which belonged to Fe2+. Another characteristic peak at about 711.6 eV belonged to Fe3+ [66]. These two characteristic peaks confirmed that iron coexisted in the valence states of +2 and +3 in TiO2-FexOy-CoOk, TiO2-FexOy-CeOk and TiO2-FexOy-MnOk, and their proportions were shown in table 3. For these three kinds of ternary mixed-oxide nanocatalysts, there were different electron transfer processes between the doping elements during the catalytic oxidation reaction of VOCs. The electron transfer process in TiO2-FexOy-CoOk nanocatalyst was Fe2+ + Co3+ ↔ Fe3+ + Co2+ [66]. In TiO2-FexOy-CeOk nanocatalyst, the electron transfer process was Fe2+ + Ce4+ ↔ Fe3+ + Ce3+ [67]. While the electron transfer process in TiO2-FexOy-MnOk nanocatalyst was Fe2+ + Mn4+ ↔ Fe3+ + Mn3+ [65].
Figure 7(b) showed the O 1 s spectra of these three kinds of ternary mixed-oxide nanocatalysts. According to the results of curve-fitting calculation, the spectrum of O 1 s could be split into two overlapping peaks, one was the characteristic peak of lattice oxygen (OL), which appeared between 530.2 eV and 530.3 eV, and the other was the characteristic peak of chemisorbed oxygen (Oad), with the center at 531.2–531.6 eV [68]. On the surface of TiO2-FexOy-CoOk sample, the chemisorbed oxygen component reached 43.6%, which was much higher than that of TiO2-FexOy-CeOk nanocatalyst (36.1%) and TiO2-FexOy-MnOk nanocatalyst (24.8%), as shown in table 3. Because of the high fluidity, the chemisorbed oxygen was regarded as the most energetic type of oxygen [69]. At the same time, based on the O 1 s spectra of TiO2-FexOy-MnOk nanocatalyst, it could be realized that the chemisorbed oxygen in TiO2-FexOy-CeOk and TiO2-FexOy-CoOk nanocatalysts shifted to higher binding energies slightly, from 531.7 eV of TiO2-FexOy-MnOk to 531.8 eV of TiO2-FexOy-CeOk and 531.9ev of TiO2-FexOy-CoOk, respectively. The binding energy of lattice oxygen also showed a similar change trend in the three nanocatalysts.
Figure 7(c) showed the XPS spectra of Ti 2p as the nanocatalyst supports, which included Ti 2p1/2 characteristic peak located at around 463.7 eV and Ti 2p3/2 characteristic peak at about 457.6 eV [70]. The results showed that Ti in the valence state of +4 was stable and dominant on the nanocatalyst surface. By comparing the XPS spectra of the characteristic peaks of Ti in the three kinds of nanocatalysts, it could be found that the characteristic peaks of Ti on the catalyst support did not change significantly, although the dopings in ternary mixed-oxide nanocatalysts were different, such as cobalt oxides, cerium oxides or manganese oxides.
For TiO2-FexOy-CoOk sample, the Co 2p1/2 characteristic peak at 796.7 eV approximately and Co 2p3/2 characteristic peak at about 780.7 eV were both observed in the XPS spectrum of Co 2p. And there were two satellite peaks appearing at 787.1 eV and 803.6 eV [12], which were closed to the two main peaks of Co 2p1/2 and 2p3/2, respectively, as shown in figure 7(d). In the relatively high binding energy regions, the two wider and milder satellite structures were produced by metal-to-ligand charge transfer, also referred to as the shakeup course of high spin cobalt [71]. The Co 2p3/2 characteristic peak was composed of Co3+ and Co2+ spectrum with binding energy of 780.3 eV and 782.2 eV accordingly. The results showed that Co2+ and Co3+ coexisted on TiO2-FexOy-CoOk catalyst surface, and the atomic composition of Co3+ achieved 61.3% approximately. The cobalt species in +3 valence state were existed in relatively high activity and produced more anion defects, which could enhance the adsorption and oxidation reaction process of VOCs.
In TiO2-FexOy-CeOk nanocatalyst, the XPS spectrum of Ce 3d results were shown in figure 7(e). The Ce 3d pattern matched the core holes of spin–orbit splitting of 3d5/2 and 3d3/2, which could be further divided into multiple peaks of u and v based on the binding energies, named as u, u', u'', u‴ and v, v', v'', v‴, respectively [72]. The u' and v' peaks exhibited the presence of Ce3+ ion in TiO2-FexOy-CeOk nanocatalyst, and the u, u'', u‴ and v, v'', v‴ peaks demonstrated the existence of Ce4+ ion [11]. The whole Ce 3d pattern confirmed that Ce3+ and Ce4+ species coexisted on the surface of TiO2-FexOy-CeOk nanocatalyst. The Ce3+ ion was an important inducement to form charge balance and unsaturated chemical bond. Between the oxides of Fe and Ce, the negative charge shifted from Fe2+ to Ce4+ enhanced the collaboration between Fe and Ce. TiO2-FexOy-CeOk nanocatalyst with Ce3+ and Ce4+ redox couple was more likely to construct oxygen vacancy on catalyst surface which was conducive to the adsorption and chemisorption of oxygen.
As shown in figure 7(f), Mn 2p characteristic peaks of TiO2-FexOy-MnOk nanocatalyst in the XPS spectrum were at around 653.3 eV and 642.4 eV [73]. The asymmetric curve of Mn 2p3/2 peak could be divided into three multi overlapping peaks based on Gaussian fitting calculation, which further confirmed the coexistence of complex Mn ion with different valence states in TiO2-FexOy-MnOk nanocatalyst. The Mn2+ peak appeared at about 641.5 eV, the Mn3+ peak arose at around 642.6 eV, and the Mn4+ peak occurred at 644.3 eV approximately. It was difficult to distinguish the complex MnOx with trivalent state, due to the binding energy difference less than 2.8 eV. In order to accurately identify the concentration and atomic composition of Mn ions on TiO2-FexOy-MnOk nanocatalyst surface, the quantitative analysis was carried out according to the separation peak coverage area calculation, and the results were shown in table 3. The oxidation capacity of MnOx mixed species follows MnO2 > Mn2O3 > Mn3O4 [74]. In TiO2-FexOy-MnOk nanocatalyst, manganese was mainly dispersed on the surface of catalyst in +3 valence state, as shown in table 3. These results indicated that TiO2-FexOy-MnOk nanocatalyst had the potential of further improvement of oxidation capacity.
As shown in figure 8, the perform of EDX analysis for the confirmation of elemental composition in ternary mixed-oxide nanocatalysts was carried out. According to EDX, the atomic composition was in accord with the data exhibited in table 1, with deviation less than 1%.

Figure 8. EDX analysis for elemental composition in ternary mixed-oxide nanocatalysts.
Download figure:
Standard image High-resolution image3.3. Mechanism analysis on NTP-C synergistic effect with ternary mixed-oxide nanocatalysts
Figure 9 proposed the NTP-C synergistic effect with combination of TiO2-Fex Oy -MOk and NTP process based on the test results obtained in this research and other achievements reported previously [75, 76]. Considering the similar structure-activity relationship with VOCs degradation, the reaction mechanism in the NTP-C synergistic process can be simplified into three aspects [21]. (1) VOCs are easily adsorbed on the surface of the catalyst, resulting in a strong collision reaction with the active components [4]. (2) The surface active sites on the catalyst participate in the degradation of pollutants under the discharge energy [77]. (3) The reaction activation energy of O3 with VOCs is also low, which easily leads to the formation of CO and CO2 [78]. During the NTP-C catalytic α-pinene process with ternary mixed-oxide nanocatalysts, three reaction paths accelerated the catalytic oxidation. First, the high-energy particles and active species formed by NTP, such as energetic electron and oxygen radical, could decompose α-pinene in collisions. Second, the mixed transition metal oxides could offer strong redox couples, such as Fe3+ ↔ Fe2+ [79], Co3+ ↔ Co2+ [80], Ce4+ ↔ Ce3+ [81] and Mn4+ ↔ Mn3+ (Mn3+ ↔ Mn2+) [33, 82], which obviously enhanced the electron transfer during the α-pinene catalytic oxidation reaction. Third, the nano-TiO2 had the dual function of catalyst support and catalytic component [83]. On one hand, nano-TiO2 improved the nanocatalysts surface areas and enhanced the transition metal oxides dispersibility, and on the other hand, the reactive species, such as *O, *C10H16 and *O3, could also generated on the surface of nano-TiO2 and further transformed into the final products. Therefore, the NTP-C synergistic effect with ternary mixed-oxide nanocatalysts exhibited higher catalytic oxidation activity compared to that with binary mixed-oxide nanocatalysts or without catalysts.

Figure 9. Plausible reaction mechanism for the α-pinene removal by NTP-C synergistic effects with ternary mixed-oxide nanocatalysts.
Download figure:
Standard image High-resolution image
4. Conclusions
The α-pinene catalytic performance of ternary mixed-oxide nanocatalysts combined with NTP by was systematically researched based on the comparision of catalytic reaction efficiencies and the analysis of nanocatalysts properties. The catalytic performance of mixed-oxide nanocatalysts combined with NTP were compared in terms of α-pinene removal rate, CO2 selectivity, by-product generation concentrations of O3 and NOx . The results showed the introduction of ternary mixed-oxide nanocatalysts into plasma catalytic reaction could significantly improve the catalytic conversion of α-pinene and reduce the by-products generation. The removal efficiency of α-pinene on TiO2-Fex Oy -CoOk nanocatalyst reached 83.3% at about 620 J·l−1, which was almost half of the energy consumption of plasma catalytic reaction. At the same time, TiO2-Fex Oy -CoOk nanocatalyst also showed the best CO2 selectivity, which reached more than 90%. Compared with TiO2-Fex Oy -CeOk and TiO2-Fex Oy -MnOk nanocatalysts, the excellent performance of TiO2-Fex Oy -CoOk nanocatalyst was consistent with the results of microstructure characterization. Considering the side reaction productions of O3 and NOx , the results showed the reaction efficiency of NO oxidation to NO2 was related to the consumption of O3. Compared with Mn doping, Co or Ce doping was more beneficial to inhibit the formation of by-product of NOx .
According to nanocatalysts properties analysis, the N2 adsorption-desorption experiments showed that mixed-oxides of Fe-Co, Fe-Ce and Fe-Mn in these three kinds of nanocatalysts changed the SBET, Vt and Da, but the variations belonged to the same order of magnitudes. The TEM results showed the surface of TiO2-Fex Oy -CoOk nanocatalyst was smoother, and the shape of nanocatalyst particle was more regular with forming complete micropores or mesopores structures, compared with TiO2-Fex Oy -CeOk and TiO2-Fex Oy -MnOk nanocatalysts. According to XRD results, there were strong and significant diffraction peaks of anatase TiO2 in all these three ternary mixed-oxide nanocatalysts. While CoOx and CeOx active species had higher dispersion than MnOx . Iron coexisted in +2 and +3 valence states in TiO2-Fex Oy -MOk (M = Co, Ce, Mn) nanocatalysts. The mixed valence of Co, Ce and Mn had an important influence on the catalytic oxidation performance of ternary mixed-oxide nanocatalysts. Finally, we believed that a clearer understanding of the performance of ternary mixed-oxide nanocatalysts coupled with NTP for the catalytic oxidation of α-pinene was profiled, and a new direction of optimizing the composition of nanocatalysts for improving the catalytic efficiency and selectivity of VOCs was proposed.
Acknowledgments
This research was funded by China Postdoctoral Science Foundation (2020M671983), Shandong Provincial Natural Science Foundation (ZR2019PEE002), Shandong Provincial Housing Urban and Rural Construction Science and Technology Project (2020-K2–10), The Plan of Guidance and Cultivation for Young Innovative Talents of Shandong Provincial Colleges and Universities.
Data availability statement
All data that support the findings of this study are included within the article (and any supplementary files).
Author contributions
Data analysis, Yan Gao; resources, Yan Gao; writing—original draft preparation, Yan Gao; funding acquisition, Yan Gao. conceptualization and methodology, Xiaoying Peng; project administration, Zhanchao Zhang; writing—review, Wenke Zhang, Hui Li; supervision, Baoming Chen; draft modification, Shijie Li, Yixue Zhang, Shidan Chi. All authors have read and agreed to the published version of the manuscript.
Conflict of interest statement
The authors state that they have no conflicts of interest in this work.