
Abstract
The effects of cold deformation on tensile properties and corrosion behavior of the Ti-6Al-3Nb-2Zr-1Mo alloy are investigated in the present work. The microstructure of the sample was characterized by means of x-ray diffractometry, scanning electron microscope and electron backscattered diffraction. The corrosion behavior of the alloy in HCl solution was characterized by potentiodynamic polarization test. The results show that the α laths became kinked after cold rolling and the interlamellar spacing decreased to about 0.45 μm at the rolling reduction of 50%. The kinking process closely linked with the development of shear bands within the colonies. EBSD investigations indicated that the α lath exhibited a (0001) texture in the 50% cold-rolled alloy. With the increase of cold deformation strain, the Yield strength of the alloy increases from 811 MPa to 943 MPa. The corrosion resistance of processed samples was higher than as-received sample. Experimental results showed that deformation substructure and texture had an influence on the corrosion rate of this alloy.
Export citation and abstract BibTeX RIS

Original content from this work may be used under the terms of the Creative Commons Attribution 4.0 licence. Any further distribution of this work must maintain attribution to the author(s) and the title of the work, journal citation and DOI.
1. Introduction
Titanium alloys with low density, high strength, high toughness, and excellent corrosion resistance, are widely used in chemical, petrochemical and shipbuilding industries [1–3]. There are many interactions between the materials and the environment. The service life of titanium alloy components mainly depends on the mechanical properties and corrosion resistance of materials. Different types of processing technologies have been widely used to prepare titanium alloys [4, 5].
The main factors affecting mechanical properties and corrosion resistance of titanium alloys is microstructure. Hot/cold mechanical processing and subsequent heat treatment play an essential role in the microstructure of titanium alloys. Wang stated that cold rolling process improves the tensile strength and reduce the elastic modulus of the TiNbTaZr titanium alloy through grain refinement [6]. Dyakonov studied the mircostructure evolution of the pure titanium subjected to cold rolled treatment [7]. The grains were significantly refined by the treatment, and the split-basal texture strength was increased due to the activation of 〈c + a〉 slip. Yu et al found that cold rolling and asymmetric rolling treatments introduce substantial subcrystals and dislocations and improve tensile strength and microhardness of Ti-6Al-4V alloy [8]. Li et al studied that fine-grain layer were formed in Ti-6Al-4V alloy by fast multiple rotations rolling [9]. Grain boundaries are beneficial to the nucleation process of the passivation film, thereby improving the corrosion resistance of the alloy. Guo et al validated that the TiZrAlV alloy with finer α lamellar phase has high density of Subgrain boundaries and higher corrosion resistance [10]. The related research results on Titanium alloy show that the effect of plastic deformation on the corrosion resistance of the alloy is complex. Low strain plastic deformation is not conducive to the corrosion resistance of the alloy, while a larger strain can improve the corrosion resistance of the alloy.
By removing V and adding Mo, Zr, Nb elements in the original Ti-6Al-4V alloy, a new type of Ti-6Al-3Nb-2Zr-1Mo near-alpha titanium alloy. The alloy has excellent processability and mechanical properties [11]. The titanium alloy pipes and plates are mainly formed by cold rolling. It is worth mentioning that many studies have been carried out to evaluate the hot workability and welding performance of Ti-6Al-3Nb-2Zr-1Mo alloy, but few studies have focused on the influence of cold rolling process on the properties of the alloy. In this study, the Ti-6Al-3Nb-2Zr-1Mo alloy (mass%) alloys sheets were fabricated using cold-rolling with the cold reductions from 0%–50% in thickness. The Mechanical properties and corrosion behavior to examine their potential use in petrochemical environments further were investigated.
2. Experimental materials and methods
2.1. Material
The alloy was melted in a vacuum consumable electro arc furnace. The chemical composition of the alloy is shown in table 1.
Table 1. Chemical composition of the experimental alloy (wt%).
| Al | Nb | Zr | Mo | Fe | Si |
|---|---|---|---|---|---|
| 6.1 | 2.9 | 2.1 | 1.0 | <0.01 | <0.01 |
2.2. Experimental procedures
The ingot is forged into 170 mm diameter round bar by several passes. The as-forged material was annealed at 1000 °C for 30 min to obtain a complete lamellar structure. The annealed titanium alloy rods are cut into a plate for subsequent cold rolling. After removing scales, the sheet was cold-rolled by the reduction in thickness of 30% and 50%, respectively. The phase composition of the alloy was obtained by x-ray diffraction analysis using Cu K-alpha radiation. A field-emission type Scanning Electron Microscope (Hitachi SU5000) was used to characterize the morphology. The interlamellar spacing for the lamellar α phase is measured by using the linear intercept technique. The crystallographic orientation of the microstructure was measured by electron backscatter diffraction (EBSD) technique. The EBSD mapping was performed using a step size of 0.6 μm and an accelerating voltage of 30 kV. The scans were analyzed using TSL OIM™ Analysis 7 software. The specimen surfaces were ground with SiC papers and mechanically polished with a 0.04 um colloidal silica solution for one hour followed by polishing with argon ions for 15 min. Tensile test specimens with a gauge length of 20 mm, a width of 6mm and a thickness of 1.5 mm were machined. The specimens of microstructural observation were mechanically polished and etched with the Kroll's solution.
2.3. Electrochemical measurements
The electrochemical experiment was carried out on a CHI660E electrochemical workstation, with an experimental environment of 5% HCl solution, the temperature of 35 °C and temperature difference not exceeding 1 °C. The electrochemical sample size is 10 × 10 × 3 mm. The surface area exposed to the electrolyte was 1 cm2. The samples were ground with 150#, 600#, 800#, 1000#, 1500#, and 2000# grit SiC. Then, the samples were polished to a mirror finish using silica suspension and cleaned ultrasonically with acetone, deionized water and alcohol, and blow-dried before use. A conventional three-electrode electrochemical cell was used in the experiment, in which the working electrode was the sample, the auxiliary electrode was platinum, and the reference electrode was silver chloride. Before each of the electrochemical test, the specimen was immersed in the solution for 60 min to stabilize the open circuit potential (Eocp). The electrochemical impedance spectroscopy (EIS) and polarization tests were carried out on a CHI660E electrochemical workstation. The high-frequency parameter was 100000 Hz and the low-frequency parameter was 0.01 Hz in the EIS measurement. Finally, the polarization test was performed. Potentiodynamic polarization curves were recorded in the voltage range of −0.6 V to 0.8 V at a scan rate of 0.000333 V s−1. Every test was performed five times with a fresh solution and a fresh specimen [12]. The corrosion resistance was also evaluated by weight-loss experiments in 20 wt% HCl at 35 °C. After different immersion periods, the samples (size of 20 × 20 × 3 mm) were cleaned ultrasonically with acetone and deionized water. Three sets of parallel samples were set up for the experiments corresponding to the alloys at different cold-rolled reductions.
3. Results
3.1. Microstructure
Figure 1 shows the XRD patterns for the alloy with different cold-rolled reductions. The XRD patterns include hexagonal α phases and body-centered cubic β phases. Compared with the peak intensity of α phase, the peak intensity of β phase is weaker, which indicates that the content of α phase in the alloy is higher.
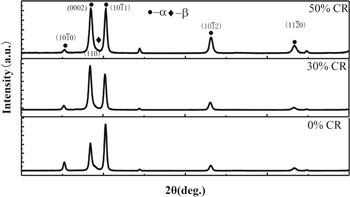
Figure 1. XRD patterns maps of TA31 alloy with different cold-rolled reductions.
Download figure:
Standard image High-resolution imageFigures 2 and 3 shows the microstructure of TA31 sheets processed by cold rolling (CR) with the reductions of 0%,30%and 50%. The microstructure of the as-received sample is composed of the fully transformed microstructure obtained by heat treatment at 1000 °C for 30 min. The size of the prior β grain is 200–250 mm and the prior β grain consists of the basketweave α microstructure, as shown in figures 1(a) and 2(a). The grains of the alloy are slightly elongated after the smallest imposed strain (10%CR) and the Local kink of lamellae α was observed within the deformed prior β grains phase. The thickness of the alpha laths decreases with the increase of rolling reduction. The α laths became to kink at a height reduction of 50%, as shown in figure 3(c). Figure 4 shows the EBSD structure of titanium alloy after different cold rolling treatment. There are many slip bands in lamellar α phase and the original β grain is elongated.

Figure 2. The microstructural for cold deformation: 0%–50% of cold reduction (a) 0% (b) 30% (c) 50%.
Download figure:
Standard image High-resolution image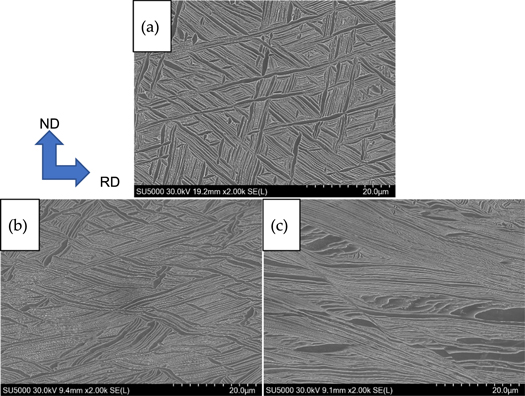
Figure 3. The microstructural for cold deformation: 0%–50% of cold reduction (a) 0% (b) 30% (c) 50%.
Download figure:
Standard image High-resolution image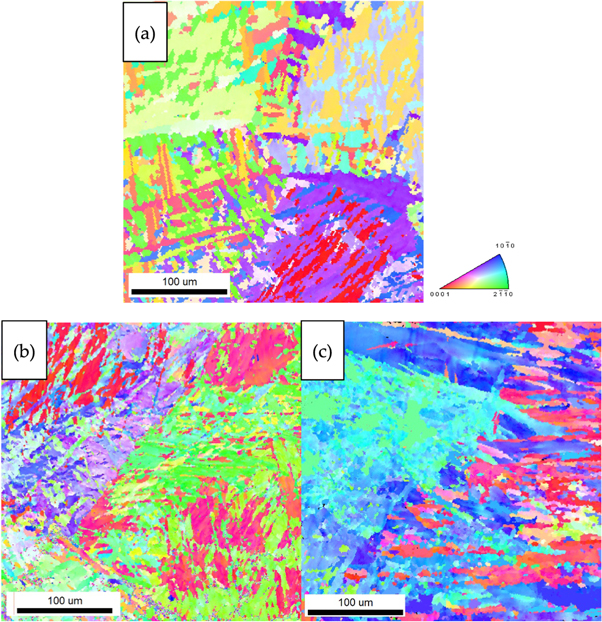
Figure 4. EBSD map for cold deformation: 0%–50% of cold reduction (a) 0% (b) 30% (c) 50%.
Download figure:
Standard image High-resolution imageA comparison of the peak intensity of α phase in all the samples revealed that the change of texture of α phase is insignificant as the deformation reductions increased to 50%. The textures of all the samples after 0% 30% and 50% thickness reduction are presented as {0001} pole figure 5 (ND is the normal direction and RD is rolling direction) obtained from electron backscatter diffraction (EBSD) measurements, as shown in figure 3. The c axis orientation is more dispersed for the as-received sample and after 25% reduction, c axis gradually turns to ND. The (0002) pole intensity along ND increased to 29.05 when the rolling reduction is 50% [13].
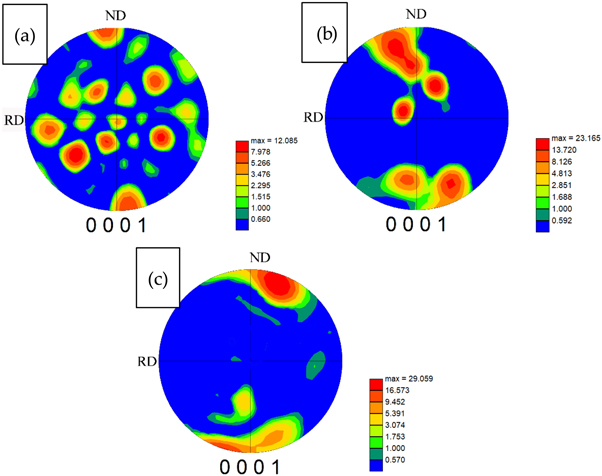
Figure 5. The (0002) texture pole figures for cold deformation: 0%–50% of cold rolling (a) 0% (b) 30% (c) 50%.
Download figure:
Standard image High-resolution image3.2. Corrosion characteristics
Figure 6 Variation of OCP with time for TA31 alloys with different cold deformation reductions in 5% HCl solution. The alloy has a higher initial potential, which is consistent with the passivation of the titanium oxide layer on the sample surface [3]. OCP occurs a rapid decline at the beginning of the experiment. The abrupt decrease in OCP suggests spontaneous dissolution of this protective oxide [3]. With the increase of the test time, the OCP changes slowly and eventually reach a stable state, which is related to the passive film on the surface of titanium alloy. Due to the good self-healing ability of titanium alloys, new passive films will be formed when the passive films are destroyed. With the increase of time, the passive film will become more compact and stable. When the failure and formation of the passive film reach relative equilibrium, the OCP of the alloy reaches a stable state. It can be seen from the graph that the alloy with 50% deformation has the highest OCP, reaching −250 mv, the sample with 30% deformation has the middle OCP, reaching −270 mv, and the sample with 0% deformation has the lowest OCP, reaching −280 mv. With the increase of cold rolling deformation, the corrosion resistance of the alloy in 5% hydrochloric acid solution tends to improve. Compared with the E-PH diagram of titanium alloy at 25 C, the thermodynamic stable phase in the reaction process is Ti3+, that is, Ti4+ is reduced to TiOOH, then dissolved to Ti3+, or Ti3+ is directly dissolved to Ti3+. The reaction formula can be expressed as [12]:


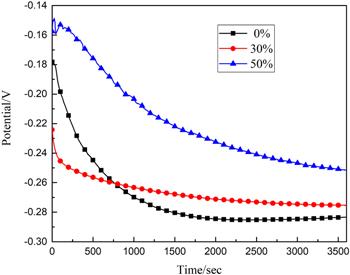
Figure 6. Variation of OCP with time for TA31 alloys with different cold deformation reductions in 5% HCl solution.
Download figure:
Standard image High-resolution imageFigure 7 shows the polarization curve of TA31 alloy in 5% hydrochloric acid solution after different cold rolling deformation. The polarization curves of the alloys show a process from activation to passivation. In the anodic reaction, with the increasing of potential, the current density increases rapidly at potentials below approximately 0.0V (SCE) due to activation polarization. When the potential is greater than −0.3V, the increasing of current density is inhibited and the current enters the stable region which is attributed to formation of protective passive film. When the destruction and formation of the passive film reached equilibrium, the current density enters a stable state, which is consistent with the OCP test results. The corrosion potential and corrosion current density of TA31 alloy are shown in table 2.

Figure 7. Polarization curves of TA31 alloys with different cold deformation reductions in 5% HCl solution.
Download figure:
Standard image High-resolution imageTable 2. Results of electrochemical corrosion for processed and as-received specimen.
| Conditions | Current density Icorr (μA/cm2) | Potential, Ecorr(Vsce) |
|---|---|---|
| 0 | −343 (±5) | 1651 (±13) |
| 30% | −337 (±7) | 1463 (±15) |
| 50% | −327 (±8) | 1376 (±17) |
With the increase of cold rolling deformation, the corrosion potential of TA31 alloy increases and the corrosion current density decreases. Therefore, the corrosion resistance of TA31 alloy in 5% hydrochloric acid solution becomes better and better with the rise of cold rolling deformation, which is consistent with the results of OCP experiment.
Figure 8 is the impedance diagram of TA31 alloy in 5% hydrochloric acid solution. The AC impedance spectra of TA31 alloy after different cold rolling treatments are semi-circular, capacitive impedance and typical passive metal impedance spectra. The impedance radius of TA31 alloy with 50% cold rolling deformation is the largest, followed by that of TA31 alloy with 30% cold rolling deformation, and that of TA31 alloy with 0% deformation is the smallest. The equivalent circuit after fitting impedance with ZView software is shown in figure 9. Rs represents the solution resistance from the reference electrode to the working electrode, Rp represents the film resistance or polarization resistance, CPE represents the double-layer capacitance between the passivation film and the solution, CPE is a constant phase element, and CPE is used instead. Capacitor C is a non-ideal behavior of capacitor elements due to different physical phenomena, such as surface roughness, impurities, dislocations or grain boundaries. CPE is defined by CPE-T and CPE-P parameters. The Rp value is mainly influenced by the characteristics of passive film of titanium alloy. The more difficult the passive film is to be destroyed, the higher the Rp value is, which indicates that the corrosion resistance of the alloy is better. At the same time, the Rp value is much higher than the Rs value. It also shows that the high corrosion resistance of titanium alloy mainly comes from the protection of passive film. It can be seen from the table 3 that the Rp value of polarization resistance increases with the increase of cold rolling deformation after different cold rolling deformation, which is consistent with the experimental results of open-circuit potential and polarization curve.

Figure 8. EIS of TA31 alloys with different cold deformation reductions in 5% HCl solution.
Download figure:
Standard image High-resolution image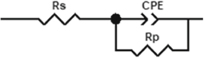
Figure 9. The equivalent circuit corresponding to EIS data of of TA31 alloys with different cold deformation reductions in 5% HCl solution.
Download figure:
Standard image High-resolution imageTable 3. Results of parameters of each element for processed and as-received specimen.
| Conditions | Rs (ohm cm2) | Rp(ohm cm2) | Error |
|---|---|---|---|
| 0% | 10.18 | 58059 | <2% |
| 30% | 4.788 | 63342 | |
| 50% | 3.369 | 66731 |
3.3. Mechanical properties
The engineering stress-strain curve at different rolling deformations reductions is shown in figure 10 Tensile curves are characterized by continuous yielding. Table 2 illustrates the effect of cold rolling deformation on the yield strength and ultimate tensile strength of the alloy. When the rolling strain increases, the yield strength increases from 811 MPa to 943 MPa, and the tensile strength increases from 940 MPa to 976 MPa. The rise in material strength may be caused by high density dislocation and grain refinement.
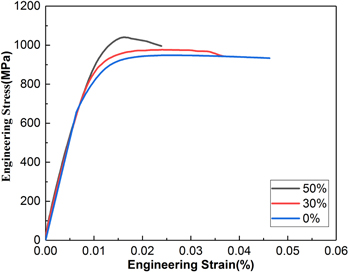
Figure 10. Engineering stress–strain curves and of Ti-6Al-3Nb-2Zr-1Mo alloy with different cold deformation reductions.
Download figure:
Standard image High-resolution image4. Discussion
The mechanical and corrosion properties of titanium alloys are mainly related to their microstructure. Structural units mainly include the interlamellar spacing of α laths and dislocation density, etc [13, 14]. The SEM image of the microstructure of cold rolling with the reductions of 30% is shown in figure 11. Lamellar α and β phases form a zigzag structure. Some studies show that dislocation slip occurs on the slip surface with the highest Schmid factor in the α phase [15]. Lamellar α and β phases conform to specific Burgers orientation Relationship [1]. Dislocation slip will pass through the α/β interface without being hindered. Figure 11(b) shows the schematic diagram of lamellar α and β slip. In order to better understand the deformation of the alpha laths, misorientation transverse and parallel to lamellae α within the α colonies were measured by Electron Back Scattered Diffraction technology. Figure 12 depicts the change of misorientation angle transverse to the lamellae α phase. In the as-received sample. The misorientation angle of point to point misorientations and point to original are less than 2°. Thus, the lamellae α within the colonies in the prior β grain had similar orientation. These results are caused by the β-to-α phase transition of the titanium alloy in accordance with the Burgers orientation. With the increase of strain, orientation variations to α laths showed alternating orientation changes. It is believed that adjacent laths rotate with each other and this tends often occurs during single-phase fcc metals deformation [16]. Under the deformation process, a colonies have behaved as a single α grain due to the Burgers OR between the lamellae α and β phases. The misorientation profile counted parallel to the lamellae α phase increases as the distance increases and accumulated misorientations is smoothly increased to 15°, revealing that the orientation change of lamellae α and β phases was continuous [14–16]. Therefore, dislocation slippage occurs in the lamellar α and β phases during the deformation process while the lamellar α and β phases undergo significant grain rotation, resulting in high-density dislocations. In order to get fundamental insight into the deformation process, Misorientation angle for the as-received and deformed samples are shown in figure 13. A misorientation angle of 2 ∼ 15° is defined as low-angle boundaries (LABs) and the misorientation angle greater than 15° is high-angle boundaries (HABs). In undeformed materials, most of the boundaries are high-angle boundaries. A small amount of small low-angle boundaries exists in the α/β interface. Therefore, lamellae α has the same crystal orientation within the colony while the adjacent α and β lath conform to the Burgers orientation relationship, so the ratio of the small angle grain boundaries is low. The misorientation angle decreased with the increase of strain, which is closely related to the motion of dislocation. Work hardening leads to more substructures as strain increases, and thus the fraction of low angle grain boundaries increases [16].
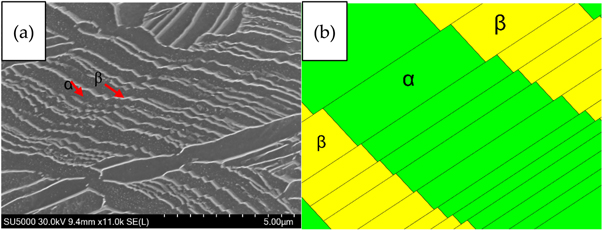
Figure 11. (a) SEM images of the microstructures with the cold deformation reductions 30% (b) Schematic illustration of dislocation slip.
Download figure:
Standard image High-resolution image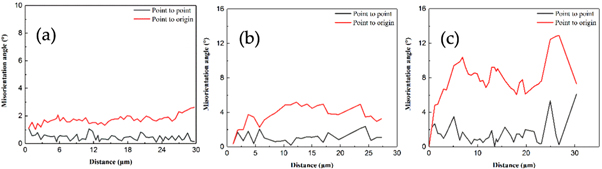
Figure 12. Misorientation angle map transverse to the lamellae α phase with different cold deformation reductions (a) as-deformed, (b) 30%, (c) 50%.
Download figure:
Standard image High-resolution image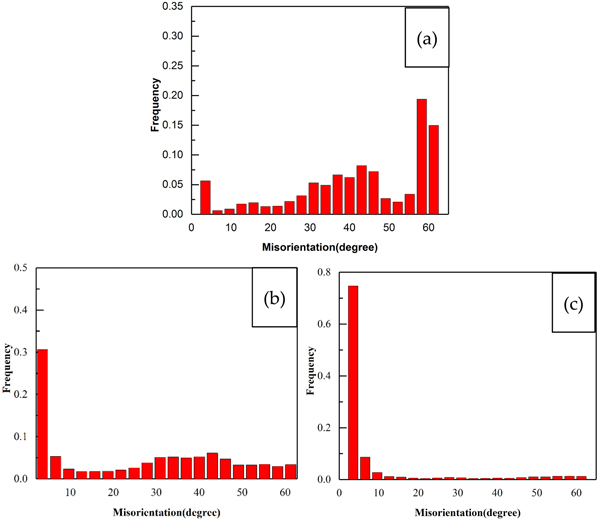
Figure 13. Misorientation angle distributions after cold deformation steps: 0%–50% of cold rolling.
Download figure:
Standard image High-resolution imageIn this study the corrosion behavior of Ti–6Al–3Nb–2Zr-1Mo alloys was investigated in HCl solutions. In the solution, the Ti-6Al-3Nb-2Zr-1Mo alloys exhibited active–passive behavior [3]. The passivation of the alloy in this solution is incomplete. Figure 14 shows variation of weight loss with time for Ti-6Al-3Nb-2Zr-1Mo alloy with different cold deformation reductions for 10 days in 20% HCl solution. The alloy exhibited a linear weight loss over time. TA31 alloy with 0% cold rolling deformation exhibited higher weight loss compared to the alloy with 50% cold rolling deformation. Microstructure alteration may be an important factor affecting the corrosion reaction of alloys [17]. Grain size and sub-grain content are important factors affecting corrosion resistance of titanium alloys [18]. There are more grain boundaries in the fine grain structure, which can provide a higher density nucleation site for the formation of the passivation film [19, 20]. Meanwhile, the corrosion rate of many materials has been related to surface energy in previous studies [21]. Zhang's [22] research shows that the corrosion rate of materials is related to the surface energy, and reducing the surface energy can improve the corrosion resistance. Gray et al [23]. Reported that the dissolution rate of polycrystalline alloys in 1m hydrochloric acid (HCl) solution is related to crystal orientation, and the corrosion rate is {111} < {110} < {100}. The surface energy of the titanium alloy (0001) plane is 1.47 J m−2, and the surface energy of the (1120) and (1100) planes are 1.68 J / m2 and 1.55 J m−2, respectively [24]. This shows that the Ti (0001) surface is the most stable, has the lowest surface energy, and has the best corrosion resistance. In this study, the {0001} plane in the 50% cold-rolled alloy has higher texture density on RD-TD plane, as shown figures 1 and 4. XRD pattern and EBSD pole figure show that 50% sample has higher {0001} plane texture density. The corrosion resistance of the alloy increases with the increase of cold rolling deformation.

Figure 14. Variation of weight loss with time for Ti-6Al-3Nb-2Zr-1Mo alloy with different cold deformation reductions for 10 days in 20% HCl solution.
Download figure:
Standard image High-resolution image
The strength of titanium alloy is closely related to its microstructure, such as microstructure type, grain size, dislocation density, etc. Due to the limited number of movable slip systems in hexagonal titanium alloys, titanium alloys exhibit strong grain boundary strengthening, i.e. Liu et al found that the strength of the alloy was related to the thickness of the alpha laths, which conforms to Hall–Petch relationship [13, 25]. The thickness of the α grain boundary directly influences the strength mismatch between the α + β matrix and the grain boundary. The thickness of the alpha laths measured from the scanning electron microscope image is shown in table 3. With increased deformation reductions, the thickness of the α lath in the annealed samples decreases from 0.97 μm to 0.45 μm. The Yield strength can be expressed as follows:

where σd is the yield strength, σ0 is the Other reinforcements, k is a constant, and d is the grain size corresponding to the thickness of the α lath.
Dislocation slip and density play an important role in the plastic deformation and strength of near α titanium alloy. Obviously, the dislocation slips lines increase gradually during cold rolling. and the α laths became kinked. There will be many sub-grains in the α laths. The Effect of dislocation enhancement is usually calculated using by the following formula equation:

where The M is the Taylor factor (it is 2.6 in the present work), α is a constant (typically equal it is equal to taken to be 0.15) [26], G is denotes the shear modulus of titanium (equal to 40 GPa) [26], b is the Burgers vector, The dislocation density, ρ is calculated as follows:

where ε is non-uniform strain, b is the Burgers vector of dislocations in α-Ti (0.295 nm). The strengthening contribution from the Grain boundary and dislocation density is summarized in table 4.
Table 4. Contribution of each strengthening effect and yield strength for samples with different.
| Rolling reductions | YS | d | σd | ρ/(1 × 1014 m−2) | σρ |
|---|---|---|---|---|---|
| 0% | 811 | 0.97 | 223.3 | 2.54 | 73.3MPa |
| 30% | 861 | 0.66 | 270.8 | 3.93 | 91.2 MPa |
| 50% | 943 | 0.45 | 327.8 | 4.85 | 101.3MPa |
5. Conclusions
- (1)Microstructure evolution during cold deformation is driven mainly by the kinking of α lamellae. An increasing in cold reduction led to the decrease the interlamellar spacing of the laths from 0.97 to 0.45 and the plane normal tending to become aligned parallel to the loading axis. Basal poles shifted to produce (0002) 〈1010〉 toward the normal direction.
- (2)The Ti-6Al-3Nb-2Zr-1Mo alloy have similar corrosion behavior. However, as the cold deformation reduction increased from 0% to 50%, The passive current density of the alloy increased with an increase in the cold deformation reductions. Alloy texture and substructure are the main factors affecting Ti-6Al-3Nb-2Zr-1Mo corrosion resistance, The corrosion resistance of the alloy increases with the increase of cold rolling deformation.
- (3)The yield stress and the ultimate tensile strength for the alloy increased with the lamella αrefines and dislocation density increases. The maximum value of ultimate tensile strength is 976 MPa the corresponding yield stress is 943 MPa obtaining at the rolled reduction of 50%.
Acknowledgments
This work was support by the National Key Research and Development Program of China (Grant No. 2016YFB0301203).