

Abstract
Down conversion and upconversion photoluminescence of pristine and gold ion irradiated ZrO2:Er3+ phosphor synthesized by solution combustion are reported. The crystallinity of the sample as analysed by x-ray diffraction shows a monoclinic phase having a crystallite size of about 57 nm calculated using Williamson—Hall formula. Field emission scanning electron microscopy shows that the shape and size of phosphor grains are non uniform. The down conversion photoluminescence of ZrO2:Er3+ has sharp emission bands in the red, green and blue regions of the spectrum. These emissions are corresponding to f–f transitions of Er3+ ions under excitation of 379 nm. In particular, the emission has maxima at 467, 492, 526, 548 and 660 nm correspond to 4F3/2 → 4I15/2, 4F7/2 → 4I15/2, 2H11/2 → 4I15/2, 4S3/2 → 4I15/2 and 4F9/2 → 4I15/2 transitions respectively. Interestingly, the PL emission intensity (excitation at 379 nm) is enhanced 1.6 times higher than pristine sample after 120 MeV Au ion irradiation for a fluence of 1 × 10¹⁰ ions cm−2. The blue to green emission ratio increases with the increase in ion fluence. Therefore, emission of the color shift towards bluish-white color with ion fluence. The lifetime of 4S3/2 level is found to be 16.9 and 71.5 μs for pristine and Au ion irradiated (1 × 10¹² ions cm−2) ZrO2:Er3+ respectively. In near infrared (NIR) region, the PL emission band is observed at 1531 nm corresponding to 4I13/2 → 4I15/2 transition of Er3+ under excitation of 980 nm. The sample emits intense green emission and relatively weak red emission in up conversion PL under excitation of 980 nm. The ratio of intensities of red and green emission changes after Au ion irradiation is attributed to the corresponding change in the lattice symmetry in the host. Resulting in strong up conversion emission from two photon absorption process.
Export citation and abstract BibTeX RIS

Original content from this work may be used under the terms of the Creative Commons Attribution 4.0 licence. Any further distribution of this work must maintain attribution to the author(s) and the title of the work, journal citation and DOI.
1. Introduction
Zirconium oxide (ZrO2) is a promising host matrix for the fabrication of efficient trivalent lanthanide-doped phosphors. This is because of its excellent chemical and thermal stability, low phonon frequency (∼470 cm−1) & wide optical band/energy gap [1–3]. In recent years, a variety of synthesis methods have been developed to produce nanocrystalline zirconia with various morphologies that can be exploited for use in devices including optoelectronic, photonic, displays [4–6]. The f–f transitions of trivalent rare earth (RE) ions produce sharp lines in absorption spectrum as well as emission spectrum. Among trivalent RE ions, Er3+ ions with 4f11 electron configuration allows the observation of the parity forbidden intra-4f transitions from the visible to near infrared (NIR) region [3, 7]. The intensity and color of emission of PL of ZrO2:Er3+ is influenced by the concentration of Er3+. The PL is green in color for low concentration of Er3+ and red when the concentration of Er3+ ions is greater (>4 mol%) [6].
Up conversion (UC) PL is the emission of photon in the visible region owing to transitions at trivalent RE ions. These ions are doped into a solid state host or in fluoride materials and the emission occurs under excitation using light of wavelength in the near infrared region. Up conversion of PL from ZrO2:Er3+ has been achieved through excited state absorption (ESA) process. UC emission of ZrO2:Er3+ has been observed in the green (4S3/2 → 4I15/2) and red (4F9/2 → 4I15/2) regions of the electromagnetic spectrum under excitation wavelengths of 962 nm and 980 nm [8, 9]. Swift heavy ion (SHI) irradiation is a exclusive method used to modify the structure and optical properties of the materials. In the case of semiconductors or insulators, SHI irradiation induces new color centers, among other types of effects that enhance the optical properties of materials [10, 11]. As an example, Costantini et al [12] reported that F+ type centers were created in yttria stabilized zirconia during 200 MeV I and 2.6 GeV U ion irradiation.
In this article, we report the synthesis, structure, morphology and photoluminescence (PL) (down and up conversion) properties of ZrO2:Er3+ (1 mol%) and the effect of gold ion irradiation on PL emission. The mechanisms involved are discussed.
2. Experimental details
Zirconium oxide doped with 1 mol % of erbium (ZrO2:Er3+) was synthesised by the combustion technique. Zirconium (IV) oxynitrate hydrate (∼99%), carbohydrazide (∼98%) and erbium nitrate pentahydrate (∼99.9%) were used as starting materials. The procedure used for the synthesis is described elsewhere [13]. Pellets of size 5 mm dia and 1 mm thick were made using a custom pelletizer. The pressure applied is 20 MPa.
The pellets were mounted on a glass slide (height 10.5 × 2.5 cm width). The glass slide was then mounted on a vacuum shielded vertical ladder with four rectangular faces for ion beam irradiation. These samples were irradiated with 120 MeV Au9+ ions at various fluence (1 × 10¹⁰ − 1 × 10¹² ions cm−2) using a 16 MV Tandem pelletron accelerator (15 unit doubled) at Inter University Accelerator Center (IUAC), New Delhi, India.
Pristine and SHI-irradiated ZrO2:Er3+ samples were characterized by x-ray diffraction (XRD) for structure analysis, field emission scanning electron microscopy (FESEM) for morphology and PL for optical properties. The XRD pattern of each sample was recorded using a Bruker D8 advance x-ray diffractometer. The morphology of the pristine sample was studied by FESEM (Model MIRA II LMH). PL spectra were recorded using a FLS980 Spectrometer (Edinburgh Instruments). PL excitation and emission spectra were recorded using a 450 W continuous xenon arc lamp (Xe1) and the decay measurements were carried out with 60 W of xenon microsecond flashlamp (μF2).
3. Results and discussion
3.1. Energy loss and range of ions in ZrO2 sample
The penetration depth and energy loss of 120 MeV Au9+ ions in ZrO2 were estimated using the SRIM 2008 program (www.srim.org) [14]. The penetration depth from the sample surface was found to be 8.83 μm. The electronic energy loss (Se) and nuclear energy loss (Sn) were found to be 26.24 and 0.42 keV nm−1 respectively. The Se is more dominant than Sn in zirconia for 120 MeV Au9+ ions. High energy transfer through Se cause damage production and cylindrical zone of tracks were created including the formation of defects, defect clusters, high pressure phase generation, amorphization, etc [15].
3.2. X-ray diffraction
The crystal structure of the sample was analyzed using XRD. Figure 1 show XRD patterns of ZrO2:Er3+ measured before and after 120 MeV swift Au9+ ion irradiation for a fluence of 1 × 10¹² ions cm−2. Both samples show prominent diffraction peaks at 28.14° (−111) and 31.42° (111) which are characteristic of the monoclinic phase. These results match well with standard powder diffraction file (PDF # 86-1451). A new weak diffraction peak is observed at 30.18° (101) in Au ion irradiated sample. This new diffraction peak corresponds to a tetragonal phase (PDF # 88 − 1007). Other less intense peaks belong to the monoclinic phase of ZrO2. The percentage of phase transition from monoclinic structure to tetragonal is negligible for the fluence 1 × 10¹² Au ions cm−2. For this reason, the crystalline phase of both samples remains unchanged (monoclinic). The details of any phase transition from monoclinic to tetragonal under SHI irradiation was reported elsewhere [16].
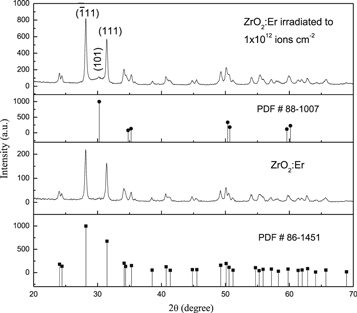
Figure 1. XRD patterns of pristine and Au ion irradiated ZrO2:Er3+ samples. The irradiation fluence was 1 × 10¹² ions cm−2. The diffractogram PDF # 86-1451 and # 88–1007 are included for comparison.
Download figure:
Standard image High-resolution imageThe crystallite size of the samples were estimated from XRD results using the Williamson Hall (W-H) equation as described elsewhere [17]. The average crystallite size was found to be 57 nm for the unirradaited sample and 53 nm in case of Au-ion irradiated ZrO2:Er3+ sample.
3.3. Scanning electron microscopy
The morphology of ZrO2:Er3+ sample is shown in figure 2(a). It is observed that, the grains grew to different size and non-uniform shape. The differences in size and shape might be related to the non uniform spreading of temperature in the combustion flame. The grain sizes are shown in the range of 70–80 nm as read off the scale bar which is given in the image. The elemental composition of the material was identified by energy dispersive x-ray (EDX) analysis shown in figure 2(b). According to EDX, the ZrO2:Er3+ (1 mol%) sample contains the elements Zr, O and Er at a weight % of 64.83, 35.77 and 1.20% respectively. The result confirms that the dopant Er ions were evenly distributed in the host matrix.
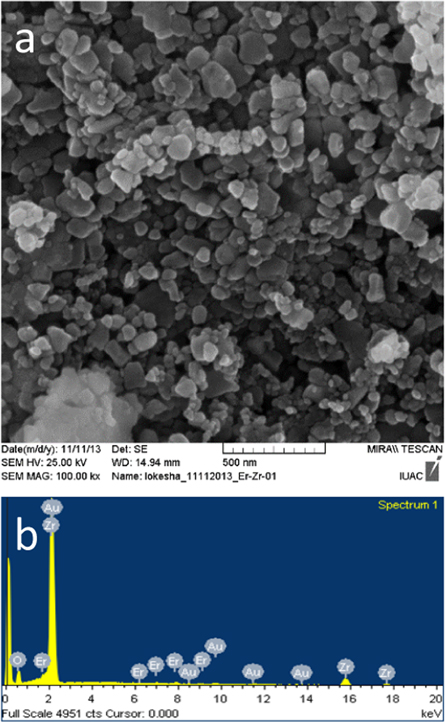
Figure 2. (a) FESEM image and (b) EDX of ZrO2:Er3+ (1 mol%) sample.
Download figure:
Standard image High-resolution image3.4. Photoluminescence
3.4.1. Down-conversion PL under excitation at 379 nm
Figure 3 shows a PL excitation and emission spectrum of pristine ZrO2:Er3+. The PL excitation spectrum was monitored at 548 nm. This shows a series of peaks at 367, 379, 407, 453 and 490 nm. The peaks are due to 4f transitions of the Er3+ ions from ground state 4I15/2 to higher levels. Among these peaks, a high intense excitation one was observed at 379 nm corresponding to 4I15/2 → 4G11/2 transition. This wavelength (379 nm) was thus used as the excitation wavelength in measurement of the emission spectra.
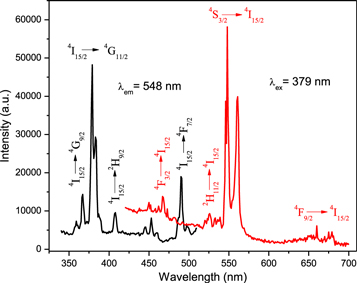
Figure 3. Photoluminescence excitation and emission spectrum of ZrO2:Er3+.
Download figure:
Standard image High-resolution imageThe PL emission spectrum shows a combination of emission bands which originate from ZrO2 host and f–f transitions of Er3+ ions. In the green region, the strongest emission band is observed between 540 and 575 nm along with a less intense peak at 526 nm corresponding to 4S3/2 → 4I15/2 and 2H11/2 → 4I15/2 transitions respectively. The weaker intensity emission band observed between 660 and 680 nm corresponds to 4F9/2 → 4I15/2 transition [5]. Also, weaker intensity peaks are observed between 467 and 492 nm. These overlap with the broad PL band between 420 and 500 nm. The sharp line maxima at 467 and 492 nm correspond to 4F3/2 → 4I15/2 and 4F7/2 → 4I15/2 transitions of Er3+ ions respectively. The broad emission band is related to singly occupied anion vacancies in the ZrO2 host [18, 19].
The visible emission of ZrO2:Er3+ is described by the energy level diagram shown in figure 4. For the down-conversion process, the ions populate the 4G11/2 level directly by excitation at 379 nm. Then non-radiative relaxation occurs from the 4G11/2 level to 2H11/2, 4S3/2 and 4F9/2 level. The result of radiative transition from 4F3/2, 4F7/2, 2H11/2, 4S3/2 and 4F9/2 to ground state (4I15/2) produce the blue, green and red emission.

Figure 4. Energy level diagrams of Er3+ used to explain down- and up-conversion.
Download figure:
Standard image High-resolution imageThe effect of 120 MeV Au ion irradiation on PL emission of ZrO2:Er3+ was studied. Figure 5 shows PL spectra of pristine and 120 MeV Au ion irradiated ZrO2:Er3+ for various fluence under excitation at 379 nm. The PL spectra shows three groups of emission lines in the blue, green and red regions. Au ion irradiation enhances the PL emission intensity of the green emission nearly 1.6 times that of the pristine sample. The maximum PL green emission intensity is observed at 1 × 10¹⁰ ions cm−2 and then it decreases with the increase of ion fluence. The increase in PL emission intensity is attributed to the creation of F+ type center (singly occupied oxygen vacancies) caused by SHI irradiation. At higher fluence (1 × 10¹² ions cm−2), the concentration of color centers created during heavy ion irradiation reaches saturation level and formation of complex defects [20]. This causes a reduction in PL emission intensity at higher fluence in the green region. The prompt intensity of Er3+ ions is dependent on concentration of Er3+ ions and consequently on the crystalline phase [6]. Green emission dominates in monoclinic phase of ZrO2 (<5 mol% of Er3+ ions) whereas tetragonal phase of ZrO2 (>5 mol% of Er3+ ions) show intense emission in the red region. The green emission intensity significantly decreases and red emission nearly constant with the increase of ion fluence under excitation of 379 nm.
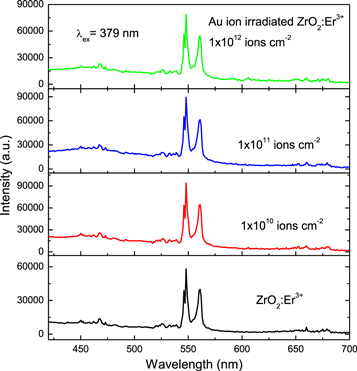
Figure 5. Down-conversion PL spectra of pristine and Au ion irradiated ZrO2:Er3+ under excitation at 379 nm.
Download figure:
Standard image High-resolution image3.4.2. Down-conversion PL under excitation at 980 nm
Figure 6 shows NIR PL spectra of pristine and SHI irradiated ZrO2:Er3+ samples recorded with excitation of 980 nm. The emission spectra show an emission band at 1531 nm that is attributed to 4I13/2 → 4I15/2 transition. According to the Er3+ energy band diagram, the 4I11/2 level is populated directly by the 980 nm excitation and the pumping energy leads to non-radiatively relaxation to the 4I13/2 level (figure 4). The radiative transition from 4I13/2 level to the ground state 4I15/2 produces emission at 1531 nm. PL spectra show several narrow peaks between 1400 and 1650 nm. These peaks are due to the Stark splitting of the 4I13/2 level. The appearance of a number of Stark levels represents Er3+ ions occupying lower symmetry positions in the host matrix [7]. The position of the emission peak remains the same before and after Au ion irradiation and the PL intensity increases by 1.3 times in comparison to that of the unirradiated sample.
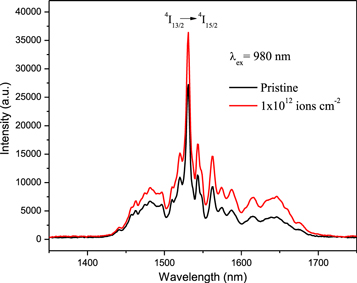
Figure 6. Down-conversion PL spectra of pristine and Au ion irradiated ZrO2:Er3+ under excitation at 980 nm.
Download figure:
Standard image High-resolution image3.4.3. Up-conversion PL under excitation at 980 nm
Up-conversion PL spectra of pristine and Au ion irradiated ZrO2:Er3+ recorded with excitation at 980 nm are shown in figure 7. The visible PL spectra show emission bands in green and red regions. The emission shows a peak maximum at 526, 561 and 679 nm corresponding to 2H11/2 → 4I15/2, 4S3/2 → 4I15/2 and 4F9/2 → 4I15/2 transitions respectively.
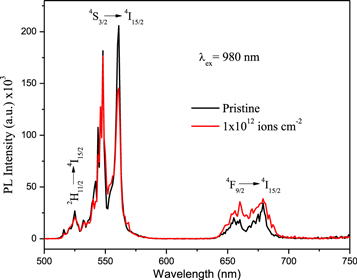
Figure 7. Up-conversion PL spectra of pristine and Au ion irradiated ZrO2:Er3+ under excitation at 980 nm.
Download figure:
Standard image High-resolution imageThe energy level diagram of up-conversion process of Er3+ ions is shown in figure 4. The ions are populated to the 4I11/2 level directly from excitation at 980 nm through ground state absorption (GSA). The intermediate level (4I11/2) has a long decay time [21]. Therefore, the second photon absorbed from 980 nm excitation promotes to the 4F7/2 level through excited state absorption (ESA). From the 4F7/2 multiplet, non-radiative relaxation occurs to the 2H11/2, 4S3/2 and 4F9/2 levels with the resulting green and red emission corresponding to 2H11/2 → 4I15/2, 4S3/2 → 4I15/2 and 4F9/2 → 4I15/2 transitions. Also, a part of the population of 4I11/2 level is involved in non-radiative relaxation to the 4I13/2 level. The ions in the 4I13/2 level are excited to the 4F9/2 level by absorbing a second 1531 nm photon through excited state absorption. The transition from the 4F9/2 level to the ground state (4I15/2) produces red light. Since there are two emission processes involved in up-conversion PL, the rate of red emission intensity increases when compared to down-conversion emission.
After Au ion irradiation (1 × 10¹² ions cm−2), the ratio of intensities of red and green emission are increased when compared to pristine sample under excitation of 980 nm. Patra et al [22] reported that rates of red emission increase when the crystalline phase of the sample changes from monoclinic to tetragonal. In the present work, the rate of red emission increased after Au ion irradiation due to change in lattice symmetry (from monoclinic → monoclinic + tetragonal → tetragonal). The evidence for partial phase transition is confirmed in the XRD result.
3.5. Photoluminescence lifetime
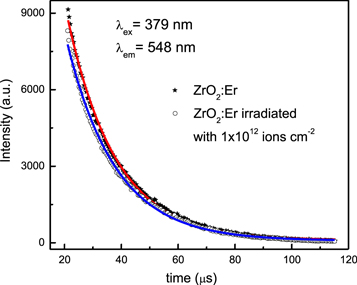
The PL decay curves were measured with fixed excitation and emission wavelengths at 379 and 548 nm respectively to estimate the lifetime at room temperature. Both the 4I15/2 → 4G11/2 (379 nm) and 4S3/2 → 4I15/2 (548 nm) transitions are characteristics of Er3+. Decay curves of pristine and Au ion irradiated ZrO2:Er3+ are shown in figure 8. These decay curves are shown fitted with following empirical relation

where  is the emission intensity at t = 0 and τ is lifetime of the emission. The lifetime of 4S3/2 level of pristine and Au ion irradiated (1 × 10¹² ions cm−2) samples were found to be 16.9 and 71.5 μs respectively. The lifetime of 4S3/2 level in ZrO2:Er3+ is increased after Au ion irradiation. The radiative transition occurs in irradiated sample may due to electronic transitions from the defect states to the valence band in addition to bulk transition [2]. SHI irradiation induced defects are disorderly accumulated in the forbidden energy gap, which enhances the PL decay lifetime [23].
Figure 8. PL Decay curves corresponding to excitation at 379 nm and emission at 548 nm.
Download figure:
Standard image High-resolution image
4. Conclusion
Nanocrystalline ZrO2:Er3+ synthesized by solution combustion method has been studied. The average crystallite size of the monoclinic phase is found to be 57 nm. The grain size of the sample was 70–80 nm as confirmed by FESEM. A PL excitation spectrum shows an intense peak at 379 nm (4I15/2 → 4G11/2). PL spectra show strong green emission (4S3/2 → 4I15/2) and weaker intensity blue and red emission under excitation at 379 nm. The PL emission intensity is enhanced after Au ion irradiation. In the NIR region, there is emission observed at 1531 nm under excitation with 980 nm. Up-conversion PL emission is observed in the green and red regions under excitation of 980 nm through excited state absorption process. The green to red emission ratio is modified with phase transition of the sample. This investigation is helpful in further understanding the effect of SHI irradiation on luminescence properties and mechanisms of up-conversion luminescence in ZrO2:Er3+ nanoparticles.
Acknowledgments
HSL acknowledges with gratitude the Rhodes University Postdoctoral Research Fellowship (PDF No. s1900093). We also thank the pelletron group at IUAC, New Delhi, India, for use of their stable ion beam and Dr G Devarajulu & Prof C K Jayasankar, Dept. of Physics, SV University, Tirupati for PL measurements.