
Abstract
The objective of this study was to determine the effect of processing on the electrical properties and microstructure of MWCNTs/PMMA nanocomposites made by compression molding. Three different mixing methods were used: mechanical, solution, and melt mixing of the same starting materials. The composite microstructures were found to be segregated, agglomerated, and randomly distributed respectively. Electrical property measurements indicate that the mechanically mixed composites have the lowest percolation threshold of 0.05 phr (0.028 vol% MWCNT). Melt mixed composites have the highest percolation threshold of 4 phr (2.161 vol% MWCNT) while solution mixed composites have a percolation threshold of 2 phr (1.102 vol% MWCNT). These results indicate that the segregated microstructure allows for the CNTs to form a percolated network through the composite more easily than the other two methods. Fitted equivalent circuits to the measured impedance spectra show that after percolation the CNTs dominate the electrical properties as represented by an increase in the number of inductance circuit elements. Before or at percolation, the presence of PMMA plays a stronger role in the circuit. This article is novel in that this is the first study where direct comparison of the properties and microstructure of composites fabricated utilizing three different mixing methods using the same source materials can be made.
Export citation and abstract BibTeX RIS

Original content from this work may be used under the terms of the Creative Commons Attribution 4.0 licence. Any further distribution of this work must maintain attribution to the author(s) and the title of the work, journal citation and DOI.
This article was updated on 5 May 2021 to add permission lines to the figures.
Introduction
Carbon nanotube (CNT) composites are important to a wide variety applications such as gas sensors [1], electromagnetic shielding [2], and electrostatic discharge [3]. These composites are usually fabricated using various methods. The approaches include: (1) functionalization of CNTs, (2) varying mixing methods (melt, solution), (3) varying the matrix to CNT ratio, (4) varying the matrix material or (5) varying the CNT characteristics [4]. The carbon nanotubes themselves are chosen often due to their exemplary properties: electrical, thermal, mechanical, and optical. However, the difficulty of using CNTs in composites is their tendency to agglomerate due to their high aspect ratio and strong intermolecular van der Waals forces [5]. As a result, great effort has been made to disperse the CNTs; however, doing so can result in reduction of the electrical properties. In this study, the electrical properties of a series of composites will be evaluated for composites made by three different fabrication methods: mechanical mixing, melt mixing, and solution mixing.
Previous research in our group has included mechanical and solution mixed composites made of various fillers (CNT, silicon carbide, indium tin oxide, barium titanate, and antimony tin oxide) and matrices (polymethyl methacrylate, polystyrene, acrylonitrile butadiene styrene, glass, polyvinylidene difluoride [6–8] as well as some melt-mixed composites [9–11]. Impedance spectroscopy is usually used to determine the correlation between electrical properties, microstructure, and composition. It has been found that when a conductive filler forms a network through an insulating matrix, there is a distinct change in its electrical behavior from insulating to conducting as the concentration of filler increases. The change is called the percolation threshold [12]. Analysis of filler shape and size has also been conducted using micron-, nano-, and whisker SiC filler in a polymethyl methacrylate (PMMA) matrix using the mechanical mixing method [13]. It was found that nano-SiC is best able to segregate to the grain-like boundaries of the PMMA, while the whisker SiC is too large and tends to break out of the boundaries. This is reflected in the percolation thresholds of 2, 7.5 and 10 phr for nano-, micron-, and whisker SiC respectively [13].
Other work conducted includes a comparison between solution and mechanical mixing methods using poly(acrylonitrile-co-butadiene-co-styrene) (ABS) matrix and PMMA with carbon black (CB) filler. The mechanical mixing method resulted in a 0.0054 vol% CB percolation threshold, while the solution method had a percolation threshold of 2.7 vol% CB [14]. Electrostatic force microscopy (EFM) and conductive atomic force microscopy (C-AFM) has shown that in mechanically mixed PMMA/CB at the percolation threshold, the filler accumulates along the edges of the deformed polymer matrix particles [15].
The microstructure is heavily dependent on the processing method used to create the composite. A segregated microstructure results in different electrical properties than a randomly distributed microstructure [16, 17]. For example, randomly distributed microstructures require more MWCNTs to reach percolation than segregated structures[14, 17]. The microstructure also affects other properties such as mechanical or thermal properties. In this paper, the electrical properties will be focused on.
Solution and melt mixing are two common methods that typically lead to a more randomly distributed matrix, while mechanically mixed composites result in segregated microstructures. Previous research on carbon black /PMMA nanocomposites compared the effect of solution mixing and mechanical mixing on the microstructure and electrical properties [14]. It was found that the microstructure was segregated for mechanically mixed samples and randomly dispersed for the solution mixed samples. It was also shown that the percolation was significantly lower for the mechanically mixed (0.26 vol% CB) than the solution mixed (2.7 vol% CB), while simultaneously achieving a lower resistivity [14]. Another study shows that melt mixing of a PMMA/CNT composite resulted in a dispersed microstructure with a percolation threshold of 0.5 vol% CNT [18].
To expand our understanding of how processing affects the electrical and morphological properties of CNT composites, a direct comparison between solution, melt, and mechanical mixing is necessary. Therefore, this paper compares the three methods using the same matrix and filler materials along with developing equivalent circuits to better understand the electrical properties of the composites.
Methodology
Materials used
The matrix material used in this study was polymethyl methacrylate (PMMA) from Buehler's Transoptic Powder. The PMMA used was polydisperse with a particle size in the range of 10−100 μm. Carbon nanotubes were used as the filler. The CNTs were obtained from Cheaptubes.com (nominally 8 nm in outer diameter and 2–5 nm in inner diameter). A TEM image of the CNTs used is shown in figure 1. Analysis of this image and others gave an average outer diameter of 23.76 ± 6.21 nm with a wall thickness of 9.63 ± 1.65 nm. FTIR showed that the CNTs were not functionalized.

Figure 1. Representative TEM image of CNTs used in composites.
Download figure:
Standard image High-resolution imageFabrication of the composites
The PMMA/CNT composites were fabricated using three methods: mechanical, melt, and solution mixing, which are schematically described in figure 2. Mechanical mixing was done using a Flacktek Inc. Speedmixer at 3500 rpm for 10 s. The concentrations used were 0.005, 0.025, 0.0375, 0.05, 0.875, 0.1, 0.15, 0.2, 0.25 phr. Phr (parts per hundred resin) is a measurement of concentration, similar to weight percent calculated according to the equation: PHR = [(mass of filler)/(mass of polymer + mass of filler)] × 100. In this case, the smaller conductive fillers enter the area around the polymer granules to form conductive paths in the grain boundaries, as seen in figure 2(a).
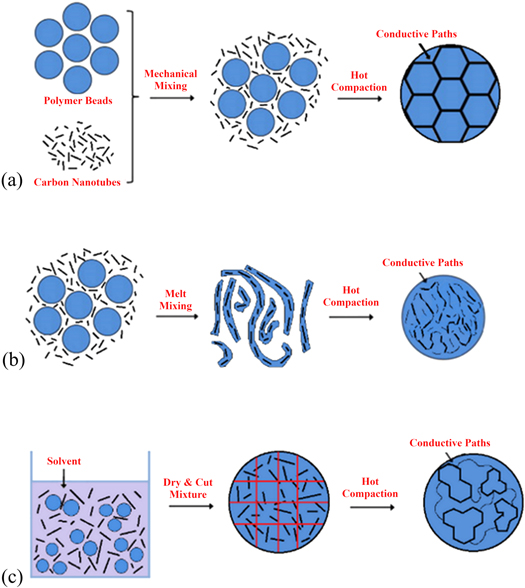
Figure 2. Schematics of fabrication procedure used for (a) mechanical mixing, (b) melt mixing (c) miscible solvent mixing and precipitation. (a) was modified from [19], and (c) was modified from [20]. Reprinted from [19], Copyright (2014), with permission from Elsevier.
Download figure:
Standard image High-resolution imageMelt mixing was accomplished using a DSM 15cc micro compounder (vertical, co-rotating twin-screw micro-extruder) at 225 °C for 3 min after the powder was initially mixed using the speedmixer. The concentrations used were 0.01, 0.1, 0.5, 1, 2, 3, 4, 6, 8, 10, 12, and 15 phr. The resulting strands were then broken and blended into small pieces. The blending allowed for a more homogeneous compound where the conductive paths are more randomly distributed, as shown in figure 2(b).
In solution mixing, the PMMA solvent was ethyl acetate with a solid-to-solvent weight ratio of 1:6 [17]. The speedmixer was run for 20 s repeatedly until the PMMA was dissolved. Then the CNT was added and mixed. The concentrations used were 0.01, 0.1, 1, 1.5, 1.75, 2, 2.25, 2.5, 3, 4, and 5 phr. Lastly, the dispersion was cast into a petri dish and left to dry. When mostly dried, it was cut into small pieces. This process is depicted in figure 2(c), and the process tends to form agglomerates of polymer surrounded by CNTs.
After all mixing methods were completed, two grams of each mixture were compression molded using a Struers Prontopress 2 at 170 °C and 20 kN. The result was pellets of 31.7 mm in diameter and approximately 2 mm in thickness. Pure PMMA samples were made in the Struers Prontopress 2 at 170 °C and 20 kN. Table 1 shows the relationship between phr, weight percent and volume percent.
Table 1. Phr and corresponding weight and volume percents used.
| phr | wt% | vol% | phr | wt% | vol% | phr | wt% | vol% |
|---|---|---|---|---|---|---|---|---|
| 0.005 | 0.005% | 2.81 × 10⁻³ | 0.250 | 0.249% | 0.140 | 3.000 | 2.913% | 1.637 |
| 0.01 | 0.010% | 5.62 × 10⁻³ | 0.5 | 0.498% | 0.280 | 4.000 | 3.846% | 2.161 |
| 0.025 | 0.025% | 1.40 × 10⁻² | 0.875 | 0.867% | 0.487 | 5.000 | 4.762% | 2.676 |
| 0.038 | 0.037% | 2.11 × 10⁻² | 1.000 | 0.990% | 0.556 | 6.000 | 5.660% | 3.181 |
| 0.050 | 0.050% | 2.81 × 10⁻² | 1.500 | 1.478% | 0.830 | 8.000 | 7.407% | 4.162 |
| 0.100 | 0.100% | 5.61 × 10⁻² | 1.750 | 1.720% | 0.966 | 10.000 | 9.091% | 5.108 |
| 0.150 | 0.150% | 8.42 × 10⁻² | 2.000 | 1.961% | 1.102 | 12.000 | 10.714% | 6.020 |
| 0.200 | 0.200% | 0.112 | 2.500 | 2.439% | 1.370 | 15.000 | 13.043% | 7.329 |
Characterization
After the pellets were molded, one sample of each batch was set aside for microstructural analysis and the rest were prepared for impedance spectroscopy. The samples for microstructural analysis were first imaged using a Leica DM IRM inverted microscope. From those samples, mechanically mixed 0.1 phr, melt mixed 10 phr, and solution mixed 2.5 phr were selected for fracture analysis and scanning electron microscopy (SEM) using a Zeiss Ultra60 FE-SEM. They were chosen because they all have about 104 Ωcm resistivity and are toward the end of the percolation point. The samples for impedance spectroscopy were polished then sputtered with silver for 15 min using a Denton Vacuum Desk II turbo sputter coater. Finally, the nanocomposites were tested from 10 MHz—100 Hz using an AC voltage of 500 mV using a Solartron 1260 impedance analyzer and Solartron 1296 Dielectric Interface. ZView was used to analyze the data for circuit fitting.
Results and discussion
Figure 3 displays the impedance magnitude and phase angle versus frequency for all samples made by all three methods. The points shown are an average of at least three samples. For the phase angle graphs, −90° indicates capacitive behavior, 0° indicates resistive behavior, and 90° indicates inductive behavior. In all cases, the samples go from capacitive behavior to inductive behavior as the CNT content increases. For mechanical mixing, figures 3(a)–(b), the change starts at 0.05 phr. It gains resistive behavior until 0.1 phr, where it switches to inductive behavior. The point where it starts to deviate from capacitive behavior is the percolation point where the CNTs are starting to form a conductive network. The same behavior is shown in both the melt and solution mixed samples, starting at 4 and 2 phr, shown in figures 3(c)–(d) and (e)–(f), respectively. The electrical responses for CNT only and PMMA only samples are included on each graph. It can be seen that the mechanically mixed samples come the closest to achieving the value of pure CNT impedance. Since the pure CNT was compressed at 150 MPa and measured in situ, the composites cannot match the tightly compacted CNT network.

Figure 3. Impedance Magnitude and Phase Angle versus Frequency for (a), (b) Mechanically, (c), (d) Melt, and (e), (f) Solution Mixed CNT-PMMA composites. The pure MWCNT was compressed at 150 MPa and measured in situ.
Download figure:
Standard image High-resolution imageFigure 4 shows the percolation curves of the mechanically, melt, and solution mixed CNT/PMMA composites. It also includes the resistivity of pure PMMA (red square point) as a reference. The three methods are all level at about the same resistivity as pure PMMA at the low end of their concentrations, indicating that they are insulating. Mechanically mixed samples are the first to percolate at around 0.05 phr (0.028 vol% MWCNT). The solution mixed samples percolate at 2 phr (1.102 vol% MWCNT), and the melt mixed samples percolate at 4 phr (2.161 vol% MWCNT). This suggests that mechanically mixed samples can form the percolation paths with the CNTs more easily than the other methods. The curve for the melt mixed samples has a reproducible dip in resistivity before percolation occurs. This behavior has been observed on other insulator-conductor composites [7].
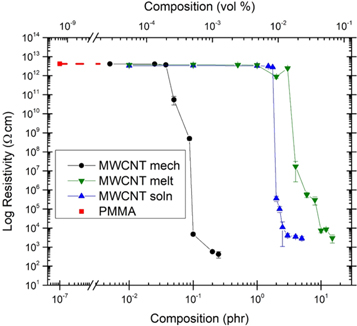
Figure 4. Percolation curves of mechanically, melt, and solution mixed CNT PMMA composites with dashed line connecting to the resistivity of pure PMMA.
Download figure:
Standard image High-resolution imageTo further identify the point of percolation, the percolation theory was applied [21]. Figure 5 was generated using the resistivity data and the general form of a percolation equation shown in equation (1).

where PM is the property of the mixture, A is a constant, p is the probability of a site (or bond) being filled, pc is the percolation threshold, and s is an exponent. p and pc can be thought of in terms of composition (volume% or phr). In the case of MWCNT/PMMA composites, p is the composition of the MWCNT while pc is the MWCNT composition required to achieve percolation.

Figure 5. Percolation Theory fits for (a) mechanically, (b) melt, and (c) solution mixed MWCNT/PMMA sample percolation curves shown in figure 4.
Download figure:
Standard image High-resolution imageFrom this method of calculation, the percolation thresholds are obtained as 0.087 phr for mechanically mixed, 1.92 phr for solution mixed, and 3.5 phr for melt mixed, which are close to our previous estimates.
Figure 6 contains optical images of the samples before, at and after percolation for the samples made by the three different mixing methods. When comparing between the three methods, it is apparent that they form distinctly different microstructures. In figures 6(a)–(c), the mechanically mixed samples have segregated microstructures with clearly defined grain boundaries, whereas the melt mixed samples, in figures 6(d)–(f), have a randomized microstructure. Lastly, the solution mixed samples show large aggregates in the microstructure, figures 6(g)–(i).

Figure 6. Topography of CNT/PMMA composites taken using an inverted microscope, (a)–(c) Mechanical, (d)–(f) Melt, and (g)–(i) Solution mixed displayed before, at, and after percolation.
Download figure:
Standard image High-resolution imageSEM topographical and fracture surfaces from samples that had 104 resistivity (directly after percolation) for all three methods are shown in figure 7. This again shows the difference in the microstructures obtained by the three different fabrication methods. The mechanically mixed samples have clear grain boundaries. When looking at the fracture surface, it can be seen that the CNTs were segregated to the boundaries. Whereas in the melt mixed samples, CNTs are visible on both surfaces and the polymer is mixed with the CNT creating a random distribution. Lastly, the solution mixed samples formed agglomerates of CNT/PMMA which left the immediate area around the agglomerate deficient in CNT.
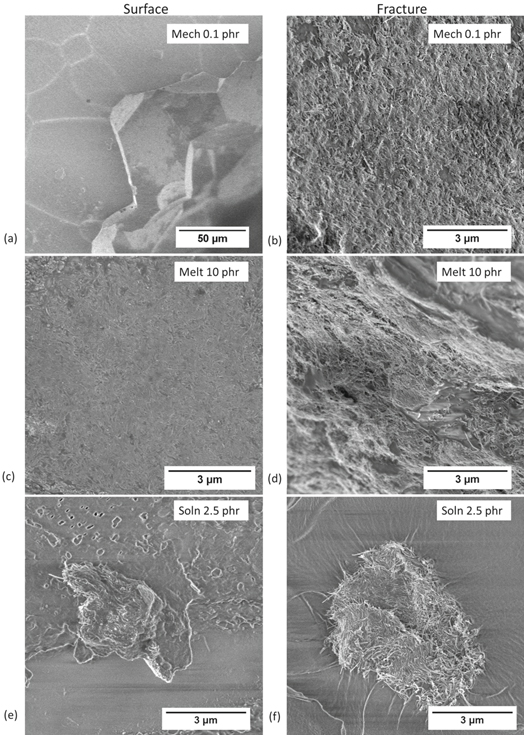
Figure 7. Surface and fracture SEM images of PMMA composite samples that had already percolated and had the same resistivity of 104 Ω-cm, (a), (b) 0.1 phr mechanically mixed sample, (c), (d), 10 phr melt mixed sample and (e), (f) 2.5 phr solution mixed sample.
Download figure:
Standard image High-resolution imageEquivalent circuits were generated for before, at, and after percolation samples of each mixing method. Table 2 contains the circuit element values along with the representative equivalent circuits. Circuit (a) represents before and at percolation samples and circuit (b) represents the above percolation situation. RCNT and LCNT represent the material/intraparticle behavior of the CNTs, while the R1/CPE1 and R2/CPE2 parallel RC circuits in series represent the main conducting path which should be dominated by the interfacing between CNT particles. RPMMA and CPEPMMA account for the edge of the network and PMMA matrix where the PMMA has separated the CNTs and therefore causes increased resistance. This model has been used previously for segregated glass composites and has been modified to suit the materials used here [22].
Table 2. Equivalent circuit fits for before, at and after percolation for CNT/PMMA composites made by mechanical, melt, and solution mixing along with the equivalent circuits. The different compositions have the same resistivity for the three different ranges of the percolation curve.
|
Circuit (a) works well for the mechanically mixed samples made and characterized in this study. Fitting the same circuit to the dispersed and aggregated microstructures obtained by melt mixing and solution mixing shows that it can also be used as it explains the connection between the microstructure and electrical properties of conducting filler/insulating matrix composites when they are before percolation or just beginning to percolate. This is because the equivalent circuit represents the key contacts for the conducting path: the CNT inherent conductance, the contact between the CNTs, and the PMMA located between the CNTs. The contact resistance between CNTs (R1 and R2) decreases with the increase in CNT contact points. The increase in CNTs means there are more contact points and therefore more paths for the current to pass through. The circuit elements that represent the CNT (LCNT and RCNT) and PMMA that gets between the CNT (RPMMA and CPEPMMA) remain about the same with the solution mixed decreasing the RPMMA resistance.
After percolation, the electrical properties are dominated by the CNT network and are represented by circuit (b) shown in table 2. The intraparticle behavior of R1/CPE1 and R2/CPE2 is still represented. However, the numerous pathways for the current to pass through causes inductance to play a much larger role in this case. This is not surprising since more conductive materials often show inductive behavior [23]. More detailed analysis of the specific samples will be illustrated in a future publication.
Figure 8 shows the application of the equivalent circuits to before, at and after percolation data for each mixing method. It can be seen on the phase angle versus frequency plots that the fitted lines match well with the data.

Figure 8. Equivalent circuit fits for before, at and after percolation of CNT/PMMA composites for mechanically, melt, and solution mixed samples.
Download figure:
Standard image High-resolution image
It is important to compare the results of this paper with results in the literature in order to understand the overall patterns and trends of PMMA / graphitic filler composites. Table 3 shows comparisons from the literature on percolation, maximum conductivity, and microstructure for mechanically, melt, and solution mixed PMMA composites containing graphitic fillers (CB, Graphene, MWCNT, or SWCNT). All mechanical mixing composite samples included here were done by the same research group [17, 24–26]. The lowest percolation obtained for mechanical mixing is 0.05 wt% from this paper and matches past work done by the same group [24], although there were slight differences in compression molding temperature and molecular weight of the polymer which can affect these properties [6].
Table 3. Review on mechanically, melt, and solution mixed PMMA/graphitic filler composites.
| Mechanically Mixed PMMA/ Graphitic Filler Composites | ||||||||
|---|---|---|---|---|---|---|---|---|
| Filler | Diameter, Length or D/L | Pressing Temp (°C) | ΦC [wt%]a | σmax [S/m]b | Microstructure | References | ||
| MWCNT | OD: ∼ 20 nm | 170 | 0.05 | 0.237 @ 0.249 wt% | Segregated | This paper | ||
| L: 0.5–2 μm | ||||||||
| CB | D: 21 nm | 170 | 0.46 | 0.01 @ 11.62 wt% | Segregated | [17] | ||
| MWCNT | OD: ∼ 20 nm | 170 | 0.1 | 0.495 @ 0.99 wt% | Segregated | [25, 26] | ||
| L: 0.5–2 μm | ||||||||
| MWCNT | OD: ∼ 20 nm | 150 | 0.05 | 1.2723 @ 4.76 wt% | Segregated | [24] | ||
| L: 0.5–2 μm | ||||||||
| MWCNT | OD: 8–15 nm | 170 | 0.6 | 2.406 × 10⁻² @ 2.53 wt% | Segregated | [24] | ||
| L: 10–50 μm | ||||||||
| MWCNT | OD: 8–15 nm | 150 | 0.5 | 2.0704 @ 4.76 wt% | Segregated | [24] | ||
| L: 10–50 μm | ||||||||
| Melt Mixed PMMA/Graphitic Filler Composites | ||||||||
| Filler | Diameter, Length or D/L | Φc [wt%]a | σmax [S/m] b | Microstructure | References | |||
| MWCNT | OD: ∼ 20 nm; L: 0.5–2 μm | 3.85 | 0.0336 @ 13.04 wt% | Dispersed | This paper | |||
| MWCNT | Unknown | 8.5–10 | 2.083 × 10⁵ @ 10 wt% | Dispersed | [27] | |||
| MWCNT | D: 9.5 nm; L: 1.5 μm | 0.88 | 50 @ 8 wt% | Dispersed | [28] | |||
| MWCNT | D: 2–10 nm; L: <1 μm | 0.5 | 1 × 10⁻⁵ @ 1 wt% | Dispersed | [18] | |||
| MWCNT | D: 6–20 nm; L: 1–5 μm | Not reached | 6.67 × 10⁻¹⁵ @ 6 wt% | Dispersed | [18] | |||
| MWCNT | D: 10–30 nm; L: 1–10 μm | 7.75 | 1 × 10⁻⁴ @ 9 wt% | Dispersed | [18] | |||
| MWCNT | D: ∼10 nm; L: <1 μm | Not reached | 1 × 10–14 @ 6 wt% | Dispersed | [18] | |||
| CB | D: 35 nm | 3.28 | ∼10–3 @ 11.23 wt% | Unknown | [29] | |||
| CB annealed | D: 35 nm | 2.1 | ∼10–3 @ 11.23 wt% | Unknown | [29] | |||
| Solution Mixed PMMA/ Graphitic Filler Composites | ||||||||
| Filler | Diameter, Length or D/L | PMMA size | Solution | Dispersion | ΦC [wt%]a | σmax [S/m] b | Microstructure | References |
| MWCNT | OD: ∼20 nm | 10–100 μm | Ethyl acetate | Speedmixed | 1.96 | 0.345 @ 2.68 wt% | Agglomerated | This paper |
| L: 0.5–2 μm | ||||||||
| MWCNT (CVD) | Unknown | Unknown | C8H18O4 | Stirred, spincoated | 0.084 | 200 @ 1.5 wt% | Dispersed at short spin times, Agglomerated at long spin times | [30, 31] |
| MWCNT | 1000 | Unknown | C2HF3O2, C4H8O | Sonicated | 0.12 | 0.8 @ 1.5 wt% | Dispersed with some aggregates | [30, 32] |
| SWCNT | Unknown | Unknown | CHCl3, SOCl2 | Stirred | 0.17 | 1 × 10⁴ @ 10 wt% | Unknown | [30, 33] |
| SWCNT | Unknown | Unknown | CHCl3 | Stirred | 0.17 | 2000 @ 10 wt% | Unknown | [30, 33] |
| MWCNT (CVD) | Unknown | Unknown | C7H8 | Sonicated, stirred | 0.2 | 100 @ 10 wt% | Unknown | [30, 34] |
| SWCNT (Arc) | Unknown | Unknown | C7H8 | Sonicated | 0.33 | 50 @ 8 wt% | Unknown | [30, 35] |
| SWCNT | 45 | Unknown | C6H8O, HCl, CH4O, annealed | Sonicated, H2O (coagulation), hot pressed | 0.37 | 0.05 @ 2 wt% | Unknown | [30, 36] |
| SWCNT | Unknown | Unknown | C6H8O, HCl | Sonicated, H2O (coagulation), hot pressed | 0.39 | 1 × 10⁻³ @ 2 wt% | Agglomerated | [30, 37] |
| SWCNT (Arc) | >1000 | Unknown | C6H8O, HNO3 | Sonicated, wet-stretched, hot pressed | 0.5 | 0.1 @ 7 wt% (parallel) | Aligned in stretching direction | [30, 38] |
| SWCNT (Arc) | >1000 | Unknown | C6H8O, HNO3 | Sonicated, wet-stretched, hot pressed | 0.5 | 1 × 10⁻⁵ @ 7 wt% (perp.) | Aligned in stretching direction | [30, 38] |
| MWCNT | 100 | Unknown | C2HF3O2, C4H8O | Sonicated, centrifugated | 0.65 | 0.08 @ 1.5 wt% | Dispersed with some aggregates | [30, 32] |
| SWCNT | Unknown | Unknown | C6H8O, HCl, CH4O, annealed | Sonicated, H2O (coagulation), hot pressed | 1.3 | 0.01 @ 2 wt% | Agglomerated | [30, 39] |
| SWCNT | Unknown | Unknown | CHCl3, SOCl2 | Shaken, sonicated | < 0.1 | 50 @ 0.5 wt% | Unknown | [30, 40] |
| MWCNT | 1000–1600 | 20 μm | MeOH | Sonicated | 0.051 | 0.1 @ 3 wt% | Segregated | [16] |
| MWCNT | 1000–1601 | 20 μm | DMF | Sonicated | 0.0095 | 500 @ 3 wt% | Segregated | [16] |
| MWCNT | 1000–1602 | 20 μm | DMF, MeOH | Sonicated | 0.45 | 0.01 @ 3 wt% | Random distribution | [16] |
| CB | D: 21 nm | 5–100 μm | Ethyl acetate | Sonicated, stirred | 5.01 | 16.67 @ 11.22 wt% | Agglomerated | [17] |
| Graphite | D: 500 μm | Chloroform (CHCl3) | In situ polymerization, sonication | 0.55 | 0.01 @ 11.22 wt% | Random distribution | [41] | |
| MWCNT | Unknown | Unknown | SDS | Sonicated, ice bath, Latex Technology | 0.3 | 10 @ 1.6 wt% | Unknown | [42] |
| SWNT | Unknown | Unknown | SDS | Sonicated, ice bath, Latex Technology | 0.2 | 10 @ 1.6 wt% | Unknown | [19, 42] |
| RGO | Unknown | Unknown | Latex technology | 0.28 | 0.6 @ 4.88 wt% | Segregated | [16, 19] | |
| MWCNT | D: 10–20 nm | 20 μm | DMF | Sonicated, stirred | 0.0099 | 500 @ 3 wt% | Segregated | [43] |
| L: mm to cm | ||||||||
| MWCNT | D: 10–20 nm | 10 μm | DMF | Sonicated, stirred | 0.0483 | 400 @ 3 wt% | Segregated | [43] |
| L: mm to cm | ||||||||
| MWCNT | D: 10–20 nm | 5 μm | DMF | Sonicated, stirred | 0.149 | 300 @ 3 wt% | Segregated | [43] |
| L: mm to cm | ||||||||
a Converted to wt% from published values for ease of comparison. b Converted to S/m from published values for ease of comparison.
For the melt mixed composites, table 3 shows that percolation falls between 0.5 and 10 wt% and that the diameter to length ratio plays an important role. The lowest percolation was achieved by McClory et al with 0.5 wt% in a study on how CNT geometry and functionality affect the electrical properties [18]. This paper achieved percolation at 3.85 wt% with larger nanotubes than McClory et al used and obtained the second highest max conductivity.
Solution mixing was by far the most common method to make the composites and also shows the most variation in procedure. The lowest percolation achieved was 0.0095 wt% using DMF and sonication with monodispersed PMMA [16]. Ryu et al also had a second publication with the same low percolation [43]. The range for percolation was from 0.0095 wt% to 5.01 wt%. This paper's solution mix percolation was 1.96 wt%.
Two important properties to note regarding the PMMA are whether the PMMA is mono- or poly- dispersed and the size of the PMMA. Monodispersed PMMA produces lower percolation thresholds than achievable by using the same method with polydispersed PMMA [44]. Larger sized PMMA (or higher size ratio between matrix and filler) result in lower percolation thresholds [43]. The PMMA of this work is polydisperse, and therefore would achieve even lower percolation if monodisperse PMMA was used. It can be seen in the Solution Mixed section of table 3 that many investigators do not report the size of the PMMA despite it having an impact on the resulting properties.
Conclusion
The processing method used to make a composite is integral in determining the resultant microstructure and properties. This study has compared three different mixing methods for the fabrication of MWCNT/PMMA nanocomposites for the first time. Each method resulted in a different type of microstructure, which affected the electrical properties. Impedance spectroscopy was used to determine the percolation thresholds to be 0.05 phr (0.028 vol% MWCNT), 2 phr (1.102 vol% MWCNT), and 4 phr (2.161 vol% MWCNT) for the mechanically, solution, and melt mixed samples, respectively.
Percolation theory was used to get a more accurate measure of the percolation thresholds and resulted in values of 0.087 phr, 1.92 phr, and 3.5 phr for the mechanically, solution, and melt mixed samples, respectively. The segregated microstructure of the mechanically mixed composites required fewer MWCNTs to be used to achieve formation of the percolated network. Equivalent circuits were generated for data before, at, and after percolation for each of the three mixing methods. It was found that the circuit fitting matches a model previously generated for other insulator-conductor composites for the before and at percolation samples for all three mixing methods but that for those above percolation, it was necessary to include the resistance and capacitance parallel circuit elements to model interparticle interactions along with more inductance elements as the amount of CNT connections increased.
Overall this study has shown that when considering electrical properties, mechanically mixed CNT/PMMA nanocomposites are able to produce a conductive network while using only a very small amount of MWCNT. This may lead to a reduction in production cost for CNT based technologies. The direct comparison between three mixing methods using the same matrix and filler materials along with the development of equivalent circuits expands our base knowledge of composite tailorability for different applications.
Acknowledgments
This work was funded by the National Science Foundation DMR 1207323 grant and Georgia Tech Research Corporation (GTRC) Intellectual Property 1806K98. Dr Kyriaki Kalaitzidou and Dr Paul Russo at Georgia Institute of Technology are acknowledged for allowing use of the DSM 15cc micro compounder for melt mixing and determination of molecular weight of PMMA respectively. Anastasia Mullins is thanked for assistance with figure 2 schematics.