
Abstract
Multiple drug resistance is a key limitation for the clinical administration of chemotherapeutic drugs, apart from this their major limitations with free drugs are poor solubility, physiochemical and pharmaceutical behavior. These limitations with free drugs can be overcome by nanoformulations using natural biopolymer. In this study, successful utilization of P-glycoprotein receptor for the delivery of anticancer drug quercetin (Q), encapsulated inside the lipid nanocarriers (LNs) was introduced for the treatment of breast cancer. Bovine serum albumin (BSA) was conjugated on the Q-loaded LNs( BSA-Q-LNs) for targeting to receptor. Q-loaded LNs were prepared using a single emulsion solvent evaporation method, followed by surface modification of Q-loaded LNs using charge interaction. Finally, surface modified Q-loaded LNs were conjugated with BSA using thiol reaction. The formulated nano construct was a spherical structure with a shell size of 530 nm. Encapsulation of Q inside the matrix of LNs is confirmed from shift in FT-IR, XRD peak. The release kinetic of Q- loaded LNs formulation was best fitted in a first-order kinetic model suggesting early burst of Q followed by slow release. The entrapment efficiency and drug loading efficiency were found to be 76 ± 0.3% and 15.72 ± 0.7% respectively. The Q-loaded LNs and BSA-Q-LNs displayed the improved cytotoxicity in drug resistance human breast cancer cell line (MCF-7) as compared to free Q.
Export citation and abstract BibTeX RIS

Original content from this work may be used under the terms of the Creative Commons Attribution 4.0 licence. Any further distribution of this work must maintain attribution to the author(s) and the title of the work, journal citation and DOI.
Introduction
The majority of anticancerous drugs have restrictions in clinical applications because of their poor solubility, and also show physiochemical and pharmaceutical behavior. The solubility of the drug can be improved by adding the adjuvant but when the drug is applied intravenously, the adjuvant may show adverse effects. These complications can be overcome using nanoformulation through biocompatible natural polymer (Allen et al 1991). In various studies, numerous biopolymers such as chitosan, gelatin, protein, polysaccharide, PLGA, and lipid are used for drug delivery application. Lipid nanocarriers (LNs) have the potential to solubilize, encapsulate, and deliver several bioactive drugs including anticancer drugs (quercetin, doxorubicin, and mitoxantrone) in a planned manner to achieve the accumulation of drugs inside the cancerous cells (Yaghmur and Glatter 2009). The LNs have advantages such as constant release of drug, and biodegradability at high efficiency (Ramasamy et al 2014). In addition, lipid-based formulations containing cytotoxic agents, prevent passive diffusion of encapsulated drugs into healthy cells and as a result circulation time increases. Moreover, lipid nanocarrier have been formulated to reduce the toxic effect of drugs in different organs by varying its biodistribution and pharmacokinetics. However, LNs have quick opsonization when taken by the reticuloendothelial system (Palei et al 2018). This problem has been resolved by lipid grafted with maleimide. The modification of the lipid surface by the maleimide in the stepwise manner (Ji et al 2009), makes them stealth drug carrier (lipid) barren of long circulatory in nature & opsonization. The LNs are used as a matrix material for drug encapsulation and can be chosen from a variety of lipids, including phospholipids, cholesterol and triglycerides (Chuang et al 2018). The amphiphilic nature of phospholipid allows to form organised structure, such as carriers when hydrated in aquous environment (Zhu et al 2015). The polymerization of phospholipid monomer is dependent on transition temperature, this is the temperature at which the lipids undergo fluidic conversion. (Mozafari 2010).
The substantial progress towards the use of LNs in cancer therapy is the exploitation of the expressed receptors on the cancer cells through anchoring the receptor-mediated ligand to decorate the surface of LNs . Malignant cells generally overexpress receptor-like epidermal growth factor (EGFR), folate receptor (FR), estrogen receptor (ER), and P-glycoprotein receptor (Palei et al 2018) showing greater affinity towards ligand. Thus, the efficacy of LNs can be improved more by targeting cancerous cells with the ligand anchored LNs followed by the receptor-mediated endocytosis of ligand decorated LNs. Further, various ligands (fucose, mannose, sialic acid, hyaluronic acid, and BSA) can be used for surface decoration to target the receptor expressed on cancerous cells. (Jain et al 2010). The glycoprotein receptor expressed on the cancerous cell, specific for BSA. The targeting of BSA anchored liposome to the glycoprotein expressed cancerous cells may be an attractive approach.
In the background of drug delivery for the treatment of cancer, quercetin (Q) is most widely used anticancerous drugs. The chemical structure of Q counteracts the damage caused by free radicals in the living cells of our body. The cancerous cells are suppressed owing to the scavenging activity of the free radicals. In addition, Q is also known to have the capability to inverse the MDR pathway along with chemopreventive assets. Moreover, Q is also stated to impede the tyrosine kinase pathway, CYP 450 of enzyme cox protein resulting in the modulation of signal transduction and apoptosis (Patten and Yang, n.d.).
Our interest is to deliver the Q in a site targeted and controlled manner through the BSA conjugated surface-modified quercetin-loaded lipid nanocarriers. In the present investigation, the construction of a lipid-based nanocarriers for targetted drug delivery was made, (see figure 1). In construction, Q was encapsulated inside the lipid core. Maleimide was functionalized on the surface of LNs through pegylated phospholipid. BSA was conjugated to anchored maleimide through thiol-maleimide bond (Gindy et al 2008).

Figure 1. Development of BSA decorated quercetin- loaded lipid nanocarrier.
Download figure:
Standard image High-resolution imageThe BSA conjugated Q-loaded LNs (BSA-Q-LNs), increased circulation time and capable of targeted delivery of Q to P-glycoprotein expressed cancerous cells. The in-vitro cytotoxicity BSA-Q-LNs were investigated and compared with the Q- loaded LNs (Q-LNs) as well as free Q. Various natural polymer mediated drug delivery and their efficacy in the breast cancer cell line (MCF- 7) were reported (Lim et al 2000) (Vodovozova et al 2000).
Materials
L-α-phosphatidylcholine(soybean), quercetin, 4-dimethylamino pyridine (DMAP), dichloromethane (CH2Cl2), BSA and pyridine were purchased from Sigma-Aldrich. Dipalmitoyl phosphatidylethanolamine-polyethylene glycol 2000 (DPPE-PEG2000) was purchased from Nanocs Inc. Chloroform used was of analytical grade from Sun Traders. Phosphate buffer from Sigma- Aldrich was used. Human breast cancer cell line MCF-7 was taken from NCCS Pune and Eagles minimum essential medium (MEM), fetal calf serum (FCS 10), streptomycin (1 mg ml−1), penicillin (100UI/ml) trypsin and EDTA solutions were taken from Merck. 3-(4,5-dimethylthiazol-2-yl)-2,5diphenyltetrazolium bromide (MTT) dye test (TLC purity p97.5%), dimethyl sulfoxide (DMSO) were purchased from Sigma—Aldrich. All reagents and solvents used in this work (unless specified) are either of HPLC grade or analytical grade.
Preparation of Q-loaded LNs
The Q-LNs were prepared using a single emulsion solvent evaporation technique (G. Nava-Arzaluz et al 2012) as mentioned in figure 2(a). Phosphatidylcholine and pegylated phospholipid (DPPE-PEG2000) were taken in a ratio of 4:1, (wt./wt). This mixture was liquified with Q (1mg/2ml) in chloroform. Subsequently, this solution slowly hydrated with a 5% aqueous solution (8ml) containing 0.9% saline, 5% dextrose, 10% sucrose, and distilled water, using a syringe at the transition temperature 40 °C, 60 °C, and 70 °C respectively. This emulsion was stirred for four hours at 25 °C on a magnetic stir plate for evaporation of the organic solvent. The resulting solution was sonicated using a probe sonicator (model no. UP/200S; power input 50 watt) over an ice bath for (3 min; 30% amplitude). The formed Q-LNs were recovered by ultracentrifugation at (10000 rpm, 7828 g) for 20 min at 4 °C. The purified Q-LNs were washed using Milli-Q water to remove unbound excess aqueous solution and free quercetin. The formed Q-LNs were frozen by slow freezing. Initially, the formed Q-LNs were kept inside a freezer at 4 °C for five hours and after that, it was kept in a deep freezer at -20°C for another five hours. Subsequently, the nanocarriers were freeze-dried using lyophilizer (Labconco, catalog no. 7740060) at pressure (0.020 millibar) for 2 days to get the powdered form of Q-LNs.
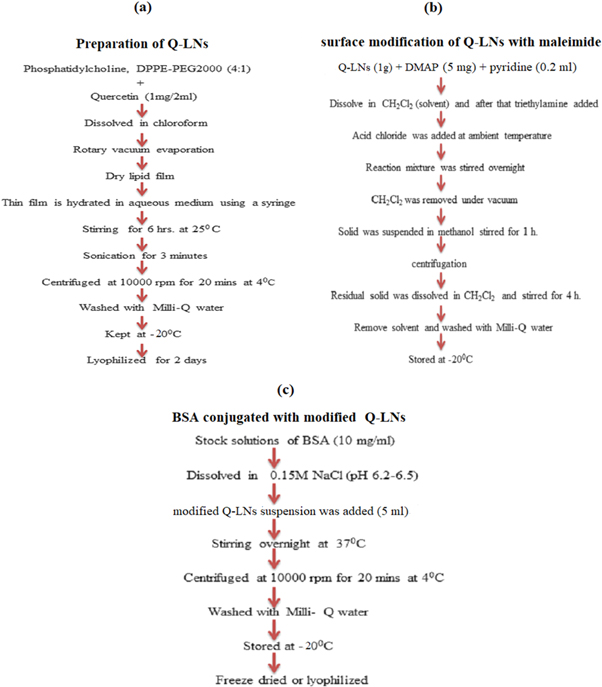
Figure 2. flow diagram (a) synthesis of Q-loaded LNs (b) surface modification of Q-loaded LNs with maleimide (c) BSA conjugated with modified Q-LNs.
Download figure:
Standard image High-resolution imageSurface modification of Q-LNs with maleimide
The formed Q-LNs containing polyethylene glycol (1.0 g) were liquified in 10 ml of CH2Cl2 (Paliwal et al 2010). DMAP (6 mg) and pyridine (0.2 ml) were added with 132 mg of acid chloride (3-chloro-2,5-dioxo-1 pyrrolidinepropanoyl chloride, was previously prepared using the method reported by (Ji et al 2009) at ambient temperature. Then, the reaction mixture was stirred for 4 h and dichloromethane was evaporated and takes a solid form. Further, this solid was suspended in methanol and stirred for another one hour followed by centrifugation (10000 rpm, 7828 g) and supernatant was decanted. Triethylamine was added into the resulting mixture and stirred for 4 h for removal of the solvent. Finally, maleimide functionalized with Q-LNs were purified using ultracentrifugation, as illustrated in figure 2(b).
Preparation of BSA conjugated with modified Q-LNs
Maleimide functionalized Q-LNs were conjugated with BSA through thiol reaction in which C1 carbon of maleimide makes abound with the thiol group of BSA (see figure 3). All reaction mixture was evaporated under vacuum at 25 °C using a rotary evaporator to remove any residual. The resulting solution was degassed by bubbling nitrogen for approximately 30 min. Standard solution of BSA (1 mg ml−1) in degassed 0.1M NaCl (pH 6.2-6.5) was prepared formerly. Modified Q-LNs (5 ml) were incubated overnight at 37 °C with a suitable volume of BSA stock solution under constant agitation in a shaker, at 180 rpm. The formed BSA-Q-LNs were recovered by centrifugation at 10000 rpm, 7828 g for 20 min at 4 °C and washed using Milli-Q water to remove unbound BSA. Resulting formulations were freeze-dried through lyophilizer at pressure 0.020 millibar. The flow diagram of the proposed approach for the preparation of BSA-Q-LNs is represented in the figure 2(c).
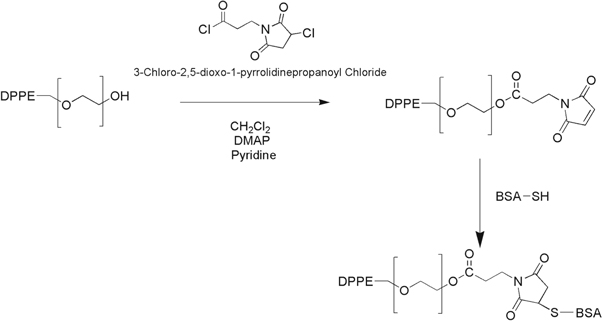
Figure 3. Chemical reactions for maleimide functionalization and BSA conjugation.
Download figure:
Standard image High-resolution imageDrug encapsulation efficiency/drug loading efficiency
The encapsulation efficiency E (%) and loading efficiency L (%) of Q-LNs were determined using UV-spectrophotometer (Fry et al). The Q-LNs (5mg) were soaked with phosphate buffer saline(pH.7.4) for 30 min. The whole solution was centrifuged at 10000 rpm, 7828 g for 10 min to separate unentrapped Q. The entrapped Q was determined by disrupting the lipid matrix with TritonX-100. The amount of Q collected were measured using UV-spectrophotometer. The E(%) was calculated by the following equation:

The loading efficiency (L%) was calculated by the following equation:

Scanning electron microscope (SEM) studies
The surface features of void LNs , Q-LNs and BSA-Q-LNs were carried out by SEM ((Evo-Scanning Electron microscope MA15/18) operation at an accelerating voltage of 20.00 kV. A few drops of void LNs, Q-LNs, and BSA- Q-LNs suspensions were dried separately on a small rectangular glass cover, then coated with gold to make them conductive and placed on a copper stub prior to achievement of SEM image.
Particle size measurement
Nanoparticle analyzer (Malvern Paralytical Zetasizer Nano 486) was used to measure the size of the particles. The nano ZS incorporates non- invasive backscatter (NIBSTM) optic that was used for size measurement. For the turbid sample, the detection angle was 173° which enabled the size measurement. To determine the particle size, a dilute suspension of void, Q-loaded, and BSA anchored Q-loaded LNs (200 μg ml−1) was set in Milli-Q water. Each was sonicated on an ice bath for one minute and then subjected to measurement of hydrodynamic diameter (nm). All the experiments were performed in triplicate.
Fourier transformed infrared spectroscopy (FT-IR)
FT-IR analysis was performed using model, Nicolet iS5. This analysis was conducted to verify the presence of various functional groups in lipid, Q, and BSA. During the experiment, the dried solid samples (1% by weight) were crushed to mix with potassium bromide and then pressed to make a pellet. Spectra were recorded for each sample at a spectral range between 4000 and 400 cm−1.
In vitro release kinetics study
The dissociation of Q from LNs was performed by dissolving 4 mg of lyophilized Q loaded LNs in 2 ml of phosphate buffer saline solution (pH.7.4) which contains 0.1% v/v NaN3 to maintain a sink condition. The Q-LN suspension was equally divided into three tubes, each tube had 2 ml of solution because the experiment was performed in triplicate. This suspension was kept in the incubator shaker at 37 °C, 150 rpm for 12 days. The suspension was taken every day from these tubes and centrifuged at 10000 rpm, 7828 g, 4 °C for 10 min. Pellet was taken, 2 ml of fresh PBS/NaN3 solution was added to each test tube for next interpretations. The obtained supernatant was lyophilized at pressure 0.02 millibar and dissolved in 2 ml of DMSO. The solution was centrifuged at 10000 rpm, 7828 g for10 mins to collect the drug in the supernatant. The amount of Q collected was measured using UV- spectrophotometer.
XRD (x-ray diffraction study)
X-ray diffraction analysis (Shashidhar and Manohar 2018) was performed to observe the crystalline structure of void, and Q loaded LNs using a (MiniFlex2 goniometer, Rigaku, Tokyo) with Cu Kα radiation, operating at 30kV/ 15mA. All the parameters were made at room temperature within the 2 theta range of 2°−80° at a speed of 1° min−1.
Cell culture
Breast cancer cell line (MCF-7) was obtained from NCCS, Pune, India. Cells were cultivated in DMEM media comprising 10% FBS, 2mM glutamine, 1mM sodium pyruvate, 100 U/ml penicillin, 100 μl ml−1 streptomycin and 50 μmolar 2-mercapto ethanol in co2 incubator with 5% co2 at a 37 °C.
MTT assay
Cell viability of MCF-7 was evaluated using 3-(4,5-dimethylthiazol-2-yl)-2,5- diphenyltetrazolium bromide (MTT) assay (Di Meo et al 2015). The free Q, Q-loaded LNs, and BSA conjugated Q-LNs were liquefied in DMSO to get a concentration of 10 micrograms per ml. The stock solution was kept at −20 °C. All suitable working concentration in cell culture medium were prepared immediately prior to use. Viability of all Q derivatives were assayed using monolayer culture. MCF-7 cells (1 × 10⁴ cells/well) were seeded out in 96- well-tissue plates properly and cultured for 3 days. Then the cells were washed once in PBS. The washed cells were treated with free Q and using different concentrations of Q Viz.0.5, 1, 2.5, 5 and 10 micrograms per ml in Q-LN and BSA-Q-LN. They were incubated for 4 days.
All the free Q, Q-LNs and BSA-Q-LNs were removed and 10 μl of MTT solution (0.5 mg ml−1) was added to each well. Finally, 150μl DMSO (0.1%–0.5%) was added to dissolve the formazan crystals. Absorbance was evaluated using spectrophotometer at 540 nm.
Intracellular distribution of free Q, Q-LNs, and BSA-Q-LNs
The intracellular distribution of free Q, Q-loaded LNs, and BSA conjugated Q-LNs were assayed by using ZEISS LSM780 confocal microscopy. Cells were grown in 12 well plates at density 4 × 10⁴ cells per well and cultured for 24 h. The media was removed and fresh media containing Q, Q-LNs, and BSA-Q-LNs were added with Q concentration of 10 μg ml−1. The treated cells were incubated for 4 days. After that, the incubated cells were swept away with PBS solution thrice and then cells were immobilized with 4% paraformaldehyde for 10 min.
DAPI staining
DAPI staining protocol was followed by the modified procedure (Rashmi et al 2003). Paraformaldehyde (3%) was applied for treated MCF-7 cells. Cells were permeabilized with 0.2% Triton X-100 in phosphate-buffered saline (PBS). 20 μl of 5 mg/ml of DAPI was added into each sample and air-dried. Samples were visualized by ZEISS LSM780 confocal microscope.
Propidium iodide (PI) staining
PI staining protocol was exploited for the evaluation of intracellular localization of Q inside the MCF-7 cells. It was permeabilized with a blend of acetone: methanol (1:1,vol/vol) at 37 °C for 10 min. Then PI (10 μl) was added to each sample and fixation was done by air drying. It was detected beneath ZEISS LSM780 confocal microscopy.
Results and discussion
Drug encapsulation efficiency/drug loading efficiency
SEM analysis
SEM images of the void and Q-loaded LNs are shown in figures 4(a), (b), which confirmed the successful formation of LNs by the single emulsion solvent evaporation method. It is observed that the surface morphology of the Q-LNs significantly changed by Q loading. In this study, 76% of Q was loaded inside the LNs results in shifting of void LNs from smooth to rough surface. The SEM image of BSA conjugated Q-loaded LNs is represented in figure 4(c). From the image, it is revealed that the morphology of the formulation changed, evidencing the successful conjugation of BSA with Q-LNs. The SEM image BSA conjugated Q-loaded LNs is validated using reported image of surface-modified LNs (Mishra et al 2019) and (Sana et al 2017).
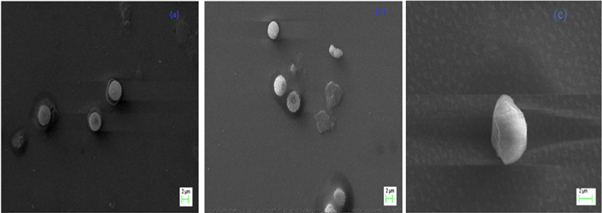
Figure 4. SEM image of (a) void LNs (b) Q-loaded LNs (c) BSA conjugated Q-LNs.
Download figure:
Standard image High-resolution imageEffect of transition temperature ( ) on the morphology of LNs

In the present study, the transition temperature ( ) is optimized. In figure 5(c), it is clearly seen that at temperature 60 °C, the shape of the LNs is spherical whereas at 40 °C (see figure 5(a)) the shape of LNs is irregular. The lipid monomer is trying to attain spherical shape at 50 °C (see figure 5(b)). The phase transition temperature of phospholipid is mainly depended on the polar head group, acyl chain length, degree of saturation of hydrocarbon, and nature and ionic strength of suspension medium (Mozafari 2010). Apart from this, the fluidity is an important factor in the formation of spherical LNs. If the temperature is lower than
  the fluidity of phospholipid decreased and formed a jelly-like structure. However for temperate more than
  the mobility of lipid increased results in perfect alignment of monomer and formed spherical LNs.

Figure 5. SEM image of LNs at various transition temperature ( ) (a) 40°C (b) 50°C (c) 60°C.
Download figure:
Standard image High-resolution imageSize measurement analysis
The size of void LNs, Q-loaded LNs, and BSA anchored Q-LNs are measured using nanoparticle analyzer. The measured size is about 35 nm for void LN (figure 6(a)) whereas the sizes of Q-LNs (figure 6(b)), and BSA-Q-LNs (figure 6(c)) are recorded as 80 nm and 530 nm respectively. The size of particles is independent of the composition but varies with concentration. Since for appropriate size measurement laser beam needs to penetrate into the sample, hence the concentration of the particles must be diluted so that particles are dispersed and successful size measurement can be achieved. In the present study, sizes are observed in the nm range which is suitable for In-vitro study.
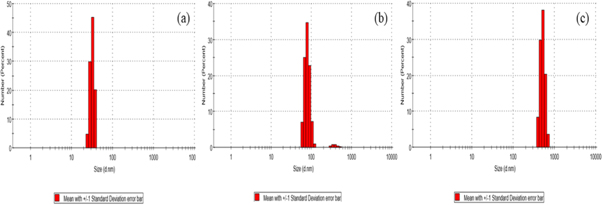
Figure 6. The size distribution of (a) void LNs in nm (b) Q-loaded LNs in nm (c) BSA conjugated Q-LNs in nm.
Download figure:
Standard image High-resolution imageFourier transformed infrared spectroscopy analysis
The FT-IR spectra of void LNs, Q-loaded LNs and BSA conjugated Q-LNs are illustrated in figures 7(a)–(c) respectively. The spectra shows the characteristics peak of the functional group CH2, OH, C=O, PO2-, and CH bands in the agreement with the reported spectra of lipid (Mady and Elshemey 2011) (Alexander et al 2016), (Begum et al 2012),(Blume, n.d.), Q (Youssef Moustafa et al 2009) and BSA (Huang et al 2010), (Servagent-Noinville et al 2000). The CH2 stretching and bending bands of extended acyl chain of the void LNs are observed at 2930 cm−1 and 1350 cm−1 respectively. The band around 3450 cm−1 and 3452cm−1 is assigned to OH stretch which is intrinsic of lipid, Q, and BSA. In the spectra, C=O peak is observed at 1700 cm−1. The C=O widening vibration of the ester group of phospholipid is in usual near-infrared section to govern the structural phase of membrane lipids. The peak at 1090 cm−1 is due to the phosphate group. The spectra of Q-LNs in figure 7(b) also engaged the characteristic peak as observed in void LNs with a slight shifting of OH peak. Moreover, the spectra of BSA conjugated Q-LNs as shown in figure 7(c) involved the characteristics peak with the shifted band. The new band at 1675 cm−1 in the spectra is allotted to the amide group from the BSA. Further in figure 7(c), the characteristic peaks are shifted to the left due to the surface modification of the lipid with maleimide. In addition, reduction in the absorption of some characteristics lipid band may be attributed to the formation of weak forces such as hydrogen bond, van der Waals attractive forces or dipole-dipole interaction between lipid surface and maleimide. These shifts in peeks are due to the aforemention interactions, support the successful Q- loading and BSA conjugation.
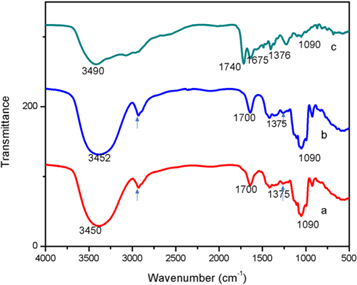
Figure 7. FT-IR spectra in the section of 4000–400 cm−1 (a) void LNs (b) Q-loaded LNs (c) BSA conjugated Q-LNs.
Download figure:
Standard image High-resolution imageAnalysis of in- vitro drug release kinetic
We performed the in-vitro drug release kinetics for 12 days as presented in figure 8. The drug release kinetic from constructed LNs are described in figures 8(a)–(d). It is seen from the figure 8 that the drug release behavior is decreased after a successive period of time as some amount of drugs reside in the inner core and interact with lipids through weak bonds. The initial faster rate of release is commonly ascribed to drug detachment from the outer surface while later slow release is due to sustain drug release from the inner core of the LNs. Zero-order model (figure 8(a)), first-order model (figure 8(b)), Higuchi model (figure 8(c)), and Korsmeyer-Peppas model (figure 8(d)) were applied in vitro release kinetic study(Konda, n.d.), (Miao et al 2015),(Nounou et al 2006). For comparative study, we evaluated R2 values and found that the R2 values achieved by the first-order kinetic model is higher than that of all competing models, suggest that the first-order kinetic model is the best-fitting model. Also, the value of slope was found to be minimum in the first-order kinetic model among all the models. The higher R2 value and lower slope value suggests that the release rate is concentration-dependent which means that the drug releases with dissociation of lipid monomer. This type of drug delivery system overcomes multiple drug resistance in the case of cancerous cells.

Figure 8. Release kinetic studies of Q-loaded LNs (a) Zero-order release kinetics (b) First order release kinetic (c) Higuchi,s order plot (d) Korsmeyer-pappa,s model.
Download figure:
Standard image High-resolution imageXRD analysis
XRD is used for characterization of void LNs and Q-loaded LNs for crystal structure analysis. From figure 9, the peak of XRD was recorded for void and Q-loaded LNs over 2-theta ranging from 2° to 80°. Also, the sharp characteristic peaks appeared at 2 theta = 27.7° and 31° (see figure 9(b)) exhibiting a polymorphic nature. This diffraction peak is due to the ordered or crystalline structure of the LNs. The ordered structure of the LNs is achieved due to the encapsulation of the Q inside the nanocarriers. However, no characteristic peak or broadened diffraction peak at 2 theta =21° is observed for void LNs (figure 9(a)). This is attributed to amorphous nature or highly disordered crystal structure of LNs. The expansion of diffraction peaks is due to the chaotic states of crystal. This is attributed to the absence of total destructive and constructive interference of x-ray in a finite-sized lattice (Akbari et al 2011).

Figure 9. X-ray diffraction image of (a) void LNs and (b) Q-loaded LNs.
Download figure:
Standard image High-resolution imageCell viability study
Cell viability study of free Q, Q-loaded LNs, and BSAconjugated Q-LNs are performed using MTT assay in monolayer culture for MCF-7 cells (see figure 10). The obtained results show that the survival of the cell is maximum for the free Q at concentration 0.5 μg ml−1 and moderately decreasing with increase in concentration of the free Q. It is observed that, for Q-LNs, cell viability decreased at various concentration of Q compared with free Q. In addition, BSA-Q-LNs show a further reduction in the viability of the cells in comparison with Q-LNs and free Q. This reduction in cell viability is because in comparison to free Q and Q-LNs, the BSA-Q-LNs bound easily with the cells through P-glycoprotein expressed receptor, this results in more accumulation of the Q inside the cells. In particular, the cancerous cells have over-expressed the P-glycoprotein receptor which is specific for BSA (Wang et al 1994).

Figure 10. The cytotoxic effect of free Q, Q-loaded LNs, and BSA conjugated Q-LNs at various concentrations of Q on MCF-7.
Download figure:
Standard image High-resolution imageStatistical analysis
The validation of the experimental results is performed using one way ANOVA. The experiment was repeated three times and all the data were expressed as mean ± standard deviation. The p-value was found to be less than 0.05, shows that data were statistically significant.
Intracellular distribution and cellular uptake of free Q, Q-LNs, and BSA-Q-LNs
Distribution of free Q, Q-LNs, and BSA-Q-LNs were assayed within MCF-7 cells using confocal microscopy. From figure 8, it is obvious that after 4 days of incubation, the constructed liposome delivered a sufficient amount of Q to see the cytotoxic effect in the MCF-7 cells. Further, the fluorescence signal was recorded from the cell nucleus and the cytoplasm. In our experiment, the concentration of free Q for all the formulation was 10 ug ml−1. As seen in figure 11, Q accumulated inside the cell nucleus and the cytoplasm. The Q-LNs (figures 11(b), and (e)) and BSA-Q-LNs (figures 11(c) and (f)) emits more fluorescence signals in comparison with the free Q (figures 11(a) and (b)). Moreover, BSA-Q-LNs transported the drug inside the nucleus more efficiently as compared to Q-LNs and free Q.

Figure 11. The confocal image of MCF-7 (a) treated with free Q, PI staining (b) treated with Q-LNs, PI staining (c) treated with BSA-Q-LNs, PI staining (d) treated with free Q, DAPI staining (e) treated with Q-LNs, DAPI staining (f) treated with BSA-Q-LNs, DAPI staining.
Download figure:
Standard image High-resolution image
Conclusion
In the present study, lipid nanocarrier is constructed which contains hydrophobic drugs (quercetin) in the core region and its surface is modified using maleimide. Further, BSA is conjugated with the modified surface of the lipid nanocarriers. This type of drug delivery system overcomes a certain limitation such as drug-like poor solubility, physiochemical and pharmaceutical behavior. This lipid-based nanocarrier is also capable of targeted drug delivery particularly in the case of cancerous cells. The SEM image confirmed the morphological differences that occurred among void LNs, Q-LNs, and BSA-Q-LNs. The observed size of the formulated LNs is 530 nm, which is suitable to enter inside the cell. Moreover, the FT-IR peak suggested the successful encapsulation of the Q and BSA conjugation with LNs. In addition, release kinetic was performed for 12 days, suggests the initial burst of Q followed by a constant release of Q from the core of the lipid matrix. Further, the constructed lipid-based nanocarriers are applied to analyze the cytotoxic effects in MCF-7 cells. It is observed that BSA conjugated Q-LNs accumulate more quercetin as compared to Q-LNs and free Q. The application of this Q-loaded nanocarriers on cancerous cell line K562 can also be investigated further and worth our consideration.
Acknowledgments
The authors are grateful to the central instrument facility center (CIFC), IIT (BHU) for providing us with FT-IR, SEM facility. The authors also appreciates the Department of chemistry, IIT (BHU) for providing the XRD facility. Thanks also extended to Biomolecular Engineering lab, school of Biochemical Engineering IIT (BHU) providing, Nanoparticle analyzer facility. The authors are also obliged to MHRD for providing financial support and to IIT (BHU) for the other instrument facility to the first author to carry out his work.
Disclosure statement
No potential conflict of interest was reported by the authors.