
Abstract
Interaction between 2, 3, 5 and 7 atomic layers of gold and a (111) silicon surface was investigated with the molecular dynamics simulation method. The simulation of the diffusion interaction between gold and silicon in the temperature range 425–925 K has been carried out. The peculiarities of the concentration changes of the interacting components and the atomic density at the boundary of two phases in the direction perpendicular to the crystalline surface were established. By means the formalism of quasi two dimensional partial pair correlation functions the atomic structure of the diffusion region was analyzed. The formation of the alloy of eutectic composition within the gold-silicon interlayer was established. It was shown that the inter-phase mixing in various temperature intervals occurred according to different diffusion mechanisms.
Export citation and abstract BibTeX RIS

Original content from this work may be used under the terms of the Creative Commons Attribution 3.0 licence. Any further distribution of this work must maintain attribution to the author(s) and the title of the work, journal citation and DOI.
1. Introduction
Silicon still is the basis of semiconductor electronics despite significant progress in the study of other types of materials. The reason for this is that silicon reveals a unique set of properties which are stable in time and over a wide range of temperatures. Gold was first used to form metal contacts as well as transistors [1, 2] and continues to be used to form interconnections in the most advanced electronic devices. Due to the miniaturization of electronic devices, the processes taking place in a volume comparable with the size of an atom appear on the foreground. In particular, as a result of the strong interaction between silicon and gold, the mixing diffusion of the two species at the nanoscale level can occur even at room temperature. Such interaction was studied in detail by experimental methods [3–8] and attempts of such investigations by computer simulation methods were undertaken [9–12]. These studies showed the possibility of forming eutectic phases at the boundary between gold and silicon as a result of heating. In particular, in [9] the formation of an alloy with a gold concentration of about 80% is shown which corresponds to eutectic concentration in the Au-Si system. However, in [9], only a partial analysis of the interphase region concerning the formation of eutectic alloy was carried out, and only the concentration profile and the thickness of the mixing region, depending on temperature and the number of gold monolayers, were studied. Therefore, the question about the nature of the interphase region and its relation to the Au-Si equilibrium phase diagram remains open.
In recent years, thin films of gold on various substrates are also used to obtain gold nano islands as different kinds of sensors [13–18].
From the point of view of the equilibrium phase diagrams, the gold-silicon system belongs to eutectic alloys with a deep eutectic point. In the crystalline state, the solubility of gold in silicon and vice versa is very small [19–21]. It is known, that heating of bulk gold and silicon, which are in contact with each other, to the eutectic temperature, will be accompanied by their melting and the formation of an eutectic melt in the process of contact melting [22, 23]. We can suppose that this effect will also be observed at the nanoscale, in particular in the case of thin films. If so, then at the boundary of the gold-silicon region, at the eutectic temperature, the molten layer of the eutectic concentration will be formed. In this case, the question arises about the difference between the structure of the eutectic at the interface and in the case of a bulk alloy. These differences may be due to the ordering which occurs in the first several layers of the liquid, adjacent to the crystal surface [24–27].
In this paper, computer simulations of the interphase boundary formation in the gold-silicon system were carried out and the transformations of the structure for this system at various temperatures were investigated. In addition, the differences in the structure of the bulk liquid alloy of eutectic concentration with the melts on the boundary of gold and silicon were analyzed.
2. Simulation methods
The molecular dynamics (MD) simulations have been carried out using Large-scale Atomic/Molecular Massively Parallel Simulator (LAMMPS) package [28]. The simulations were run in the isothermal-isobaric ensemble (NPT) using an orthogonal simulation cell. As an example, the initial configuration of atoms, consisted of two layers of gold and thirty seven layers of (111) silicon substrate, arranged along the Z-direction is shown in figure 1. The silicon substrate was divided into two parts in height. The first of them was a crystalline cubic diamond-like cell, built from static (immobile) Si atoms (highlighted in yellow) which are fixed on their lattice sites to prevent the moving of the substrate. The second part consisted of mobile silicon atoms involved in simmulation (highlighted in red). The gold thin film of different numbers of layers constituted the third part of the simulation cell. Periodic boundary conditions were employed in horizontal (X, Y) directions.
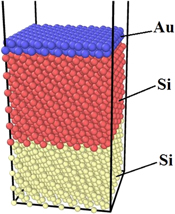
Figure 1. The initial positions of atoms in the simulation box.
Download figure:
Standard image High-resolution imageThe initial atom velocities for temperature range T = 425–925 K were generated using the Maxwell-Boltzmann distribution. The integration timestep was equal to 1 fs. The constant temperature conditions were kept using the Nose-Hoover thermostat and barostat with the temperature damping parameter of 0.1 ps. Spatial configuration of atoms was registered every 1000 timesteps. The duration of simulation was set to 5 × 10⁵ timesteps.
The interaction between atoms was calculated using the Modified embedded atom method (MEAM) potential [29]. In the MEAM formulation, the total energy E of a system of atoms is given by:

where  is a many-body screening factor. The embedding function
  where
where  is the cohesive energy of atom i in the reference structure and
  is an adjustable parameter. The background electron densities are given by:


where  is the angular dependence, k = 0–3 corresponding to s, p, d, f symmetry,
  are the partial electron densities,
  are the average weighting factors for the partial electron density and
  is the composition-dependent electron scaling factor for the i-th atom.
For the analysis of the atomic structure of gold, gold-silicon alloys and the interphase boundary, depending on the temperature, a formalism of quasi 2D pair correlation functions (q2D-PCF) was used [30].
Due to the fact that the system under investigations is partially liquid and partially crystalline, we have calculated the distribution of atomic density (density profile) at the boundary of two phases in the direction perpendicular to the crystalline surface as

where  and
and  are the x and y dimensions of the cell, respectively, and z is perpendicular to the interface, ∆z is the bin width, and
  is the number of particles between z−∆z/2 and z + ∆z/2 at the time t,
  means the average value over the last 5000 steps of simulation.
3. Results and discussion
3.1. Analysis of intermixing processes in Au-Si interlayer
The simulations of the gold-silicon interphase were carried out in the temperature range 425–925 K in a step of 50 K. The model cell contained thirty seven layers of silicon (2664 atoms) and 2, 3, 5 and 7 monolayers (ML) of gold (256–896 atoms). The initial dimensions of the cell in the directions of X, Y and Z were 32.57Å , 32.57Å and 200Å respectively (in the Z-direction the size of the cell was much larger than the sample height, thus leaving empty space above the sample).
In the phase diagram (figure 2), the vertical lines show the bulk-averaged (equilibrium) concentration of gold-silicon mixture in the approximation of the perfect solution of atoms. The horizontal lines show the temperatures of the subsequent simulations. The temperature range of the investigations lies symmetrically with respect to eutectic horizontal.
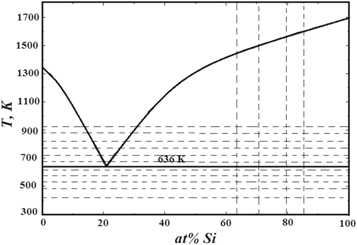
Figure 2. Phase diagram of the Au-Si system.
Download figure:
Standard image High-resolution imageAt the temperatures below the eutectic point, the atomic layering in the interphase region is evident, which can be seen in the snapshots of atomic cells (figures 3 and 4), and on the density profiles (figure 5), which reveal oscillations. At higher temperatures (T > 725 K), the ordered atomic layers at the interlayer boundary of the crystalline silicon–melt system are still present. The persistence of the significant crystal-like ordering can be owed to the vicinity of strongly interacting Si crystal.

Figure 3. Positions of gold and silicon atoms in the case of 2 monolayers of Au atoms on the Si surface at three temperatures.
Download figure:
Standard image High-resolution image
Figure 4. Positions of gold and silicon atoms in the case of 7 monolayers of Au atoms on the Si surface at various temperatures.
Download figure:
Standard image High-resolution image
Figure 5. Atomic density profiles in simulation cell for the case of 2 (a), (b) and 7 (c), (d) ML of Au atoms at different temperatures.
Download figure:
Standard image High-resolution imageInspection of density profiles' evolution on heating leads to two conclusions. Firstly, a decrease in the density oscillations suggests the melting of the upper layer of the gold-silicon mixture. Secondly, the distance between the crystalline planes of silicon in the region adjacent to the boundary of the solid-liquid phases increases. This is probably due to the diffusion of gold atoms into the silicon (the atomic radius of gold is greater than that of silicon).
It is convenient to analyze the changes in the concentration of gold and silicon atoms along the Z-axis using the concentration profiles, i.e. the dependences of the concentration of each component along the Z coordinate. The concentration profile was calculated similarly to the density profile. The simulated cell was divided into layers ∆z = 1Å thick in each of which the average content of silicon and gold was calculated according to equation:

where  denotes the number of gold or silicon atoms and
  is the number of particles between z−∆z/2 and z + ∆z/2 at the time t,
  means the average value over the last 5 000 steps of simulation.
The concentration profile for silicon (figure 6) indicates a significant increase in the concentration of gold in the case of two and three Au over-layers and the slower growth of its concentration in the case of more Au over-layers. In particular, at the temperature of 725 K, in the case of two layers of gold on silicon, the concentration of silicon in gold reaches a value close to the equilibrium liquid and corresponds to the eutectic point on the phase diagram. At higher temperatures, the concentration of silicon in gold becomes higher in comparison with equilibrium state, which leads to its allocation in the upper part of the simulated cell over the gold atoms (figure 3(a)). In the case of three layers of gold, silicon concentration differs from equilibrium eutectic concentration to lesser extent and as it is seen in figure 6(b) it is almost uniformly distributed over the height of the sample. For more layers of gold on the silicon, the concentration of silicon with increasing of Z coordinate monotonically decreases.

Figure 6. Concentration profiles of Si-atoms for various numbers of Au layers.
Download figure:
Standard image High-resolution imageAs was mentioned above, one of the mechanisms for the intermixing of gold and silicon at the interface may be the effect of contact melting, which is observed particularly for eutectic systems. As a result of such interaction, a melt of eutectic concentration will be formed on the boundary of the interlayer. In order to verify this supposition, the temperature dependence of the silicon concentration along the height of the simulation box was investigated (figure 7). The initial height under analysis was equal to Z = 50Å , which corresponds to the Au-Si interface position at room temperature at the beginning of the simulation as far as at the initial time the upper plane of the silicon was at a height of 48.8 Ǻ and the lower plane of the gold was at a the height of 51.2Å . In figure 7, the horizontal and vertical lines show also eutectic concentration and temperature, respectively. The main feature we can see from these dependencies is the achievement of eutectic concentration at an eutectic temperature in the position of 50–54Å for the case of two and three layers of gold on silicon. Above 56Å , the concentration of silicon in gold is less than eutectic concentration. For the case of the five and seven atomic layers of gold on silicon, the eutectic concentration at the Au–Si interface is reached only at a temperature of 100 K higher than the eutectic temperature.
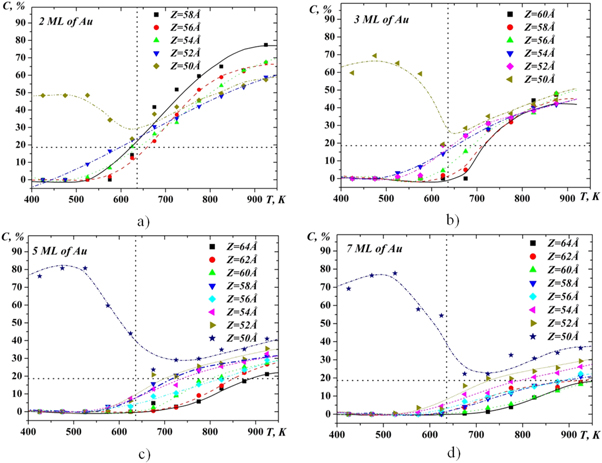
Figure 7. Temperature dependence of the silicon concentration within the Au–Si interlayer region.
Download figure:
Standard image High-resolution imageFor a deeper analysis of the process of intermixing of gold and silicon, we have analyzed the temperature dependence of the width of the diffusion mixing region (defined as the difference between the highest Z-coordinate of Si atom and the Z-lowest coordinate of the Au atom) for the different numbers of gold monolayers (figure 8). In this figure, the dotted lines show the Au–Si interface position (Z = 50Å) and the maximum height at which the gold atoms were placed before the beginning of the simulation. The main feature that we can notice from this figure is the clear presence of two temperature intervals (425K-625 K and 625K-925 K), in which the process of diffusion of atoms occurs in different ways. As we suppose, in the low temperature range, the diffusion process takes place in accordance with the vacancy mechanism. In the interval of higher temperatures (625 K–925 K), the diffusion of atoms is more intense and therefore we can assume that the main role in the process of diffusion plays a collective mechanism which is connected with the motion of the atoms group surrounding some central atom. Such a diffusion mechanism is typical for melts, therefore, given that the temperature 625 K is close to the eutectic temperature, we can assume that in the second temperature range the upper part of the simulated system is in a liquid state.
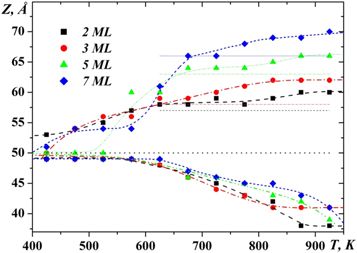
Figure 8. Dependence of the width of the diffusion mixing region on the temperature.
Download figure:
Standard image High-resolution imageFor a more detailed explanation of the diffusion process of gold and silicon atoms and as a result, formation of the atomic structure within the interlayer region, one should use the formalism of pair correlation functions.
3.2. Atomic structure of Au-Si interlayer
In order to investigate the mutual arrangement of gold and silicon atoms in the intermixing region, quasi two dimensional partial pair correlation functions (q2D-PCF) [30] were analyzed. The calculated q2D-PCFs are shown in figures 9–11. Vertical lines in these figures indicate the position of coordination spheres in crystalline gold and silicon. The positions of the first peak maxima correspond to the most probable distances between the neighboring atoms. The height and width of the maxima of these functions characterize the degree of atomic ordering.
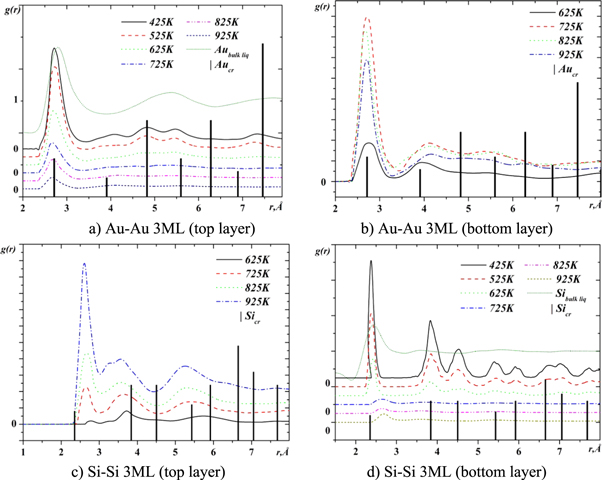
Figure 9. The q2D PCFs for the system with 3 gold monolayers on silicon surface.
Download figure:
Standard image High-resolution image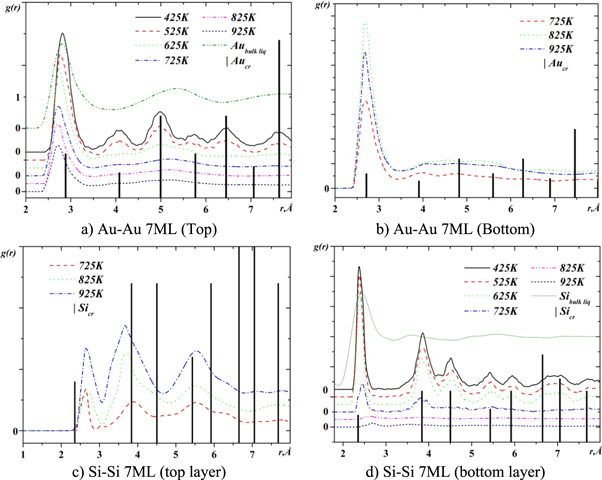
Figure 10. The q2D PCFs for the system with 7 gold monolayer on silicon surface.
Download figure:
Standard image High-resolution image
Figure 11. The Au-Si q2D-PCFs for the system with 3 and 7 gold monolayers on silicon surface.
Download figure:
Standard image High-resolution imageFigures 9 and 10 show the Au-Au and Si-Si q2D-PCFs in the areas above and below (top and bottom layers) the boundary between gold and silicon for the case of three and seven layers of gold on silicon. For the case of two and five layers of gold on silicon, these features are similar to those shown in figures 9 and 10, respectively. The common feature of these figures is, that the overall shapes of the Au-Au q2D-PCFs in the top layer and the Si-Si q2D-PCFc in the bottom layer at the temperature of 425 K are typical for solid state, but their widths are larger than in the crystalline state. At low temperatures (425 K and 525 K), the positions of the maxima of the Au-Au and Si-Si PCFs coincide with the corresponding positions of the maxima for crystalline phases. The increase in temperature leads to a shift of the first maximum of the Au-Au q2D-PCFs towards the smaller interatomic distances, and the Si-Si q2D-PCF towards the greater distances. In addition, the increase in temperature leads to a decrease in the height of the q2D-PCF first maximum, which indicates an increase in the degree of disorder and the disappearance of long-range ordering. It is noteworthy that this feature is most pronounced at temperatures above 625 K in the case of three layers of gold on the silicon surface and above 725 K in the case of seven layers. Such a change in the profile of the q2D-PCFs suggests a transition from a crystal-like to a liquid-like structure at a boundary between phases. One can assume that the reason for such a transformation is the formation of an eutectic alloy with the melting point in equilibrium conditions of 636 K. Given that in our case the system is in a non-equilibrium state with a variable composition of components, the melting point of the formed alloy can vary.
Another feature of the q2D-PCFs is the appearance of significant asymmetry and splitting of the first maximum (figure 11). This is especially seen in the correlation between different kinds of atoms. The increase in temperature leads to a change in the shape of this maximum, which is accompanied by a change in the ratio of the heights of the maxima that correspond to different values of the most probable interatomic distances. Such changes are caused by the specific correlation in the distribution of atoms at different distances, which is promoted by changes in solubility of the components when the temperature increases.
The analysis of the temperature dependences of the most probable interatomic distances (figures 12, 13) makes it possible to suggest an atomic model of the interphase boundary in the Si-Au system. First of all, it is necessary to analyze the transformation of the atomic structure of the solvent, i.e. the structure of gold above the interphase boundary of components (Au and Si) and silicon below this boundary. From figures 12(a) and (b) it follows that in the case of two and three layers of gold on the silicon surface, the most probable Au-Au interatomic distances are smaller in comparison with the most probable interatomic distances of molten gold (2.86Å), and also with the sum of its metallic atomic radii (2.88Å). Such a decrease in interatomic distances can be explained only by the presence of covalent bonds that occur as a result of the formation of a solution with silicon. As it was previously reported, relativistic stabilization of the 6 s orbital in gold lead to an anomalously high electron affinity of Au, which can be compared to the halogens [31–34]. This leads to the formation of SiAun (n = 2–4) clusters in which the distances between the gold atoms are approximately equal 2.7Å [31, 35]. According to the results of other works formation of Si-centered tricapped trigonal prism Kasper polyhedra with an Au-Si bond distance of ≈2.4Å (the associated Au-Au distance is expected to be 2.79Å) is possible [36]. In the case of a more atomic layers of gold on silicon (figures 12(c)–(d), the solubility of silicon in gold is smaller at low temperatures and the distance between gold atoms is close to 2.8Å , which is similar to pure crystalline gold. The increase in temperature leads to an increase in the concentration of silicon in gold and in turn to reduce the distance between the gold atoms.

Figure 12. Temperature dependencies of distances between atoms in the top layer of the Au-Si boundary.
Download figure:
Standard image High-resolution image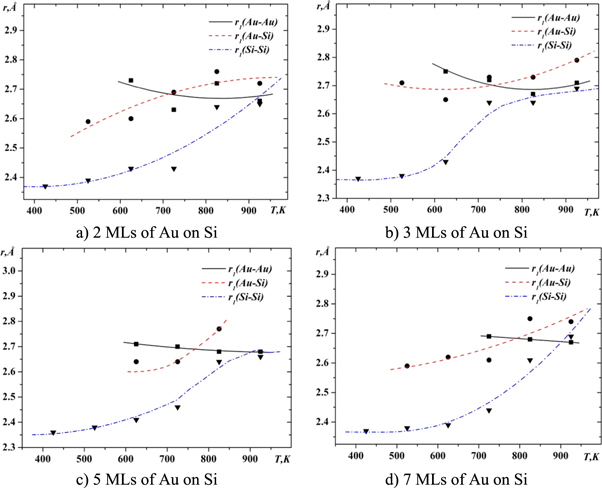
Figure 13. Temperature dependencies of distances between atoms in the bottom layer of the Au–Si boundary.
Download figure:
Standard image High-resolution image
The heating of the gold-silicon system also leads to changes in the interatomic distances of the silicon substrate. It is clear that the increase in Si–Si interatomic distances (figure 13) is due mainly not to the thermal expansion of the substrate, but to the diffusion of gold into silicon. At low temperatures, distances between silicon atoms are close to those in the crystalline silicon and slowly increase with heating. The rapid growth of Si–Si interatomic distances is observed at a temperature of 725 K, which is due to the melting of silicon on the border with gold, and to an increase in the rate of diffusion of gold in silicon.
The temperature dependence of the distances between unlike types of atoms also has different behavior for the upper and lower regions in the simulation cell with respect to the interphase boundary. In particular, in the top region where a gold-based solution is formed, the Au–Si interatomic distances are reduced from about 3Å to 2.7–2.8Å . On the other hand, in the region enriched with silicon, Au-Si interatomic distances increase from approximately 2.7Å to 2.8Å . It should also be noted that the correlation in the different type atomic positions appears only at temperatures above 625 K, i.e. at temperatures when the eutectic melt is formed at the boundary of gold and silicon.
In general, the described above changes in the interatomic distances at heating makes it possible to assume that the transformation on the boundary between gold and silicon leads to the homogenization of the structure and the formation of a melt with the statistical distribution of atoms. The possibility of such a process is also justified from the thermodynamic point of view, due to the significant negative enthalpy of mixing in the system of gold and silicon [37, 38]. The atomic structure of Au-Si interlayer is therefore largely different from the like-atom clustering observed in the solid phase. Similar structure transformation occurs in other eutectic alloys with silicon [39–42].
4. Conclusions
As a result, it should be noted that the eutectic reaction plays a crucial role in the mixing process of gold and silicon. At temperatures both below the eutectic point and above it the presence of ordered atomic layers at the Au-Si interlayer boundary has been revealed.
Diffusion mixing leads to the formation of eutectic alloy at a eutectic temperature in atomic layers of four angstroms above the initial boundary level (50Å) between the gold and silicon for the case of two and three layers of gold on silicon. This suggests that the silicon-gold reaction starts at the beginning of the interface formation and a critical thickness of the metal layer is not necessary to start the reaction as was supposed in [43]. For the case of the five and seven atomic layers of gold on silicon, the eutectic concentration at the Au-Si interface is reached only at a temperature of 100 K higher than the eutectic temperature.
The eutectic temperature above which the melting process begins, is the point that delimits the temperature intervals with different diffusion mechanisms. As we suppose, in the low temperature range (425 K–625 K), the diffusion process takes place in accordance with the vacancy mechanism. In the interval of higher temperatures (625 K–925 K), the diffusion of atoms is more intense and therefore the main role in the process of diffusion plays a collective mechanism which is connected with the motion of the atoms group surrounding some central atom.
Despite these differences, the formation of a eutectic at the Au–Si interface leads to the disappearance of the long-range order and the formation of a disordered structure. It was established that an increase in the concentration of silicon in gold at the interface leads to the contracting of the structure in comparison with pure gold, which may be due to the appearance of some of the covalent bond between gold and silicon.
Acknowledgments
The authors gratefully acknowledge the TASK Academic Computer Centre (Gdansk, Poland) for providing the computer time and the facilities.