
Abstract
Zinc titanate ZnTiO3 phosphor thin films doped with 1, 2, and 3 mol% of Ho3+ ions were fabricated using sol-gel method a combined with dip-coating technique on silica glass substrate and subsequent thermal annealing in the range of 600–900 °C. Effects of annealing temperature and Ho3+ ions concentration on the structure and optical properties of these phosphor thin films were investigated using x-ray diffraction (XRD), scanning electron microscopy (SEM), UV-visible transmittance spectroscopy, excitation, and emission spectroscopy. Results revealed that ZnTiO3 nanocrystals were formed upon 600 °C annealing temperature. At 900 °C polycrystalline films including ZnO and TiO2 anatase phase were observed. The average diameter of nanocrystals showed temperature dependence and was varied in the range-over 15–48 nm which was revealed by SEM images with cracks free. The EDS showed homogenous distribution of Ho3+ ions in the thin film specimens. It was found that Ho3+ ions incorporated into the nanocrystals. As a result, the room temperature luminescence color emission of the synthesized phosphor thin film specimens can be tuned from blue to green by switching the excitation wavelength from 360 nm to 430 nm. The achieved result makes these phosphor thin films promising for several applications such as optoelectronics and light-emitting.
Export citation and abstract BibTeX RIS

Original content from this work may be used under the terms of the Creative Commons Attribution 3.0 licence. Any further distribution of this work must maintain attribution to the author(s) and the title of the work, journal citation and DOI.
1. Introduction
Metal oxide semiconductor in the form of powder or thin films have received much attention in the recent past due to their interesting properties and potential applications in various fileds [1–5]. Among which, zinc oxide (ZnO) has attracted demanding research effort due to its unique properties, which possess direct wide band gap energy of ∼3.3 eV with a low phonon energy around 440 cm–1 that corresponds to the Zn–O vibrational bond [6, 7], and the other importanat charactristic it has a large excition binding energy of 60 meV, which is larger than that of materials such as ZnSe with 22 meV, and GaN with 25 meV that are used for blue-green light emitting semiconductor devices [5]. However, ZnO has been used as host lattice for both transition metals ions (TM) and rare-earth ions (RE). Of these RE ions, Ho3+ doped ZnO is a well-known materials, and have been intensively investigated in several application related to up and down conversion emission, magnetic, electric, and thermoelectric properties [8–12]. In addition to ZnO, titanium dioxide TiO2 is common semiconductors with also wide-band gap energy. Due to its excellent properties, different lines of research have investigated its photocatalytic activity [13–16]. Moreover, Ho3+ ions doped TiO2 suppress the crystal size growth, as well as the phase transformation between anatase and rutile phase, which these resulted in improve the photocatalytic activetiy of TiO2 [17].
On the other hand, ZnO and TiO2 system have directed much attention in application of optoelectronic and other industrial applications because of its sort of stability, nontoxicity, cost, availability, and its ability to produce highly oxidizing stems, and also shown predict in the areas of solar cells, gas sensors, and photocatalysis [18–22]. The effect of annealing temperature on synthesis of a ZnO-TiO2 composite usually results in formation of one or more of the three common known phases manifests this ZnO-TiO2 system. Which are represented by cubic zinc orthotitanate (Zn2TiO4), cubic defect spinel structure (Zn2Ti3O8), and cubic metatitanate or a rhombohedral ilmenite structure (ZnTiO3) [4, 19, 23–25]. Several methods have been used to fabricate ZnO-TiO2 composite materials, annealing conditions and ZnO/TiO2 molar ratio were found have significants effects on the phase formation. The formation of both Zn2TiO4 and Zn2Ti3O8 are restricted to the existence of TiO2 anatase phase, and the synthesized of Zn2TiO4 could be by using of 2:1 molar ratio of ZnO and TiO2. On the other hand, cubic ZnTiO3 phase will be formed only in the existence of TiO2 rutile phase [26–28].
In this work, Ho3+ ions doped ZnO-TiO2 composite phosphor thin films were synthesied using sol-gel method combined with dip-coating technique on silica glass substrate and annealed in the range of 600 °C–900 °C. effects of annealing temperature and Ho3+ ions concentration on the structure and emissionwe properties of these films specimens were investigated. the ZnTiO3 phase of this composite was realized, and excitation dependnce tunable emission consist of blue region and green region of the visible spectral were achieved. These properties makes this phosphor thin films attractive for certain applications.
2. Experimental
2.1. Materials
Absolute ethanol (CH3CH2OH, AR, ≥99.7%), tetrabutyl titanate (Ti(OC4H9)4, CP, ≥98.0%), diethanol amine (C4H11NO2, CP, 98.0 ∼ 102.0%), zinc acetate dehydrates (Zn(CH3COO)2·2H2O, ≥99.0%), acetone (CH3COCH3, AR, ≥99.0%), ammonia solution (NH3·H2O, AR, 25 ∼ 28%), acetic acid (C2H4O2), hydrochloric acid (HCl, AR, 36.0 ∼ 38.0%), and hydrogen peroxide 30% (H2O2, AR, ≥30%) were obtained from Sinopharm Chemical Reagent Co., Ltd, China. Holomium oxide (Ho2O3, ≥99.99%) was purchased from China Leadmat Advanced materials Co. These chemicals were used without further preparation.
2.2. Solution and film preparation
Zinc titanate phosphor thin films doped with holmium were prepared by the sol-gel method.The titanium solution was prepared by mixed 0.05 mol of titanium butoxide in ethanol, deionized water, and diethanolamine in a 1:26.5:1:1 molar ratio. For the first step, titanium butoxide was dissolved in a half amount of ethanol under constant magnetic stirring in room temperature for 2 h. During this step diethanolamine was added to the solution as stabilizer. The residual ethanol was mixed with deionized water in volume ratio of 10:1. Then, this solution was added drop-wisely in the first one and stirred for another 2 h at room temperature. Zinc precursor solution was prepared as in our pervious work [29], stoichiometry amount of zinc acetate dihydrate was dissolved in ethylene glycol monomethyl ether (0.404 mol) under vigorous stirring at room temperature for 30 min During stirring, ethanolamine (0.025 mol) was added as stabilizer in a molar ratio 1:1. In order to obtained solution with concentration of 0.75 M, the solution was stirred for extra 1 h at 60 °C. For the doping purpose, 1, 2, and 3 mol% of Ho3+ ions holmium nitrate Ho(NO3)3 (laboratory-made by dissolved a calculated amounte of Ho2O3 in dilute HNO3 then dried in a furnace at 100 °C for 72 h) was dissolved in a little amount of ethanol, then was add into Zn sol and steering for farther 1 h at room temperature. Finally, both Ti and Zn solutions were mixed at room temperature under continuously stirring, in order to obtain Zn/Ti volume ratios of 1.5:1. Transparent sol with pale yellow color was obtained. The prepared sol was aged for 24 h before use.
The silica glass substrate with a dimension of 25 mm × 76 mm × 1 mm were used. The glass substrates were washed successively with acetone, aqueous ammonia solution, hydrochloric acid aqueous solution, deionized water and absolute ethanol in an ultrasound bath. Then, dried at 100 °C for 10 min before coating. Dip coating method was used to obtain the thin films specimens. The dried glass substrates were dip-coated by the prepared sols with a withdrawal speed of 120 mm min−1. The specimens were dried at 100 °C for 30 min. Multi-layered specimens were prepared by repeating the above procedure, then these thin film specimens were annealed at aforementioned range for 1 h with a heating rate of 5 °C min−1. A six-dipping procedure was applied to all thin films were produced. After annealing, these specimens were cooled down to room temperature by switching off the annealing furnace. All these heating, annealing and cooling processes were carried out under ambient atmosphere.
2.3. Thin films characterizations
The crystallization of films was identified by x-ray diffraction (D8 Advance, Bruker, Karlsruhe, Germany). Cu-Ka radiation (k = 1.5406 Å) with a scanning rate of 2 °/min was used for the measurement with a resolution of 0.02°. Thin films specimens were cut into small pieces with dimension of 1 × 1 cm2. The small pieces were mounted onto the sample holder and fixed using the paste in order to guarantee the horizontal alignment with the x-ray beam and incident angle of 0.5° (for the 2θ scan ). Surface morphology and elemental mapping of these thin film specimens were recorded using filed emission scanning electron microscopy (FE-SEM, Ultra Plus-43-13, Zeiss, Germany) and energy dispersive x-ray spectroscopy (EDS). Transmission spectra in visible region were recorded on a Shimadzu UV-3600 scanning spectrophotometer (Nakagyo-Ku, Kyoto, Japan). Photoluminescence (PL) emission spectra and excitation spectra (PLE) of films specimens were collected by a Photon Technology International (PTI) QM/TM/NIR spectrophotometer with a 914 photomultiplier detection system and a 75 W Xenon lamp as the excitation source.
3. Results and discussion
3.1. Thin film structure
3.1.1. Thin film morphology and composition
After dip-coating, and in order to transform these specimens into thin films all of them were annealed at high temperatures ranging-over 600 °C–900 °C. The morphology of these specimens was investigated with the aid of SEM. The SEM images of 2 mol% Ho3+ ions doped specimens showed that the morphology of these thin films specimens was strongly affected by the annealing temperature. Figure 1 demonstrate images of specimens annealed over the aforementioned range. When the specimen annealed upon 600 °C, the film became denser with a negligible pore size and composed of the particles with near circles shape (figure 1(a)). These pores were totally disappeared at the highest annealing temperature such as (900 °C). At 700 °C annealing (figure 1(b)), nanoparticles with near cubic shape start grew and were became more crystalline upon annealing at 800 °C (figure 1(c)). The specimen has shown obviously grain boundaries for the near cubic shape when the annealing temperature was 900 °C (figure 1(d)). It should be noted that cracks appeared in (figure 1(d)) due to specimen cutting.
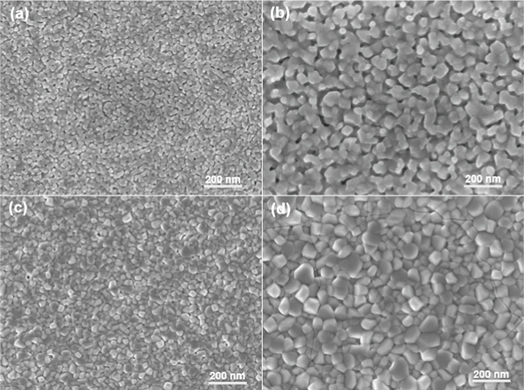
Figure 1. SEM images of 2 mol% specimens annealed at (a) 600 °C, (b) 700 °C, (c) 800 °C, and (d) 900 °C.
Download figure:
Standard image High-resolution imageEffects of dopant concentration on the structure of these thin films were further demonstrated using the energy dispersive x-ray spectroscopy (EDS). The analysis of the EDS elemental mapping for the specimens annealed at 800 °C confirmed the dense structure and the homogeneous distribution of oxygen, titanium, zinc and holmium in the prepared thin films (figure 2). It has to be noted that homogenous distribution of holmium in the thin film specimens presented that these Ho3+ ions were incorporated into the zinc titanate nanocrystals without observation of any segregation over all annealed specimens. More so, the EDS spectrum of these specimens (figure 3) revealed the presence of Ho peaks at ∼1.5 KeV and a negligible faint peaks over the range of 6-7 KeV, and also expose evenly distributed Zn, O, and Ti.
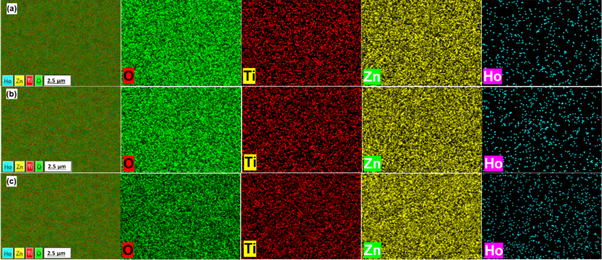
Figure 2. EDS elemental mapping of (a) 1 mol%, (b) 2 mol%, and (c) 3 mol% specimens annealed at 800 °C.
Download figure:
Standard image High-resolution image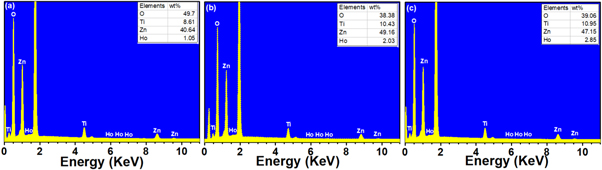
Figure 3. EDS spectra of (a) 1 mol%, (b) 2 mol%, and (c) 3 mol% specimens annealed at 800 °C.
Download figure:
Standard image High-resolution image3.1.2. X-ray diffraction patterns (XRD)
Typical x-ray diffraction patterns for 1, 2, and 3 mol% of Ho3+ ions doped zinc titanate luminescence thin films processed using sol-gel dip-coating method and subsequently annealed in temperature ranging-over 600 °C–900 °C were depicted on figure 4. The phase analysis indicates that the doped thin film specimens annealed at 600 °C are a cubic crystal structure. The detected diffraction peaks were found corresponded and matched very well with (220), (311), (400), (422), (511), and (440) planes of cubic crystalline zinc titanium with a chemical formula ZnTiO3, according to the data given by JCPDS card No.: 39–0190. The miller indices of the prominent peaks are represented in the bottom of (figure 4). When the annealing temperature increased upon 700 °C, the diffraction peaks of the specimens show increases in the intensity which indicates better crystallinity and increases of crystallite size without a change in the phase detected at 600 °C (figure 4(b)). The crystallinity of this phase was became better when annealed at 800 °C (figure 4(c)). Further increasing in annealing temperature upon 900 °C resulted in high crystalline films. The temperature dependence of the crystalline quality of these thin film specimens is checked from temperature dependece of the full width at half maximum (FWHM) using the dominant (311) diffraction peak demonestrated in figure 4. The FWHM of 1 mol% doped specimens was found to be 0.4622, 0.3417, 0.2651 and 0.1730 Å for the films annealed at temperature ranging over 600 °C–900 °C, respectively. This shows that the crystalline quality of the film is improved with increasing the annealing temperature. Furthermore, specimens annealed at 900 °C showed small impuruties existed on the films specimens (figure 4(d)). These impuruties were indexed to titanium dioxide anatase phase (A-TiO2) at ∼25.6° (indicated by circle) according to JCPDS card No.: 53–0619, while the peak at ∼30.6° was assingned to Ho2Ti2O7 cubic pyrochlore (indicated by asterisks) which was found to be matched with JCPDS card No.: 74—1984. However, the diffraction peak at ∼34° was scribed to be due to ZnO phase (indicated by cross) which was found matched very well with JCPDS card No.: 36—1451. Furthermore, the peak intensity for these impurities was increased with increasing the dopant concentration (figure 4(d)). On the other hand, the x-ray diffraction patterns for dominant phase (ZnTiO3) were shows slight shift toward small angles (two-theta) with increasing Ho3+ ions concentration. This shift may be due to the difference in the radii between the dopant with that of Zn and/or Ti. Considering absent of impurities when annealing at lower annealing temperature in range of 600 °C–800 °C, indicating that Ho3+ ions were obviously homogeneously mixed and effectively doped into the host lattice and substituted Zn in Zn2+ site. In addition, because of larger size of the Ho3+ ions incorporated into the crystal lattice compared to that of Zn2+ upon annealing at aforementioned range the shift was occur.
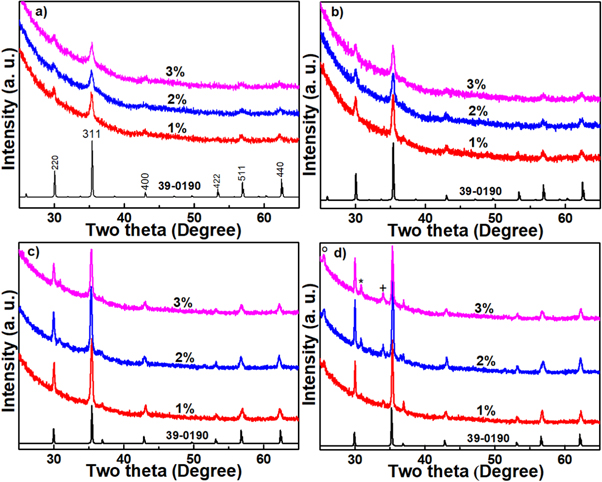
Figure 4. XRD patterns of 1, 2, and 3 mol% specimens annealed at (a) 600 °C, (b) 700 °C, (c) 800 °C, and (d) 900 °C. The bottom line is the reference diffraction patterns of ZnTiO3 (JCPDF No.: 39-0190).
Download figure:
Standard image High-resolution imageDebey—Scherrer equation [30] represented with (equation (1)) and the (311) diffraction peak were applied to estimate and investigate the influence of annealing temperature and dopant concentration on the average diameter of zinc titanate nanocrystals formed in the thin films specimens and the calculated results were listed in table 1.

Where D is crystal diameter, k is the Scherrer constant, λ (nm) is the wavelength of x-ray radiation, β (radian) is the full width at half maxima (FWHM) of the XRD peak, and θ (degree) is the diffraction angle. The lattice constant (a) and volume (V) of the nanocrystals were calculated using the following relations [31];

And;

Where d is the interplanar spacing and h, k, and l are miller indices.
Table 1. Average crystal diameter, lattice constant, and lattice volume for 1, 2, and 3 mol% specimens annealed over the range 600 °C–900 °C.
| Sample concentration | Annealed temperature (°C) | Lattice constant a (Å) | Volume V (Å)3 | Crystal dimeter D (nm) |
|---|---|---|---|---|
| 1 mol% | 600 | 8.428 | 598.72 | 18 |
| 700 | 8.418 | 596.43 | 24.4 | |
| 800 | 8.411 | 594..94 | 31.5 | |
| 900 | 8.422 | 597.40 | 48.2 | |
| 2 mol% | 600 | 8.429 | 598.77 | 15.7 |
| 700 | 8.421 | 597.18 | 20.3 | |
| 800 | 8.429 | 598.82 | 33.6 | |
| 900 | 8.409 | 494.68 | 39.3 | |
| 3 mol% | 600 | 8.425 | 598.01 | 14.9 |
| 700 | 8.417 | 596.39 | 16.3 | |
| 800 | 8.423 | 597.64 | 31.5 | |
| 900 | 8.418 | 596.42 | 41.1 |
The lattice constant (a), and lattice volume (V) as well as interplane spacing that have been calculated from the x-ray diffraction patterns were found to be in a good agreement with that of the JCPDS card data. These results indicate that the specimens were built of highly crystalline thin films. However, the average diameter of ZnTiO3 nanocrystals was infilunced by the annealing temperature. For example, the average diameter for 1 mol% Ho3+ ions doped specimens increased from 18 nm when annealed at 600 °C to 48.2 nm for 900 °C annealing temperature.
3.2. Optical properties
3.2.1. Transmittance spectra
The transmission spectra of specimens annealed at different temperature in the range of 600 °C–900 °C were recorded in the range of 250 to 800 nm, and the results were illustrated in figure 5. The spectrum showed that the specimens have been built of highly transparent thin films in the visible region in an average of ∼90% when annealed at 600 °C. In addition, the transmittance of the specimens slightly decreased to reach an average of ∼85% when annealed at higher temperature such as 900 °C (figure 5(d)). However, the spectra showed sharp decreases in the transmission near the ultraviolet region at ∼365 nm. These absorption edges were determined by ZnTiO3 nanocrystals formed in these thin films specimens. This value gives a possibility of efficient excited for these specimens with a wavelength below 365 nm. Considering the optical band gap of ZnTiO3 nanoparticles (band gap 3.7 eV) [32], the detected absorption edge has small value. Which this red shift can be explained by (Quantum size effect) the difference in size of the nanocrystals [33]. Moreover, the specimens showed interference fringe in the transmission spectra. These fringes may be due to thicker films or weak absorption of light above the absorption edge [34]. However, no observation for influence of dopant concentration on the spectra.
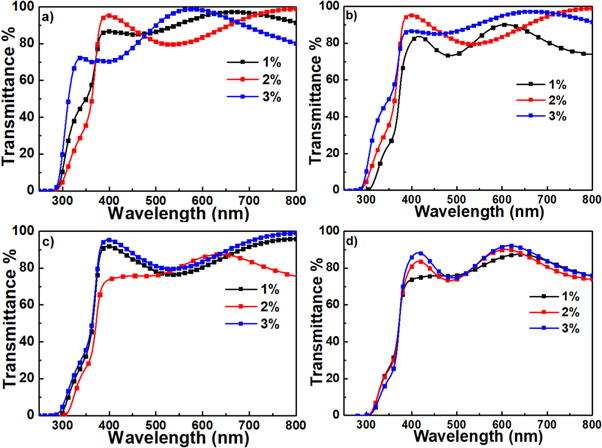
Figure 5. Absorption spectra of 1, 2, and 3 mol% specimens annealed at (a) 600 °C, (b) 700 °C, (c) 800 °C, and (d) 900 °C.
Download figure:
Standard image High-resolution image3.2.2. Excitation spectra
To understand the excitation paths of Ho3+ ions, the photoluminescence excitation (PLE) spectrum of Ho3+ ions doped these ZnTiO3 phosphor thin films, with the emission monitored at room temperature of 546 nm, the results were illustrated in figure 6. Strong sharp excitation peaks were originated, which are commensurate with the f–f transitions from the 5I8 ground state to the higher excited states of Ho3+ ions. The spectrum showed excitation bands which were appeared at ∼309, ∼360, and ∼430 nm and were correspond to the 5I8 → 3D3, 5I8 → 3F4, and 5I8 → 3H6 transitions of Ho3+ ions respectively [1]. The 5I8 → 3D3 transition showed constant intensity and position, which indicates that this transition was not influenced by the dopant concentration and the annealing temperature. However, the specimens annealed at 600 °C, 700 °C, even at 900 °C represented similar behavior. In which the 5I8 → 3F4 transition dominated the spectrum figures 6(a), (b), and (d)), while the spectra of specimens annealed at 800 °C was dominated by 5I8 → 3H6 transition figure 6(c).
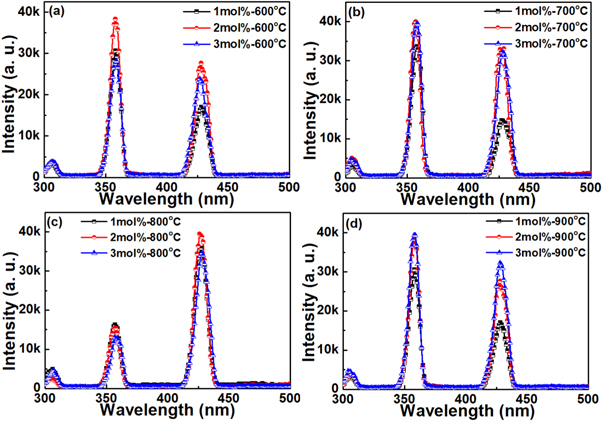
Figure 6. Excitation spectra recorded by monitoring the 546 nm emission for 1, 2, and 3 mol% specimens annealed at (a) 600 °C, (b) 700 °C, (c) 800 °C, and (d) 900 °C.
Download figure:
Standard image High-resolution image3.2.3. Emission spectra
Annealing temperatures and dopant concentration induced structure evolution of these prepared thin films were also have a significant effects on the emission properties. Depending on the excitation results, and in order to investigate the effect of annealing and Ho3+ ions concentration on the PL properties, emission spectra of thin film specimens were recorded at room temperature under 430 nm light excitation (figure 7). Emission spectra of these specimens showed dependence on dopant concentration and annealing temperature. For specimens with 1 mol% of Ho3+ ions, three emission bands were observed ranging-over 500–800 nm. These bands peaking were located at green region ∼547 nm, red region ∼650 nm, and near infrared region ∼755 nm. Appearance of these band emission indicated that Ho3+ ions were incorporated into ZnTiO3 nanocrystals, and these bands were ascribed to 5S2, 5F4 → 5I8, 5F5 → 5I8, and 5I4 → 5I8 transitions of Ho3+ ions respectively. Green light and near-infrared emission occurred due to radiative relaxation to the ground state, while red light emission come from the multi-phonon relaxation through radiative relaxation from 5F5 level to the ground state. Similar bands emission were observed in the spectra of specimens with 2, and 3 mol% of Ho3+ ions (figures 7(b), and (c)). However, the spectra showed a competitive emission between green light and red light depending on the dopant concentration. Of which, green emission dominated the spectrum, and emission intensity was increased with increasing annealing temperature upon 800 °C, then decreased when specimens annealed upon 900 °C. This decreasing in the intensity may be due to the increasing in the interaction between Ho3+ ions, which leads to non-radiative energy transfer from one Ho3+ ion to another Ho3+ ion. Or because of the fact that at higher annealing temperature the morphology of the thin films has become differ as shown in (figure 1), thus increasing the total internal reflections resulted in decreasing emission intensity of specimens. Moreover, infrared band emission showed approximately constant intensity (figure 7).
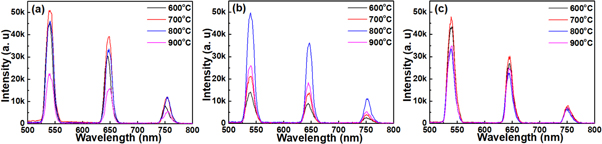
Figure 7. Emission spectra of (a) 1 mol%, (b) 2 mol%, and (c) 3 mol% specimens annealed in the range of 600 °C–900 °C under 430 nm light excitation.
Download figure:
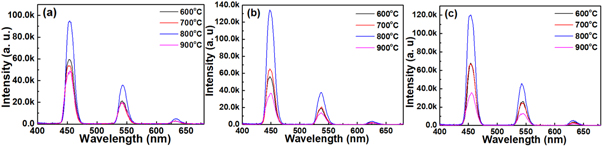
Standard image High-resolution imageIn addition, emission properties of these thin film specimens were further investigated under 360 nm light excitation, and the result was illustrated in (figure 8). Three emission bands were observed covered blue, green, and red regions. Very strong blue emission was observed at around 450 nm attributed to 5F1 → 5I8 transition, green emission at ∼547 nm due to 5S2, 5F4 → 5I8 transition, where a faint hump red emission at ∼645 nm revert to 5F5 → 5I8 transition of Ho3+ ions. However, the red light band emission centering at ∼645 (5F5 → 5I8) exhibit constant intensity and blue shift with around 5 nm of that was recorded under 430 nm excitation, while green light transition showed dependence on annealing temperature and Ho3+ ions concentration. More so, with increase in annealing temperature upon 800 °C, the ∼450 nm band blue emission intensity was further enhanced compared to that of green band, and finally dominated the whole emission spectra (figure 8). However, the specimen with 2 mol% of Ho3+ ions concentration was found has a higher emission intensity, which was considered as the optimal concentration.
Figure 8. Emission spectra of (a) 1 mol%, (b) 2 mol%, and (c) 3 mol% specimens annealed in the range of 600 °C–900 °C under 360 nm light excitation.
Download figure:
Standard image High-resolution image
4. Conclusion
The influnce of dopant concentration and the annealing temperature on the structure and optical properties of obtained ZnTiO3: Ho3+ phosphor thin films were investigated. detailed structual evolution analyses for specimens was performed by various techniques including XRD, SEM, and EDS. The crystalline quality of the deposited films improved with increasing annealing temperature, and the crystal size varied between 15 nm and 48 nm. Ho3+ ions were incorporated into ZnTiO3 nanocrystals. The photolumindcence emission at room temperature of these thin film specimens could be controlled by the excitation wavelength. The specimens shows blue and green emission under 360 nm and 430 nm light excitation. These color-tunable ZnTiO3: Ho3+ phosphor thin films can be used for several applications such as optical displays.
Acknowledgments
The first author admit the financial support from Sudanese government and the Chinese Scholarship Council (CSC grant No. 2015GF058).