

Abstract
This paper reports the investigation on structural, morphological, thermal, gas sensing, electrical conductivity and dielectric properties of polyaniline (PANI)/phenothiazine (PTZ) blend filled with different contents of copper sulphide (CuS) nanoparticles. The prepared nanocomposites were analyzed through Fourier-transform infrared (FTIR), UV–vis spectroscopy, x-ray diffraction (XRD), Field emission scanning electron microscopy (FE-SEM), transmission electron microscope (TEM), thermogravimetric analysis (TGA) and impedance studies. The presence of CuS in the blend led to some changes in the position of peaks in the FTIR and UV spectrum. XRD displayed a significant increase in crystallinity and intensity of the composite with increasing the amount of CuS nanoparticles. A granular morphology of the composite as compared to pure blend was confirmed by SEM and TEM images. The TGA results indicated that the onset degradation temperature of PANI/PTZ blend nanocomposites was shifted towards higher temperature in the presence of CuS nanoparticles. The dielectric constant and dielectric loss tangent (tan δ) decreased, whereas the AC conductivity increased with increasing frequencies. The dielectric properties, AC and DC conductivity of polymer blend increased with increase in CuS loading and showed maximum electrical properties at 10 wt% loading. The ammonia gas sensing performance of the blend nanocomposites was significantly enhanced by the addition of CuS nanoparticles. These results suggest that PANI/PTZ/CuS nanocomposites with improved electrical conductivities, gas sensing and dielectric properties seem to be promising materials for designing electrical or nano-electronic devices.
Export citation and abstract BibTeX RIS
Introduction
The reinforcement of inorganic nanomaterials into conducting polymers have attracted both academic and industrial attention during the last few decades due to their superior chemical resistance, electrical conductivity, flame retardancy, thermal stability and mechanical properties and are being considered for advanced applications in many industrial fields [1–5]. Composite materials compromising the inorganic material and polymeric material can be assembled in general by combining any sort of inorganic material especially in nanometer range with any sort of polymeric material. The homogeneous dispersion of nanoparticles into a polymer matrix greatly improved the properties of polymers that cannot be derived from other composites counterparts. Recently several researchers have paid more attention to the investigation of the applications of metal incorporated nanocomposites and many interesting works have been extensively reported [6–9].
Polymer blending is an easy technique for developing new materials with desired properties. It is widely used for enhancing the electrical and mechanical properties of polymer blend in various applications such as materials for fuel cells, electrostatic charge dissipation, embedded capacitors, electrochemical sensors, electronics and photonics [10]. The properties of polymer blend depend on the interaction between the blend components and processing conditions. The reactive functional group present in the blend components can capable of forming strong intermolecular interactions (hydrogen bonding) or polar-polar interactions are the main causes of good polymer-polymer miscibility or the compatibility of the system [11, 12].
Conducting polymers such as polyaniline, polypyrrole, polythiophene, polyindole are widely used for commercial applications because of its high mobility of charge carriers and can act as hosts for the trapping of metals and semiconducting nanoparticles [13, 14]. Among them, polyaniline (PANI) has become a particular interest because of its easy preparation environmental stability and redox properties [15]. However, options for the processing of polyaniline are limited because it is soluble in very few organic solvents and decomposes prior to melting. This restricts the synthetic routes and desires challenging methodology for the fabrication of PANI nanocomposites. This problem can be overcome by the blending of suitable semiconducting compounds or by the incorporation of various inorganic nanoparticles into PANI matrix with the aim of increasing the mechanical properties of the resultant polymer matrix [16].
Phenothiazine (PTZ) is one of the cheap heterocyclic compounds with nitrogen and sulfur functionality. This molecule is better suited for the development of enhanced intramolecular charge transfer polymers due to its electron-rich nature and shows excellent electronic, magnetic and optical properties which find various technological applications [17]. The blending of PANI with PTZ will ultimately pave the way for the preparation of a low-cost blend matrix without compromising with the quality of the furnished product. The properties of conducting polymer blends can further be improved by mixing with metal nanoparticles [18]. The physical and mechanical properties of polymer blend composite depend on the polarity of the polymer, the amount, and properties of the nanofillers, filler dispersion, particle size, and filler-polymer interfacial adhesion [19, 20]. Keeping these ideas in mind, the proposed work endeavored to study the effect of copper sulfide nanoparticles on the physic-mechanical properties of PANI/PTZ blend. The main objective of the present work is to explore the effect of CuS nanoparticles on the structural, thermal, electrical conductivity and dielectric properties of PANI/PTZ blend. To our knowledge, to date, no studies have been carried out on thermal, electrical conductivity and dielectric studies of PANI/PTZ/CuS nanocomposite. The present work focused on the development of a new class of PANI/PTZ/CuS nanocomposite through a simple, inexpensive and eco-friendly ball mill mixing technique. We also investigate in detail the effect of CuS on the ammonia gas sensing performance of the PANI/PTZ blend.
Experimental
Materials and methods
Aniline (Merck) was purified by double distillation. Ammonium peroxy disulphate (APS), acetone, ethanol (Merck), cetyltrimethylammonium bromide (CTAB), copper acetate monohydrate, thioacetamide (Hi-Media), phenothiazine (Aldrich), dimethyl sulphoxide (Aldrich) were used in this study. Deionized water was used as a solvent for all studies.
Synthesis of polyaniline
Polyaniline was synthesized by the chemical oxidative polymerization method at 0 °C–5 °C with slight modification as reported earlier [21]. First, 7 mM of aniline was mixed with 50 ml of 1 M HCl solution and stirred it well. APS was added to the above solution to initiate the polymerization reaction (here the mole ratio of aniline: APS = 1:1). The reaction was carried out for 4 h at 0 °C under constant stirring. Finally, the polymer formed was repeatedly washed with deionized water, ethanol, dilute HCl, and acetone and then dried at 60 °C for 24 h.
Synthesis of copper sulfide (CuS) nanoparticles
Copper sulphide nanoparticles were synthesized by the reaction between thioacetamide and copper acetate according to our previously reported method [22]. An appropriate amount of thioacetamide and copper acetate monohydrate were separately dissolved in deionized water. An aqueous solution of CTAB (0.1 g in ml water) was added into the above copper acetate monohydrate. This homogeneous mixture was added drop wise to the thioacetamide solution and stirred it for 12 h. The CTAB trapped CuS nanomaterial was filtered and washed with water and dried.
Preparation of PANI/PTZ/CuS nanocomposites
The nanocomposite based on polyaniline/phenothiazine blend with different contents of CuS was prepared by a simple high-energy ball milling method. The PANI and PTZ were mixed in the ratio 50:50 in the ball mill. The CuS nanoparticles with different contents (0, 3, 4, 7, 10 and 15 wt%) were dispersed with the above blend and mixed homogeneously via high-energy ball milling for 1 h in an agate jar.
Characterizations
Fourier Transform Infrared spectroscopy (FT-IR) analysis of PANI/PTZ/CuS blend nanocomposites was scanned from 4000 cm−1 to 400 cm−1 using a JASCO (Model 4100) spectrometer. The UV–vis absorption spectrums of PANI/PTZ blend with different contents of CuS nanoparticles in dimethyl sulfoxide were carried out in a Perkin Elmer Lambda 650 spectroscopy. The crystalline nature of polymer blend nanocomposites was characterized by x-ray diffractometer (Bruker AXS D-8 Advance Diffractometer) using CuKα (λ = 1.5407 Å) radiation. The morphology of the prepared samples was studied through scanning electron microscopy (SEM) using Carl Zeiss VP-500 model. The structure of the nanocomposite was characterized by high-resolution transmission electron microscopy (HRTEM- JEOL/JEM 2100). Thermal analysis of the blend nanocomposites was studied by Hitachi STA7200 thermogravimetric analyser at a heating rate of 10 °C min−1 (atmosphere N2; flow 40 ml min−1). Dielectric and impedance characterization of the prepared samples were carried out using a Hewlett Packard fully automatic LCR meter (HP 4284 A). DC conductivity of samples at room temperature was measured using a Keithley 2400 system digital electrometer. The ammonia gas sensing ability of the nanocomposites was measured by placing the circularly shaped samples in a silver plate. This sample was then placed in a glass chamber which had an inlet and an outlet for the passage of gas. The ammonia gas (0–400 ppm) was passed through this chamber and the electrical resistance of the samples was measured using a multi-function digital multimeter (MECO Meters Pvt. Ltd, Mumbai, India). The gas was evacuated after each cycle from the chamber and the sensor was placed in atmospheric air for recovery. The response or sensitivity of gas had been determined as (Ri−R0)/R0, where Ri and R0 are the resistance of sensors in ammonia and in the air, respectively. The gas sensitivity test was carried out three times measurement and average values were taken. The experimental setup for the ammonia gas sensing study was illustrated in figure 1. All sensing measurements were carried out at room temperature.
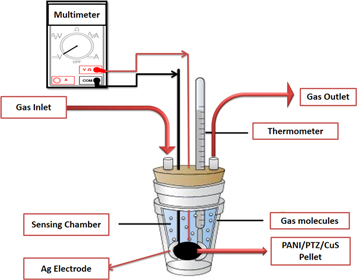
Figure 1. Schematic representation for the ammonia gas sensing study.
Download figure:
Standard image High-resolution imageResults and discussion
FTIR spectra
FT-IR spectroscopy is a powerful technique to study the complexation and interactions of multi-component system, such as polymer nanocomposites. Figure 2 shows the FTIR spectra of CuS and PANI/PTZ blend with 7 and 15 wt% CuS nanocomposites. The strong and sharp band observed at 618 cm−1 in the spectra is assigned for the stretching of copper and sulfur sub-lattices [22]. In the case of PANI/PTZ blend, the large band appearing at 3458 cm−1 is the NH stretching vibration peak from the intermolecular hydrogen bonds. The two absorption bands at 1563 and 1473 cm−1 refer to the stretching of the quinoid and benzenoid ring of from blend. The peak at 1297 cm−1 is the C–N stretching and the C–H in-plane bending of polymer blend occurs at 1332 cm−1 [21]. The out-of-plane bending vibration of the C–H bond appears at 744 cm−1 confirms the effective interaction of PANI and PTZ components. It can be seen that the spectrum of PANI/PTZ/CuS showed the characteristic absorption bands of the blend with the presence of an additional band at 605 cm−1, indicating the presence of CuS stretching in the blend matrix. Moreover, as compared with the spectra of PANI/PTZ, the NH stretching vibration of the composite is found to be shifting to a lower IR region (i.e., from 3458 cm−1 to 3426 cm−1 by the insertion of nanoparticles. The appearance of a new peak along with changes in the existing peaks and or their disappearance in the FTIR spectra directly indicates the interfacial interactions of CuS with PANI/PTZ blend.
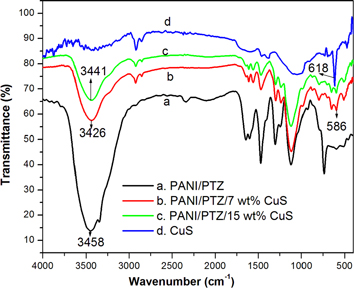
Figure 2. FTIR spectra of CuS, PANI/PTZ blend with diffrent contents of CuS nanoparticles.
Download figure:
Standard image High-resolution imageUV–vis spectra
Figure 3 shows the UV–vis spectra of PANI/PTZ blend with different contents of CuS nanoparticles. All the samples exhibit broad absorption maxima in the UV spectra. The prominent absorption band at 381 nm is attributed to the π to π* electronic transition of the polymer blend. However, the UV spectra of all blend composite become much broader and the absorption bands are shifted to higher wavelength region with respect to their original value in PANI/PTZ blend. The increase in broadness and shift in UV peak is an indication of the strong interfacial interaction between the blend components and the metal sulphide particles and the shift is more pronounced in the composite with 10 wt% loading (i.e., from 381 nm to 410 nm). The UV results lead to the conclusion that the proper distribution of CuS nanoparticles in the macromolecular chain of PANI/PTZ blend induces conformational and structural changes of the polymeric chains.

Figure 3. UV–visible spectra of PANI/PTZ blend with different contents of CuS nanoparticles.
Download figure:
Standard image High-resolution imageX-ray diffraction analysis (XRD)
The XRD pattern of PANI/PTZ with different dosage of CuS nanoparticles in the 2θ range of 10–80 at 25 °C is given in figure 4. The prepared Cus nanoparticles show the crystalline diffraction peaks at 2θ = 27.9°, 29.3°, 32.3°, 32.9°, and 48.2° [22]. All these diffraction peaks can be perfectly indexed to the hexagonal structure of covellite (CuS), which is in accordance with that of the standard spectrum (JCPDS no. 06-0464). The average crystal grain size of the synthesized CuS nanoparticles was calculated using Scherer's formula given by D = 0.9λ/βcosθ; where D is the average crystallite size, λ is the x-ray wavelength (1.5407 Å) and β is the full width at half maximum in radian. The average size of the CuS nanoparticle is found to be 16 nm. The PANI/PTZ blend exhibits five crystalline peaks at 2θ = 9.82, 13.67, 18.28, 24.98 and 32.09° suggesting the formation of structural regularity in the blend system. XRD patterns of the polymer blend with different CuS compositions show all the characteristic crystalline peaks of polymer blend with the intense peaks of CuS nanoparticles. It can be found that the peaks of PANI/PTZ show an evident reduction in intensity after the incorporation of CuS into the blend matrix, indicating a preferential alignment of the nanoparticles on the substrate. Additionally, the intensity of the crystalline peaks of CuS in the blend is found to be slightly increased with the increase in the loading of nanoparticles. Hence it can be inferred that the CuS particles are encapsulated by the macromolecular chain of PANI/PTZ blend.
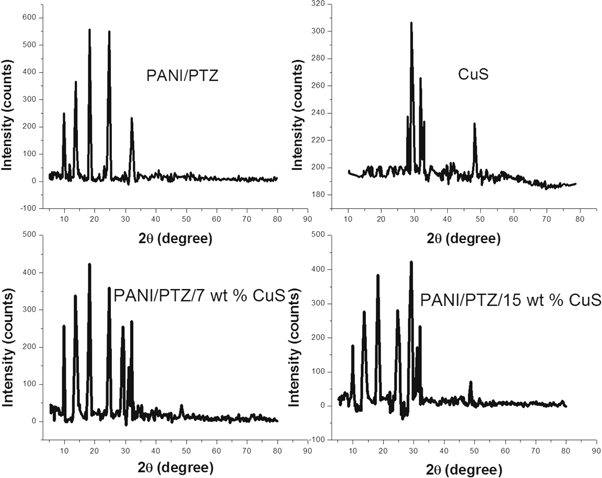
Figure 4. XRD patterns of CuS, PANI/PTZ blend with different contents of CuS.
Download figure:
Standard image High-resolution imageScanning electron microscopy (SEM)
Scanning electron microscopy provides information about the dispersion of nanoparticles in polymers. Figure 5 shows the SEM photographs of PANI/PTZ blend with different contents of CuS nanoparticles. It is clear from figure 5(a) that the morphology of PANI/PTZ blend exhibits a more rugged fracture surface. The polymer blend composites filled with CuS particles (figure 5(b)) shows uniformity in structure with good dispersion of CuS nanoparticles The uniform dispersion provides enhanced polymer blend matrix-CuS interface contact. The average grain size is found to be 80 nm to 180 nm. It can be seen that the grains are interconnected with each other, which indicate that they have enough binding energy to combine with neighbour grains or molecules. For composite materials, this is the precondition for the outstanding dielectric properties and electrical conductivity. However, at higher loading of nanoparticles (15 wt%), the uniform morphology of the blend composite (figure 5(c)) is slightly changed with elongated structure, indicating greater stress developed in the polymer blend matrix.
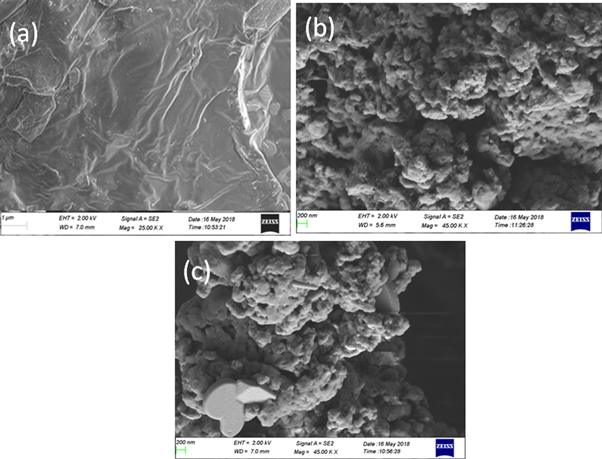
Figure 5. SEM images of (a) PANI/PTZ blend (b) PANI/PTZ /10 wt% CuS and (c) PANI/PTZ / 15 wt% CuS.
Download figure:
Standard image High-resolution imageHigh-resolution transmission electron microscopy (HRTEM)
HRTEM characterization is used to further reveal the morphology and structure of CuS embedded PANI/PTZ blend. Figure 6 shows the HRTEM images of a polymer blend with 7 and 15 wt% of CuS nanoparticles. The TEM micrograph in (figure 6(a)) reveals the presence of spherically shaped particles which resulted from the encapsulation of nano-sized CuS particles by the in blend segments. The average size of the particles as estimated from the measurement of the size of the composite particles present across the cross-section of the micrograph has been estimated and found to be in the range of 10 to 25 nm. However, the TEM picture of 15 wt% sample (figure 6(b)) is changed into flakes like structure. The filler particles are too closer at higher loading which then undergoes overlapping with each other. This prevents the efficient interaction between CuS nanoparticles and polymer blend chain.

Figure 6. HRTEM photographs of (a) PANI/PTZ/10 wt% CuS and (b) PANI/PTZ /15 wt% CuS.
Download figure:
Standard image High-resolution imageThermogravimetric analysis (TGA)
The thermal degradation pattern of PANI/PTZ blend and its nanocomposites with varying concentration of CuS nanoparticles have been monitored by TGA in a nitrogen atmosphere and are shown in figure 7. It shows that the on-set decomposition of samples at 140 °C due to the liberation of water followed by the decomposition of the oligomer [23]. The final weight loss from 155 to 700 °C is the decomposition of blend components within the crystalline phase of the nanoparticles. As seen from TGA curves, the pure polymer blend showed a weight loss of 45.37%, whereas the composite with 7 and 15 wt% CuS samples showed a final weight loss of 49.62 and 56.39% respectively. These results indicate that there is some interaction between CuS nanoparticles and the macromolecular chain of PANI/PTZ blend.
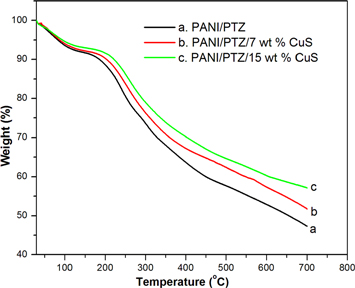
Figure 7. TGA patterns of PANI/PTZ blend with different contents of CuS nanoparticles.
Download figure:
Standard image High-resolution imageAC conductivity
Figure 8 shows the variation of room temperature AC conductivity as a function of frequency for CuS filled and unfilled PANI/PTZ blend. The AC electrical conductivity of all the samples increases in the entire range of frequencies is due to the semicrystalline nature of the polymeric system as indicated by the x-ray diffraction studies. The AC conductivity of polymer blend nanocomposites is higher than that of the pure PANI/PTZ blend. The enhanced conductivity of nanocomposite is due to effective dispersion of CuS nanoparticles and it is evident from TEM images. A slight increase in AC conductivity with frequency is noted up to 104 Hz and thereafter the conductivity increased steeply. These steep increases in AC values at higher frequencies are attributed to the formation of short-range intra-well hopping of charge carriers within in the polymer blend matrix [24, 25]. It is also evident that the AC conductivity increases with the increase in loading of CuS up to 10 wt% and then decreases. The higher AC conductivity at this loading is attributed to the strong interfacial interaction between nanoparticles and the polymer blend segments. However, the conductivity of 15 wt% sample is lower than the 10 wt% CuS filled polymer blend. This is due to the poor dispersion or agglomeration of nanoparticles in PANI/PTZ blend which resist the formation of continuous conductive pathways within the polymer matrix. It can be suggested that the addition of CuS nanoparticles increases the AC conductivity of PANI/PTZ host, making the present work expected to be more suitable in photonic and electronic device applications.

Figure 8. The AC conductivity of PANI/PTZ blend with various concentrations of CuS nanoparticles.
Download figure:
Standard image High-resolution imageDielectric analysis
Dielectric constant and dielectric loss
The dielectric properties of polymer blend composites have been analyzed in terms of frequency and different volume fraction of nanofillers. Figures 9 and 10 shows the variation of dielectric constant (εr), and dielectric loss (Tan δ) of PANI/PTZ blend with different contents of CuS at various frequencies. In all these samples, as frequency increased the εr and tan δ values decreased sharply up to the frequency of 104 Hz and became constant at higher frequencies. The decrease in dielectric properties with increasing frequency is attributed to the contribution of different polarization such as electronic, ionic, dipolar and space charge polarization [26]. The very high dielectric constant of nanocomposites at low frequency arises from the interfacial polarization. This behavior was also observed by Abdullah et al [27] at room temperature. The large value of dielectric loss at a lower frequency is also due to the motion of free charge carriers within the materials. At higher frequencies, the larger polar groups in the blend do not properly orient in the direction of the applied electric field and hence the dielectric properties became nearly constant. It can be seen from the figure that the dielectric constant and dielectric loss of the polymer blend composite is higher than the pure polymer blend and the magnitude of these properties increases with increase in the certain concentration of nanoparticles in all the frequencies. The higher dielectric properties of 10 wt% composite is due to the interfacial polarization which increases the movement of charges and hence shows an increase in the dielectric value of the composite. When the concentration of nanoparticles reached to 15 wt%, the synergetic interaction in polymer composite is greatly reduced which result in the formation of a small amount of discrete aggregates in the polymer matrix leading to poor dielectric values.

Figure 9. Variation of the dielectric constant of PANI/PTZ with different concentrations of CuS.
Download figure:
Standard image High-resolution image
Figure 10. Dielectric loss tangent versus frequency plots for PANI/PTZ blend with CuS nanoparticles.
Download figure:
Standard image High-resolution imageDC conductivity
Figure 11 represents the current-voltage (I–V) characteristics (DC conductivity) of PANI/PTZ blend with different contents of CuS nanoparticles. The linear increase in conductivity is noted up to a certain concentration of nanoparticles (10 wt%) and the conductivity of all the composites are higher than that of the pure polymer blend. There are two types of conductive mechanism operates in polymer composites. One is the Ohmic conduction and the second one is the non-Ohmic conduction. The linear variation in electric current with applied voltage for composite with a certain concentration of nanoparticles (10 wt%) suggests that the direct contact mechanism is operating in this system [28, 29]. However, a decrease in I-V characteristic is observed for the composite with 15 wt% filler. This means that the barrier-tunneling conductive mechanism is not operating at higher loading of fillers is due to the aggregation of conducting fillers which separated from the polymer layer.
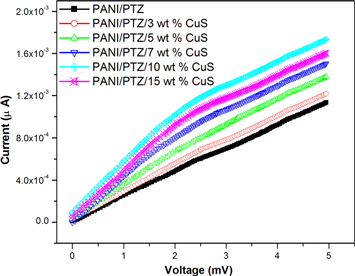
Figure 11. DC conductivity of PANI/PTZ blend with different contents of CuS nanoparticles.
Download figure:
Standard image High-resolution imageGas sensing applications
The increased electrical conductivity with various polar functional groups in the backbone of conducting polymers can be used as a selective layer in a chemical-vapour sensor such as resistance type detectors. The change in electrical resistance of PANI/PTZ and its composites with various contents of CuS nanoparticles upon to 100 ppm ammonia gas is presented in figure 12. The electrical resistance of all the samples is enhanced by the exposure of ammonia gas. PANI/PTZ blend showed a higher resistance. The mechanism of the gas sensor is originated from the diffusion of ammonia gas into PANI/PTZ. The NH3 molecule donates electron into the macromolecular chain of PANI/PTZ which increases the electrical resistance of the polymer blend. When nanocomposites are exposed to NH3, the conductivity of nanocomposite is highly enhanced as compared to the pure polymer blend. The high sensing property of nanocomposite is mainly arising from the high surface area of nanoparticles which resist the interaction zone of the composite with ammonia gas [30, 31]. However, the interaction of ammonia with 10 wt% nanocomposite is poor which in turn lowers the electrical resistance. The sample with 15 wt% CuS incorporated blend shows higher electrical resistance value than 10 wt% composite. This is due to the agglomeration of nanoparticles which is already confirmed by the TEM and SEM analysis.
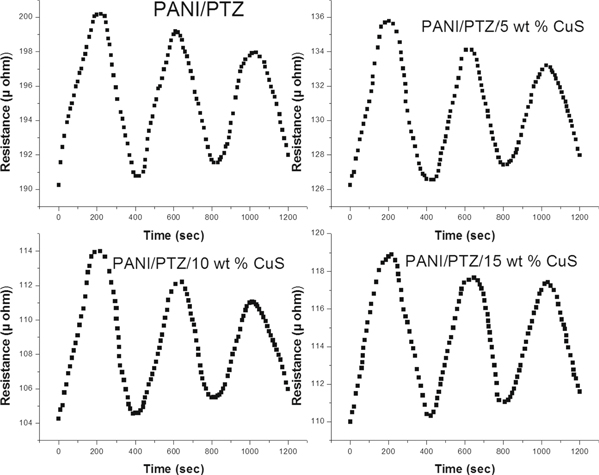
Figure 12. Gas sensing response for ammonia gas of PANI/PTZ with various contents of CuS.
Download figure:
Standard image High-resolution imageThe changes in gas sensing property of all the samples at 100 ppm with respect to different time interval are demonstrated in figure 13. It can be seen that the sensitivity linearly increased by the exposure of ammonia gas. The nanocomposite shows higher gas sensitivity than pure polymer blend at room temperature and 10 wt% CuS shows the highest sensitivity.

Figure 13. Gas sensitivity of PANI/PTZ blend nanocomposite at 100 ppm ammonia gas.
Download figure:
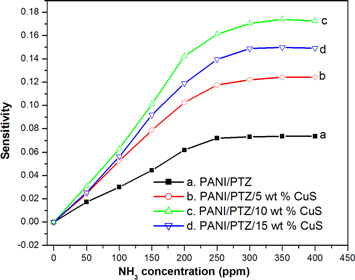
Standard image High-resolution imageFigure 14 shows the variation of sensitivity of PANI/PTZ/ CuS blend nanocomposites for various concentration of ammonia gas (50, 100, 150, 200, 250, 300, 350 and 400 ppm) at room temperature. It is clearly observed that the sensitivity tends to saturate with an increase in concentration NH3 molecules. At lower concentrations of ammonia gas, the surface reaction is poor due to lower coverage of gas molecules on the grain surface whereas the number of the surface reactions and sensitivity is significantly increased at higher concentration of ammonia. The saturation reached at higher concentrations is due to the entire surface coverage of samples with the ammonia gas molecules.
Figure 14. Gas sensitivity of PANI/PTZ/CuS nanocomposite with different concentration of ammonia gas.
Download figure:
Standard image High-resolution image
Furthermore, the selectivity of a sensor is also an important parameter that needs to be considered. For measuring the selectivity, the fabricated sensor is tested with various concentration of ammonia. The gas response data within the time of ∼25 s are presented in table 1. It is evident that the sensor is more sensitive to PANI/PTZ/CuS hybrid in comparison with pure PANI/PTZ. Among the nanocomposites, the sample with 10 wt% CuS filled PANI/PTZ is more sensitive due to the efficient dispersion of nanoparticles in the blend matrix. A decrease in response factor is observed with increasing the content of metal sulphide nanoparticles (15 wt% composite) in the polymer matrix. This is due to the charge compensation by agglomerated nanoparticles and the sensor becomes incapable of accepting electrons from ammonia molecules [32]. The fabricated nanocomposite can be used as a promising material for gas sensing applications.
Table 1. Response factor values for sensing different concentration of NH3 by PANI/PTZ/ CuS.
| Different concentration of ammonia (ppm) | ||||
|---|---|---|---|---|
| Samples | 100 | 200 | 300 | 400 |
| PANI/PTZ | 0.19 | 0.33 | 0.51 | 0.54 |
| PANI/PTZ/5wt% CuS | 0.31 | 0.49 | 0.68 | 0.72 |
| PANI/PTZ/10wt% CuS | 0.46 | 0.66 | 0.85 | 0.88 |
| PANI/PTZ/15wt% CuS | 0.40 | 0.59 | 0.79 | 0.81 |
Conclusions
Copper sulfide nanoparticles were embedded in PANI/PTZ blend with different filler ratios 0, 3, 5, 7, 10 and 15 wt%. The shift of absorption peaks in the UV-Vis and FTIR spectra confirmed the interaction between nanoparticles and polymer blend molecules. XRD analysis showed a regular structured blend matrix to lodge CuS particles. SEM and TEM photographs showed that uniform dispersion of the nanoparticles in the blend occurred at a concentration of 10 wt% of CuS. Thermogravimetric results revealed the enhancement of thermal stability of PANI/PTZ blend due to the incorporation of CuS particles. The electrical conductivity (AC and DC) of composites were higher than pure PANI/PTZ and the maximum conductivity was obtained for 10 wt% of nanoparticles. The dielectric constant and dielectric loss was found to decrease with increasing frequency but increase with increasing the concentration of CuS nanoparticles. All the composites exhibit a better gas sensitivity and selectivity to NH3 compared with pure PANI/PTZ blend. The maximal gas sensitivity and selectivity was observed for 10 wt% of CuS nanocomposite. The maximum filler concentration leads to a decrease in gas sensitivity due to the increase in defects in the structure of the nanocomposite. This blend composite is a suitable material for nanoelectronic devices and sensing applications.
Acknowledgments
The author (M T Ramesan) acknowledges financial support from Kerala State Council for Science Technology and Environment (KSCSTE), Kerala, India (Order No. 566/2017/KSCSTE).