

Abstract
We report self flux growth and characterization of FeTe1-xSx (x = 0.00 to 0.25) single crystal series. Surface x-ray diffraction (XRD) exhibited crystalline nature with growth in (00l) plane. Micro-structural (electron microscopy) images of representative crystals showed the slab-like morphology and near stoichiometric composition. Powder XRD analysis (Rietveld) of single crystals exhibited tetragonal structure with P4/nmm space group and decreasing a and c lattice parameters with increase in x. Electrical resistivity measurements (ρ-T) showed superconductivity with  at 9.5 K and 8.5 K for x = 0.10 and x = 0.25 respectively. The un-doped crystal, i.e., x = 0.00, exhibited known step like anomaly at around 70 K. Upper critical field Hc2(0), as calculated from magneto transport [ρ(T)H], for x = 0.25 crystal is around 60Tesla and 45Tesla in H//ab and H//c directions. Thermal activation energy [U0(H)] calculated for x = 0.10 and 0.25 crystals followed weak power law, indicating single vortex pinning at low fields. Mossbauer spectra for FeTe1-xSx crystals at 300 K and 5 K are compared with non superconducting FeTe. Both quadrupole splitting (QS) and isomer shift (IS) for S doped crystals were found to decrease. Also at 5 K the hyperfine field for x = 0.10 superconducting crystal is decreased substantially from 10.6Tesla (FeTe) to 7.2Tesla. For x = 0.25 crystal, though small quantity of un-reacted Fe is visible at room temperature, but unlike x = 0.10, the low temperature (5 K) ordered FeTe hyperfine field is nearly zero.
Export citation and abstract BibTeX RIS
Introduction
Fe based compounds were mainly known for their magnetic properties and observation of superconductivity in them was thought to be a far cry. However, the scenario changed dramatically after the discovery of superconductivity in Iron based compounds, first in Iron pnictides [1, 2] and later in Iron chalcogenides [3]. This attracted huge attention of scientific community in the field of superconductivity. Iron based superconducting compounds and high Tc [HTSc] Cuprates [4, 5] are known to be outside the conventional BCS (Bardeen Cooper & Schrieffer) theory of superconductivity [6]. Another superconductor discovered after the high Tc Cuprates, i.e., MgB2 yet follows the BCS in its strong coupling limit [7].
The Fe chalcogenide compounds are known to possess most simple crystal structure among other Fe based superconductors. The ground state of Fe chalcogenides i.e., FeTe orders anti-ferromagnetically along with coupled structural/magnetic phase transitions at below around 70 K. The coupled structural/magnetic phase transition of FeTe is seen clearly in electrical, thermal and magnetic measurements at around the same temperature [8–10]. The substitution of S/Se at Te site in FeTe introduces superconductivity by suppressing the anti-ferromagnetic ordering [8, 11–14]. The highest superconducting temperature (Tc) for Fe(Te/Se, S) chalcogenides series is achieved at approximately 15 K for FeSe0.50Te0.50 at ambient conditions [8, 15]. Further, the Tc of Fe chalcogenide systems, increases up to 27 K under high pressure [16] and to above 50 K with favourable alkali metal intercalations [17–19].
The single crystal growth of Fe chalcogenide superconductors is rather difficult and mainly the self flux Bridgman and the added flux (KCl/NaCl) with complicated heat treatments are employed for crystal growth [20–24]. Bridgman method is quite expensive as the same employs state of art furnaces. On the other hand flux method is marred with foreign contamination, which is difficult to remove completely; hence self flux method is preferred to grow quality single crystals. As far as growth of FeTe1-xSx single crystals is concerned the same is rather difficult due to large difference between the ionic radius of Te−2(211 pm) and S−2 (186 pm) [25]. Here, we report self flux crystal growth and superconductivity characterization of FeTe1-xSx (x = 0.00 to 0.25) series. After, repeated runs, we are been able to grow the single crystals of FeTe1-xSx series by self flux method. Superconductivity occurs in FeTe1-xSx with increase in Te site S substitution and the magnetic ordering (∼70 K) for FeTe gets gradually suppressed. Host of physical properties including structural details, morphology, superconductivity and Mossbauer spectroscopy are reported here for FeTe1-xSx single crystal series. In our view, this is detailed study of large single crystal of FeTe1-xSx series using self flux method. Earlier only tiny/flux assisted single crystals or poly-crystals of FeTe1-xSx series were reported [12, 14, 25]. Further, worth mentioning is the fact that although Fe chalcogenide superconductivity is heavily studied for both poly and single crystal of FeTe1-xSex [3, 8–10, 15], the same is only scant for FeTe1-xSx [12, 14, 25].
Experimental details
All the studied FeTe1-xSx (x = 0.0 to 0.25) single crystals are grown via melt process in a simple programmable furnace using self flux method from constituent elements of 99.99 purity. Well mixed stoichiometric powders were pelletized, vacuum sealed in quartz tube and kept in a furnace. The heating schedule involved various steps at 1000 °C, 200 °C, 500 °C and 750 °C in case of S doped crystals [26] and slightly simpler route for pristine x = 0.0 crystal [27]. Reference [26] deals with only x = 0.10 Sulfur doped crystal and very few results obtained at that time on the same were reported in a conference. The same heat treatment as used for x = 0.10 is applied for x = 0.05 and 0.25, which resulted in good crystals. Beyond x = 0.25 we could not grow the S doped FeTe1-xSx crystals. The reason may be large difference between the ionic radius of Te−2(211 pm) and S−2 (186 pm) [25]. Basically, the crystals are grown from melt of mixed and well pulverized stoichiometric constituent elements by slow cooling with good range of Sulfur solubility at Te site of up to 25%. The transport and magnetization results are obtained on Quantum Design (QD) Physical Property Measurement System (PPMS) down to 2 K under applied magnetic field of up to 14 Tesla. 57Fe Mossbauer measurements were done on crushed powders of the synthesized single crystals in transmission mode having 57Co as radioactive source.
Results and discussion
Heat treatment schedule employed for single crystal growth of FeTe1-xSx (x = 0.05 to 0.25) is shown by the schematic diagram in figure 1. This heat treatment is different than the one being employed for growth of FeTe or FeTe1-xSex single crystals (shown in right inset of figure 1). Only, after several trials, we could optimize the final heating schedule to grow large (cm size, left inset of figure 1) FeTe1-xSx (x = 0.0 to 0.25) single crystals. The heat treatment thus employed for FeTe1-xSx was checked for reproducibility and found alright.
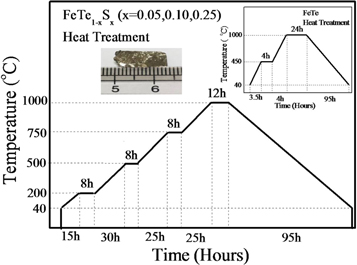
Figure 1. Schematic heat treatment diagram to grow of FeTe1-xSx (x = 0.05 to 0.25) single crystal series. Left Inset view is picture of synthesized crystal; right inset view is heat treatment of FeTe single crystal.
Download figure:
Standard image High-resolution imageSEM (Scanning electron microscopy) images and EDX (Energy dispersive x-ray analyzer) are useful for understanding the morphology and elemental analysis of the synthesized samples. SEM and EDX had been performed at room temperature for FeTe0.75S0.25 single crystal and the results are shown in figure 2. It is clear from the SEM image that FeTe0.75S0.25 crystallizes in layered structure, which is similar to the case of FeTe [27]. The EDX analysis is shown in insets (a) and (b) of figure2. Inset (a) shows the quantitative elemental analysis of selected area for FeTe0.75S0.25, which is found to be near to the stoichiometric ratio i.e., close to FeTe0.75S0.25. Inset view (b) depicts selected area spectral analysis of FeTe0.75S0.25, showing that all the elements of FeTe0.75S0.25 are being present without contamination of any other foreign element in the matrix.
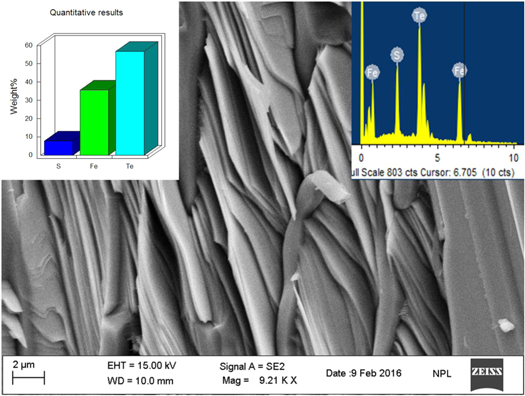
Figure 2. Selected SEM image of FeTe0.75S0.25 single crystal at room temperature. Inset view is EDX result of FeTe0.75S0.25 single crystal (a) Quantitative analysis and (b) Elemental spectral analysis.
Download figure:
Standard image High-resolution imageFigure 3 depicts the room temperature XRD pattern carried out on the surface of FeTe1-xSx (x = 0.0 to 0.25) single crystals, indicating the crystal growth of all the samples in (00l) plane only. This result confirms the evidence of single crystalline property of the as grown FeTe1-xSx (x = 0.0 to 0.25) series. Further to study the detailed structural properties, we performed the powdered XRD followed by Rietveld refinement using Fullprof software. The observed powder XRD of all the studied FeTe1-xSx crystals is shown in figure 4(a). All the samples of FeTe1-xSx (x = 0.0 to 0.25) series exhibit tetragonal structure within P4/nmm space group. Also seen were small impurities of crystalline FeTe2. The values of lattice parameters, co-ordinate positions, and volume obtained from Rietveld refinement are depicted in table 1. As the S concentration at Te site of FeTe1-xSx (x = 0.0 to 0.25) series increases, a monotonic decrease in lattice parameters (a and c) is clearly observed, which is in confirmation with our previous results on bulk polycrystalline samples of the same series [28]. The lattice parameters, a and c are seen to decrease from 3.82 Å to 3.79 Å and 6.29 Å to 6.21 Å for x = 0.00 and x = 0.25 respectively. Inset of figure 4(a) shows the zoomed part of powder XRD of crystal series from 2ϴ angle of 42° to 46°, the result clearly shows shifting of peak towards the higher angle for the [003] plane, representing decrement in the c lattice parameter with S doping.
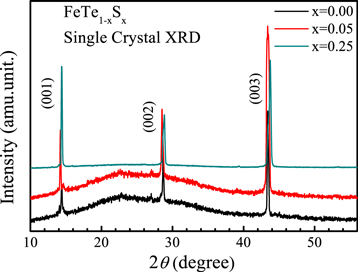
Figure 3. Single crystal XRD for FeTe1-xSx(x = 0.0 to 0.25) series at room temperature.
Download figure:
Standard image High-resolution image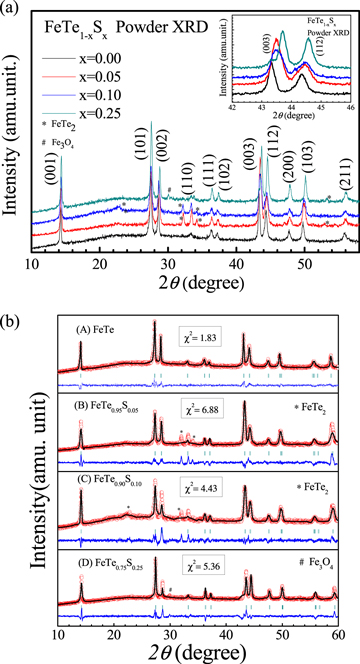
Figure 4. (a) Powder XRD patterns for crushed powders of FeTe1-xSx(x = 0.0 to 0.25) series at room temperature. Inset view is zoomed [003] plane view for the same. (b) Observed and fitted XRD of FeTe1-xSx(x = 0.0 to 0.25) series at room temperature using Rietveld refinement.
Download figure:
Standard image High-resolution imageTable 1. FeTe1-xSx (x = 0.00 to 0.25) single crystals lattice parameters and coordinate positions using Rietveld refinement.
| x = 0.00 | x = 0.05 | x = 0.10 | x = 0.25 | |
|---|---|---|---|---|
| a = b (Å) | 3.826(2) | 3.803(2) | 3.801(2) | 3.798(2) |
| c (Å) | 6.292(3) | 6.242(3) | 6.237(3) | 6.212(3) |
| V(Å3) | 92.1325(3) | 90.304(3) | 90.06(2) | 89.6405(2) |
| Fe | (3/4, 1/4, 0) | (3/4, 1/4, 0) | (3/4, 1/4, 0) | (3/4, 1/4, 0) |
| Te | (1/4, 1/4, 0.286) | (1/4, 1/4, 0.289) | (1/4, 1/4, 0.288) | (1/4, 1/4, 0.280) |
| S | — | (1/4, 1/4, 0.289) | (1/4, 1/4, 0.288) | (1/4, 1/4, 0.280) |
Figure 4(b) depicts the Rietveld refinement of FeTe1-xSx (x = 0.0 to 0.25) series at room temperature. Here χ2 represents the goodness of fitting of the observed and experimental data, which is in single digits. The values of χ2 for respective samples are shown in figure 4(b) as well. Although Rietveld refinement of FeTe is reported earlier [27], but the same is shown here as well for the sake of inter comparison with others samples. From the Rietveld refinement, we can safely conclude that the entire essential phase is identified and there is only small impurity (FeTe2) being marked by * is found in some of the crystals; particularly in x = 0.05 and 0.10. Further small impurity of Fe3O4 is found in x = 0.25 crystal, which is marked by #.
Figure 5 despites the resistivity (ρ) verses temperature (T) measurement for FeTe1-xSx (x = 0.0 to 0.25) crystals in temperature range from room temperature (300 K) down to 2 K and the ρ is normalized at 300 K i.e. ρ(T)/ρ300. Figure 5 clearly shows a semiconducting to metallic behavior for all the crystals except x = 0.25, which showed only semiconducting to superconducting transition. The x = 0.05 and x = 0.10 crystals also showed superconducting transition at low temperatures. For pure FeTe crystal without applying any external field, a coupled magnetic/structural transition appears at around 70 K and 65 K during warming and cooling cycles respectively. Warming/cooling cycle hysteresis of transition width (ΔT) of ∼5 K in temperature occurs during measurement due to the existence of latent heat throughout the cycles, which is in confirmation with our previous report [27, 29].
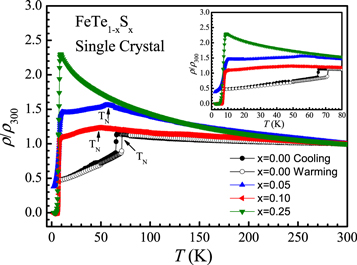
Figure 5. Normalized electrical resistivity (ρ/ρ300) versus temperatureplots for FeTe1-xSx (x = 0.0 to 0.25) series in temperature range of 2 K to 300 K. Inset view is zoomed part of same in temperature range of 2 K to 80 K.
Download figure:
Standard image High-resolution imageFor FeTe crystal, neither  nor
nor  (ρ = 0) were seen down to 2 K and rather a metallic step is seen below 70 K due to magnetic transition [27]. For x = 0.05, i.e. FeTe0.95S0.05 a semiconducting to metallic step occurs in ρ-T measurement approximately at around 55 K, followed by
  at approximately 9 K, but no
  (ρ = 0) down to 2 K. In case of x = 0.10 i.e., FeTe0.90S0.10 crystal
  is 9.5 K and
  (ρ = 0) is found to be 6.5 K along with the metallic step due to magnetic ordering at around 48 K. For x = 0.25, i.e., FeTe0.75S0.25, the normal state metallic part associated with magnetic ordering is not seen and rather a semiconducting to superconducting transition occurs at
  of around 8.5 K and
  (ρ = 0) at 4.5 K. Inset of figure 5 depicts the zoomed view of ρ-T plots, showing
 and magnetic transition of studied FeTe1-xSx (x = 0.0 to 0.25) single crystals. It is clear from the ρ(T) results that though FeTe shows only the metallic step due to reported magnetic ordering at 70 K, the x = 0.05 and 0.10 both exhibit the same but along with superconductivity onset at lower temperatures. This means in case of x = 0.05 and 0.10 both magnetic ordering and superconductivity co-exist. Interestingly, In case of the x = 0.25 the magnetic ordering associated metallic step is absent and the crystal is superconducting below 10 K.
Further to understand the superconducting response of FeTe1-xSx single crystals, ρ-T measurements under applied magnetic field have been performed for FeTe0.75S0.25 single crystal under applied magnetic field of up to 14Tesla in both direction i.e., H//ab and H//c and the results are shown in figures 6(a) and (b). The broadening of the H//c is wider in comparison to H//ab field direction, this shows that superconductivity is relatively weak in c-direction. The anisotropy of superconductivity being visible in H//ab and H//c measurements further confirm the single crystalline nature i.e., uni-directional growth of the studied material.
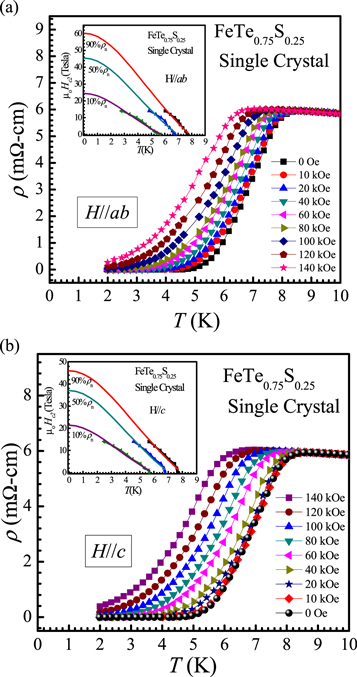
Figure 6. Temperature dependent electrical resistivity ρ(T) under various magnetic field (a) FeTe0.75S0.25 single crystal for H//ab direction. Inset view is calculated Hc2 in H//ab direction for FeTe0.75S0.25 single crystal (b) FeTe0.75S0.25 single crystal for H//c direction. Inset is Hc2 in H//c direction for FeTe0.75S0.25 single crystal.
Download figure:
Standard image High-resolution imageThe upper critical field Hc2(0) for H//ab and H//c direction is calculated for FeTe0.75S0.25 single crystal. At absolute zero temperature, Hc2(0) is determined by using Ginzburg–Landau (GL) equation i.e., Hc2(T) = Hc2(0)[(1—(T/Tc)2)/(1 + (T/Tc)2)]. Thus calculated Hc2(0) of FeTe0.75S0.25 single crystal for H//ab and H//c directions are shown in inset view of figures 6(a) and (b) respectively. Further, Hc2(0) is calculated using normal state resistivity criteria (ρn) of 10%, 50% and 90%, which is found to be around 25Tesla, 45Tesla and 60Tesla respectively for H//ab direction and 20Tesla, 35Tesla and 45Tesla for H//c direction for FeTe0.75S0.25 single crystal. The fitted solid lines imply the extrapolated curve fitting of the GL equation, i.e. Hc2(T) = Hc2(0)[(1 − t2)/(1 + t2)], here t = T/Tc is called reduced temperature and Tc is superconducting transition temperature. From fitted curve, the resultant Hc2(0) value is far exceeded from the Pauli Paramagnetic limit i.e. 1.84 times of Tc [30]. High Hc2(0) of FeTe0.75S0.25 single crystal indicates the highly pinned superconductor against the external applied magnetic field.
For determination of the coherence length ξ(0) of FeTe0.75S0.25 single crystal, we use the relation of ξ(0) and Hc2(0) as follows; Hc2(0) = φ0/2Лξ(0)2, here φ0 is flux quantum, i.e., 2.0678 × 10⁻¹⁵Tesla-m2. For FeTe0.75S0.25 single crystal, at absolute zero temperature, the calculated coherence length ξ(0) from above equation comes to be 23.4 Å and 27.05 Å for H//ab and H//c directions.
For further analysis of the ρ(T)H behaviour of the FeTe1-xSx (x = 0.0 to 0.25) series, the thermally activated flux flow (TAFF) plots, i.e., Lnρ verses 1/T at various applied fields are drawn for FeTe0.90S0.10 and FeTe0.75S0.25 single crystals and are shown in figures 7(a) and (b) respectively. Inset of figure 7(a) shows the ρ(T)H measurement of FeTe0.90S0.10 sample, which is reported earlier [26]. According to TAFF theory [31, 32], the TAFF region is described with the help of Arrhenius relation [33] i.e., Lnρ(T, H) = Lnρ0(H) - U0(H)/kBT, here Lnρ0(H) is temperature dependent constant, U0(H) activation energy and kB the Boltzmann constant. Lnρ versus 1/T graph would be linearly fitted in TAFF region for both the samples as described with the above equation. TAFF fitted plots of up to 12Tesla in case of FeTe0.90S0.10 and up to 14Tesla in case of FeTe0.75S0.25 are shown in figures 7(a) and (b) respectively. All the linearly fitted extrapolated lines with magnetic fields are intercepted at the same temperature, which coincides approximately at superconducting transition temperature (Tc) of the compound. The resistivity broadening pattern under magnetic field in both samples is quite similar to FeSe0.50Te0.50 superconductor [34] and is due to the thermally assisted flux motion [35].
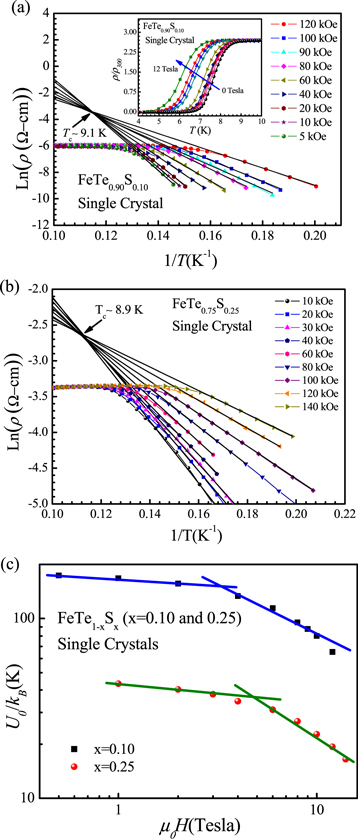
Figure 7. (a) ln ρ(T, H) versus 1/T for different magnetic fields for FeTe0.90S0.10 single crystal corresponding fitted solid line of Arrhenius relation. (b) Thermally Activation energy Uo(H) with solid lines fitting of Uo(H) ∼ H−α for different magnetic field for FeTe0.90S0.10 single crystal.
Download figure:
Standard image High-resolution imageThe thermal Activation energy [U0(H)] calculated for FeTe0.90S0.10 and FeTe0.75S0.25 single crystals for different magnetic fields is shown in figure 9(b). The thermal activation energy varies from 14 meV to 5.2 meV for magnetic field range from 0.5Tesla to 12Tesla for FeTe0.90S0.10 and 3.5 meV to 1.33 meV for magnetic field from 1Tesla to 14Tesla for FeTe0.90S0.25 single crystal. The calculated thermal activation energy is far lesser than the activation energy for FeSe0.50Te0.50 single crystal [34]. Thermal activation energy follows as power law relation i.e., U0(H) = K × H−α, here U0 is thermal activation energy, K is constant, H is magnetic field and α is called field dependent constant. For lower magnetic field i.e., up to 2Tesla, α comes around 0.07 while for higher magnetic field i.e., greater than 4Tesla, α comes around 0.63 for FeTe0.90S0.10 single crystal. While for FeTe0.75S0.25 sample, α comes 0.12 up to 3Tesla magnetic field and 0.75 for high magnetic field of above 4Tesla. This result of weak power law dependence of U0(H) shows that single vortex pinning is effective at low fields for studied FeTe0.90S0.10 and FeTe0.75S0.25 single crystals [32, 36].
In order to even further explore the superconducting properties of FeTe1-xSx, the magnetization measurements have been done down to 2 K for FeTe0.90S0.10 single crystal, which are shown in figure 8. The real (M') and imaginary (M'') parts of AC susceptibility for FeTe0.90S0.10 single crystal are taken at 10 Oe amplitude and 333 Hz frequency cooled down to 2 K in the absence of any DC magnetic field. From the figure, it is clearly seen that a sharp decrement occurs in real part of AC susceptibility below its Tc, i.e., at around 7 K, showing the diamagnetic shielding of the sample, confirming the bulk superconductivity of the sample. Further below Tc, a peak occurs in imaginary part of AC susceptibility i.e. M'', that's reflecting the flux penetration effect inside the crystal. There is also no indication of two peak behaviors, thus ruling out the granularity or polycrystalline nature of studied crystal. Inset of figure 8 shows the isothermal MH plot of the FeTe0.90S0.10 single crystal at 2 K, exhibiting a clear opening of loop at up to 1Tesla. This MH plot shows the evidence of typical type-II superconductivity in our studied FeTe0.90S0.10 single crystal.
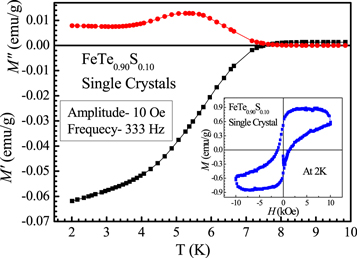
Figure 8. AC magnetic susceptibility of FeTe0.90S0.10 single crystal at 333 Hz frequency and 10 Oe amplitude from temperature range 10 K to 2 K. Inset view is MH plot of same at 2 K.
Download figure:
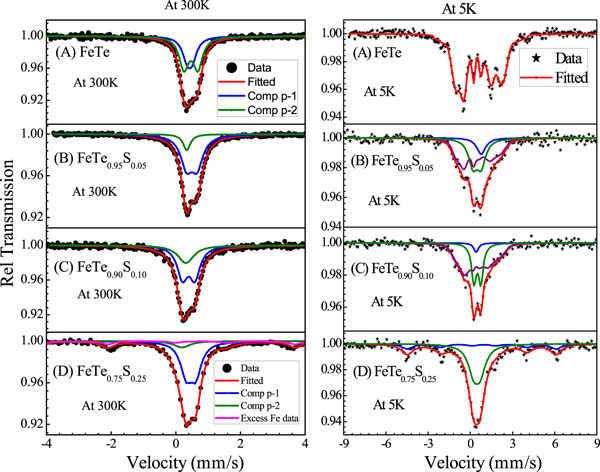
Standard image High-resolution imageThe Mossbauer spectra of FeTe1-xSx (x = 0.00 to 0.25) have been taken at 300 K (RT) and 5 K, which are shown in figure 9. The detailed Mossbauer analysis of x = 0.00, i.e. FeTe at 5 K and RT is reported elsewhere [37], and is included here for sake of inter comparison. The room temperature (RT) Mossbauer spectra of x = 0.05 and x = 0.10 samples show an asymmetric paramagnetic doublet representing the existence of two Fe sites, which is similar to FeTe Mossbauer spectra at room temperature [37, 38]. The RT data is fitted with a doublet and a singlet for x = 0.05 and x = 0.10 samples. At RT after fitting the curve, values of quadrupole splitting (QS) and isomer shift (IS) are found to be in the range of 0.40 ± 0.02 mm s−1 and 0.39 ± 0.01 mm s−1 respectively for majority doublet and IS for singlet is found to be 0.35 ± 0.03 mm s−1 for both x = 0.05 and x = 0.10 sample. The IS decreases monotonically with doping from 0.46 ± 0.01 mm s−1 for FeTe [37] to 0.35 ± 0.03 mm s−1 for FeTe0.90S0.10 sample. The fraction of the singlet is found to increase in x = 0.10 sample (∼40%) as compared to x = 0.05 (∼10%). However, for x = 0.25 sample in addition to the asymmetric doublet, a magnetically split sextet is observed with a hyperfine field of about 32.8 ± 0.1Tesla, which could be due to presence of FeOx [39]. Right frames of figure 9 show the Mossbauer spectra of all the samples measured at 5 K. For x = 0.05 and x = 0.10 samples, in addition to the asymmetric doublet distribution of hyperfine fields resulting in a broad magnetic sextet is observed. Therefore, the data is fitted with distribution of hyperfine fields and also considering the paramagnetic doublet. An average hyperfine field of about 9.4Tesla and 7.2Tesla is observed from the fitting and the fraction of magnetic sextet is observed to be about 55% and 64% for x = 0.05 and x = 0.10 samples respectively. For x = 0.25 sample, it is observed that the line width of central doublet increased at 5 K as compared to 300 K. This can be interpreted as due to the presence of small internal hyperfine fields in x = 0.25 sample at 5 K. It may be noted here that in un-doped FeTe complete magnetic splitting with hyperfine field of 10.6Tesla is seen [37], which decrease to 9.4Tesla and 7.2Tesla for x = 0.05 and x = 0.10. Therefore, with S doping in FeTe the magnetic ordering seems to be suppressed as observed from 5 K Mossbauer data.
Figure 9. Mossbauer spectra of FeTe1-xSx(x = 0.00 to 0.25) series. Left frame at 300 K (RT) and right frame at 5 K temperature.
Download figure:
Standard image High-resolution image
Conclusion
We have successfully synthesized FeTe1-xSx (x = 0.0 to 0.25) single crystals series by self flux method i.e., without any added flux. Host of structural (XRD), micro-structural (SEM), superconducting i.e., high field low temperature down to 2 K transport and magnetization along with spectroscopy (Mossbauer) studies are carried out and reported here. It is seen that FeTe1-xSx superconductors are very robust against magnetic field as their superconductivity is hardly affected by the same. Mossbauer spectroscopy results concluded that the ground state compound (FeTe) magnetic order gets disappeared and superconductivity sets in with doping of S at Te site.
Acknowledgments
Authors would like to thank their Director NPL India for his keen interest in the present work. P K Maheshwari thanks CSIR, India for research fellowship and AcSIR-NPL for PhD registration.