

Abstract
Corrosion inhibitors generated from plants and organic compounds are critical for achieving a greener environment. In this work we investigated the corrosion inhibition of pomegranate arils extract (PAE) for mild steel in 1M HCl by potentiodynamic polarization (PDP), electrochemical impedance spectroscopy (EIS), and profilometry measurements. The effects of PAE concentration (100, 200, 400 mg l–1) and temperature (298, 313, and 333 K) on the PAE inhibition efficiency were evaluated. Polarization measurements revealed that PAE was a mixed anodic-cathodic inhibitor. Corrosion inhibition efficiency was around 74% at a PAE concentration of 400 mg l–1 at 298K. However, at 333 K, the corrosion current density in the solution containing 400 mg l–1 of PAE was measured to be 1.28 mA cm−2, which was higher than that in the blank solution (0.92 mA cm−2). This increase in corrosion rate at 333 K demonstrates the negative influence of high temperatures on PAE inhibition efficiency. The PAE green inhibitor was discovered to have a physical adsorption characteristic and to obey the Langmuir adsorption isotherm.
Export citation and abstract BibTeX RIS

Original content from this work may be used under the terms of the Creative Commons Attribution 4.0 licence. Any further distribution of this work must maintain attribution to the author(s) and the title of the work, journal citation and DOI.
1. Introduction
Mild steel is one of the most common alloys for industrial functions because of its favorable mechanical properties, low cost, and availability [1, 2]. However, due to its thermodynamic instability, mild steel is strongly prone to to corrosion in acidic media, and prevention of its maximum corrosion attack in acidic environments has become the focus of many research studies in the literature [1, 2–4]. Among the various industrial corrosion control approaches to prevent or lessen the corrosion of mild steel, the application of organic, inorganic, or hybrid corrosion inhibitors is one of the most effective and economical practices [1, 2–6].
It is known that the organic inhibitors, which have been widely used in industry, contain O, N, P, and S elements and adsorb either physically or chemically on the surface of the alloy [3, 4]. However, many synthetic organic inhibitors are toxic, making them unacceptable for some applications [3, 7]. Therefore, identifying cheap, non-toxic, and green corrosion inhibitors is of increasing importance [2, 8, 9]. Some studies in the literature have reported biodegradable, eco-friendly, organic, and naturally transpiring substances as corrosion inhibitors [2, 8–13], and in some cases, they were as effective as synthetic chemicals [6, 14].
Many plant-derived chemicals are corrosion inhibitors. The inhibition efficiency of these plant-derived inhibitors is generally attributed to the attendance of phytochemicals such as tannins, polyphenols, flavonoids, phlobatannins, anthraquinones, saponins, alkaloids, and organic sugars that may interact with the metal surface by blocking the respective sites for cathodic, anodic, or both reactions [8, 14–16]. The literature includes research studies on the usage of different parts of fruits such as peach, apricot, and pomegranate as corrosion inhibitors [8, 9, 17–19]. In recent years, pomegranate fruit has been evaluated for research in many fields, including the medical and food industries, as well as for engineering applications [9, 20, 21]. The ripe part of the pomegranate contains significant amounts of sugars, acids, polysaccharides, polyphenols, vitamins, and essential resources [9]. In addition to antioxidant, antibacterial, and inhibition properties, the medicinal characteristics of pomegranate are known to derive from the anthocyanins (delphinidin, pelargonidin, and cyaniding), phenolic compounds (including hydrolyzable tannins such as punicalagin, pedunculagin, punicalin, gallagic, and ellagic acid), and organic acids in its structure [2, 9]. There have been some studies on the inhibition properties of different parts of the pomegranate (peel, arils, leaf) on various alloys [2, 9, 12, 22–29]. Since the pomegranate's leaf and peel extracts are waste materials, they have received much research attention in the context of corrosion inhibitors.
The literature on food science confirms the incorrect use of botanical terms regarding pomegranate fruit parts. Some authors believe that the pomegranate 'seed' is the whole grain, which is composed of sarcotesta, sclerotized mesotesta, tegmen, nucela, and embryo with cotyledons and constitutes the edible portion of this complex fruit called balausta [30]. The whole pomegranate seed cannot be called aril because it is exariled or without aril seed. Other authors referred to the outer pulpy coat as 'aril' and the woody part as 'seed' [31]. The common point in both definitions is that the 'seed' and 'aril' are separate things and must not be used alternatively. In this work, we focused on the outer pulpy layer, aril, as a green corrosion inhibitor which has not been investigated previously. In addition to general parameters used to study the effect of fruit-derived inhibitors on corrosion, such as concentration, we added the 'temperature effect' which revealed interesting results regarding the negative inhibition efficiency of PAE. Also, the impact of various PAE concentrations on its inhibition behavior was evaluated at different temperatures by potentiodynamic polarization, electrochemical impedance spectroscopy, and profilometry. In addition to thermodynamic calculations, adsorption isotherm models were assessed to reveal the nature of the PAE interaction with mild steel in 1M HCl.
2. Experimental
2.1. Preparation and characterization of the PAE inhibitor
Fifty grams of pomegranate arils were refluxed in 200 ml double-distilled water for 5 h. To remove any entrained solids, the refluxed medium was pressed through a filter. Afterward, the solution was vaporized to 25 ml of dark maroon residue using an evaporator, and remaining water was removed in a vacuum oven at 45 °C until a solid was obtained (4 days). A stock solution of PAE was then prepared from the collected solid residue and as milligrams of dried extract per liter of solution.
2.2. Materials preparation and electrolyte
Mild steel (UNS G10150) specimens with the chemical composition of (C: 0.15, Mn: 0.6, Cr: 0.1, Cu: 0.1 S: 0.0005, Fe: balance wt%) were cut as working electrodes and mounted in polyester resin, leaving an uncovered surface area of 1 cm2. The specimens' surface was mechanically polished using SiC abrasive papers with grit size from #180 to #1200. Then the samples were immersed in acetone, cleaned with an ultrasonic bath, washed in distilled water, followed by air-drying. These samples were kept in a desiccator until use. The corrosive media was 1M HCl with the volume of 200 ml. The concentrations of the tested PAE inhibitor were 100, 200, and 400 mg l–1. PAE inhibitor was decently soluble in the corrosive media when tested at the indicated concentrations and it was not necessary to combine it with an organic solvent prior to adding it to the solution.
The corrosive media was 1M HCl with the volume of 200 ml. The concentrations of the tested PAE inhibitor were 100, 200, and 400 mg l–1. Experiments were conducted at 298, 313, and 333 K.
2.3. Electrochemical measurements
All electrochemical tests were performed using an Autolab PGSTAT302 potentiostat, adapted with a conventional three-electrode cell with the saturated calomel electrode (SCE) as a reference and a graphite rod auxiliary electrode, based on ASTM G5 [32]. The open circuit potential (OCP) was measured for 30 min before starting Potentiodynamic polarization (PDP) measurements. The polarization measurements were performed at a scan rate of 1 mV s−1 within the range of –250 to +250 mVOCP. The linear Tafel segment of the cathodic and anodic branches was assessed based on the Tafel extrapolation method to obtain the kinetic data such as the corrosion current density and corrosion potential [33]. EIS was carried out in the frequency range of 100 kHz to 0.01 Hz using sinusoidal signals with 10 mV amplitude at OCP on the polished samples immersed in 1M HCl, alone or with 100, 200, or 400 mg lmg l–1 PAE inhibitor. NOVA impedance software equipped with EIS data modeling and graph fitting was used to analyze the results.
2.4. Surface analysis
Surface topography analysis was performed with a Profilm3D Filmetrics profilometer with a vertical resolution of about 60 nm in one direction. For surface texture mapping, samples were immersed for 2 h in either blank or 400 mg l–1 PAE-containing 1M HCl in a quiescent solution open to the air. At the end of treatment, the specimens were washed with deionized water and blow-dried using air.
3. Results and discussion
3.1. Characterization of the PAE inhibitor
Figure 1 shows the FTIR results and vibrational transmission spectrum of PAE. The broad peaks at 3390 and 1728 cm–1 indicate –OH stretching of a phenolic and carboxyl, respectively. The appearance of the peaks in the region of 1651 and 1410 cm–1 correspond to the –C=C– in the extract. The other peaks at 2935 and 1075 cm–1 are attributed to the –CH2 and C–O. Other studies in the literature have reported the presence of carboxylic acids in PAE [9, 17, 24]. The existence of absorption bands due to –OH stretching of the phenolic group and –COOH group confirm the presence of carboxylic acids. This confirms that the extract contains mixtures of compounds, which likely consist of pelletierine (an alkaloid), pelargonidin (an anthocyanidin plant pigment), and two phenolic acids (ellagic acid and gallic acid) [22].
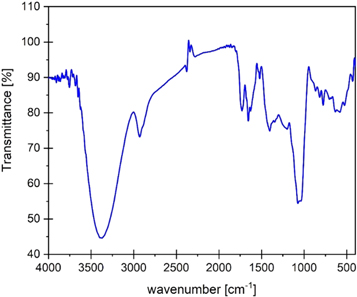
Figure 1. FTIR spectra of PAE green inhibitor.
Download figure:
Standard image High-resolution image3.2. Effect of inhibitor concentration
Figure 2 shows the PDP curves for mild steel electrodes in 1M hydrochloric acid without and with 100 to 400 mg l–1 of PAE at 298 K. The corrosion potential (Ecorr), current density (jcorr), cathodic (βc), and anodic (βa) Tafel slopes, polarization resistance (Rp) and inhibition efficiency (IE%) are tabloid in table 1. jcorr decreased in the presence of PAE, indicating that the organic constituent of the extract inhibits the corrosion of mild steel in 1M HCl. The surface coverage values (θ) were attained from equation (1) and then put into equation (2) for the calculation of inhibition efficiency (IEj%) [34]:


Where jcorr (inhibited) and jcorr (uninhibited) are the corrosion current density in the presence and absence of the inhibitor, respectively.
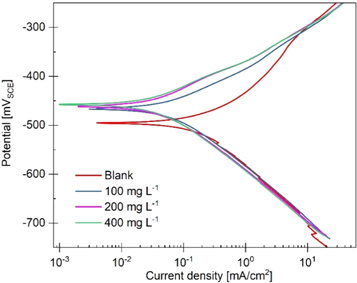
Figure 2. PDP curves for mild steel in 1M HCl at 298 K with 0, 100, 200, and 400 mg l–1 of PAE.
Download figure:
Standard image High-resolution imageTable 1. Corrosion parameters for mild steel in 1M HCl with various concentrations of PAE inhibitor at 298 K.
| CInhibitor (mg l–1) | Ecorr (V) | jcorr (mA.cm−2) | βa (V/dec) | βc (V/dec) | IEj% |
|---|---|---|---|---|---|
| Blank | –0.50 | 0.25 | 0.1 | –0.12 | — |
| 100 | –0.47 | 0.09 | 0.07 | –0.10 | 66 |
| 200 | –0.46 | 0.07 | 0.07 | –0.10 | 72 |
| 400 | –0.46 | 0.06 | 0.07 | –0.10 | 74 |
According to the PDP results, increasing the PAE concentration reduces the corrosion rate. Also, the cathodic and anodic current densities decreased with increasing inhibitor concentration, which in turn indicates a decrease in jcorr. Consequently, IEj% increases with increasing PAE concentration.
Inhibition performance directly relates to the inhibitors' coverage on the steel surface. Surface coverage increases by more adsorption of PAE molecules that can further block the active sites of the metal surface. With the blockage of active surface sites, hydrogen evolution (cathodic) and metal dissolution (anodic) reactions, which are competitive, are less likely to occur. This is due to the growth of a non-conducting layer on the sample surface that acts as a physical barrier for the access of hydrogen ions [6]. However, corrosion might still occur in regions with no inhibitor coverage, i.e., defects in the organic layer created by the inhibitor [35].
PDP curves in figure 2. indicate that increasing the PAE concentration affects both cathodic and anodic current densities, and the effect is similar for both branches. This suggests that at higher PAE concentrations, this inhibitor blocks both cathodic and anodic sites [35]. The βa decreased from 0.1 ± 0.02 V/dec for uninhibited to 0.07 ± 0.01 V/dec for inhibited solutions containing any concentrations of PAE. Likewise, adding any amount of PAE to the blank solution reduced the βc from 0.12 ± 0.01 V/dec to 0.10 ± 0.01 V/dec. The addition of PAE to the electrolyte, regardless of tested concentration, decreased βa and βc, further indicating that both cathodic hydrogen evolution and anodic dissolution reactions are inhibited [2, 3, 36]. Moreover, within all three inhibited solutions, βa and βc values are similar. As can be seen in table 1, the Tafel slopes remain unchanged by increasing the PAE concentration from 100 to 400 mg l–1, implying that the addition of more PAE inhibitor does not affect the mechanisms of cathodic and anodic reactions. Also, the cathodic Tafel lines nearly parallel, indicating that the hydrogen evolution reaction is under activation controlled and charge transfer is the leading mechanism for reducing H+ ions on the metal surface [2].
An inhibitor is identified as an anodic or cathodic type if the difference between Ecorr for the blank and inhibited solutions is more than 85 mV [3]. Herein, the maximum difference for Ecorr is approximately 39 mV, which indicates that PAE is a mixed-type inhibitor. Also, a change in both cathodic and anodic Tafel slopes with the addition of PAE to the blank solution confirms that this inhibitor can be classified as a 'mixed-type' inhibitor [3]. The influence of PAE on impedance spectra is shown in the form of bode-phase and Nyquist plots in figure 3.
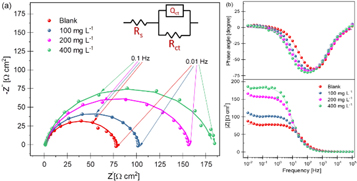
Figure 3. Nyquist (a) and bode-phase plots (b) for mild steel in 1M HCl with 0, 100, 200, and 400 mg l–1 of PAE. The equivalent circuit used to fit the experimental data is shown in (a).
Download figure:
Standard image High-resolution imageThe shape of the capacitive loops in the form of depressed semicircles indicates that charge transfer control was the predominant corrosion process, consistent with PDP results and other studies [34, 37]. Also, the addition of PAE did not change the shape of the impedance curves, implying that the addition of more inhibitors did not affect the corrosion mechanism [34]. This confirms the PDP results and the similar cathodic and anodic Tafel slopes for inhibited solutions with different PAE concentrations. However, the diameter of the semicircles increased with PAE concentration, signifying an increase in its inhibitive power. This means that the addition of PAE increases the resistance against corrosion and hinders the charge transfer process at the interface [1].
To analyze the impedance data, a physical model in the form of an equivalent circuit was proposed to fit the experimental data. The inset in figure 3(a) shows the equivalent circuit that gave the best fit to the impedance data. This circuit consists of solution resistance (Rs), polarization resistance (Rct), and a constant phase element (CPE), which is replacing the capacitor element to obtain a more accurate fit [34]. Factors such as surface roughness, frequency dispersion, relaxation, mass transport processes, and porosity in mass transfer effects could cause deviation from the ideal capacitive behavior [37, 38]. Therefore, a CPE was used to obtain a more accurate representation of the metal/solution interface.
Inhibition efficiencies from the EIS polarization resistances (IER(EIS)%) were calculated using equation (3) [39]:

Where Rp(uninhibited) and Rp(inhibited) are the EIS polarization resistances of mild steel in 1M HCl in the absence and presence of PAE, respectively. The double layer capacitance was also calculated using the following formula [15]:

Where Rs, Q, Rp, and n are the magnitude of the solution resistance, constant phase element, polarization resistance, and the deviation parameter, respectively.
Similar to PDP, EIS results showed that the inhibition efficiency is proportional to the PAE concentration. According to table 2, by increasing the PAE concentration, Rp increases, and oppositely, Cdl decreases. As more PAE is added to the solution, its molecular adsorption results in a more significant blockage of the metal surface, confirming the increase in Rp from 77.65 to 179.17 Ω cm2 for uninhibited and inhibited solution (400 mg l–1), respectively.
Table 2. EIS fitting parameters for mild steel in 1M HCl with various concentrations of PAE inhibitor at 298 K.
| CInhibitor (mg l–1) | Rs (Ω.cm2) | Rp (Ω.cm2) | Q (S. cm–2) | n | Cdl (μF.cm–2) | IER(EIS)% |
|---|---|---|---|---|---|---|
| Blank | 0.4 | 77.6 | 3.2 × 10⁻⁴ | 0.84 | 72.93 | — |
| 100 | 1 | 100.8 | 2.4 × 10⁻⁴ | 0.87 | 68.26 | 23 |
| 200 | 0.9 | 156.3 | 2.9 × 10⁻⁴ | 0.84 | 65.93 | 50 |
| 400 | 0.9 | 179.1 | 2.2 × 10⁻⁴ | 0.87 | 63.60 | 57 |
It seems that the molecular adsorption of the PAE can effectively block the charge movement across the interface by forming a protective layer that inhibits the corrosion process and provides higher protection against corrosion [1]. In fact, by increasing the PAE concentration, its molecules gradually replace the water molecules and other ions that have been absorbed initially on the surface and create a protective layer [16, 34, 37]. The formation of a protective barrier layer on the sample surface is confirmed by the decreasing trend of Cdl (from 72.93 to 63.60 μF cm−2) and the increasing trend of the inhibition efficiencies (from none to 56.66%), consistent with the results of other studies [37]. This protective layer reduces the ability of the double layer capacitance for charge transfer, thus the corrosion rate. Based on the Helmholtz model, double layer capacitance can be shown as the following [1]:

Where 'd' is the film thickness, ' ' is the surface area of the electrode,
  ' is the permittivity of the air, and
  is the local dielectric constant. According to equation (5), a decrease in Cdl could be a sign of an increase in the thickness of the formed film or a decrease in the local dielectric constant or the occurrence of both simultaneously [1, 37].
This research employed a PAE inhibitor that was decently soluble in 1M HCl. In contrast to previous research [15, 40, 41], it was not necessary to combine it with an organic solvent before adding it to the corrosive medium. This appears to be related to PAE's chemical composition. The FTIR results confirmed the presence of carboxyl groups, which have been shown to facilitate the solubility of PAE in acidic media. Inhibitors containing functional groups of OH and COOH, such as PAE, are known to be soluble corrosion inhibitors in different corrosive media. These types of inhibitors, most of which are environmentally friendly compounds, do not need to dissolve in organic solvents [41].
It is known that the solubility of the inhibitor has a direct relationship with its effectiveness, as the increase in the dipole moment enhances the physical adsorption of the inhibitor and, thus, increases the inhibition effect [42, 43]. The solubility of the protective layer that forms on the metal can also be discussed. Increasing the inhibition efficiency by increasing the concentration of PAE was a sign of a decrease in the solubility of the protective layer on the surface, hence increased corrosion inhibition [25, 44].
The trend of inhibition efficiency calculated by jcorr from PDP is consistent with those obtained from EIS, confirming the effective inhibition behavior of PAE for mild steel in 1M HCl. The difference between the inhibition efficiency values from DC and AC tests might be attributed to the different duration of measurements [16]. As a destructive electrochemical approach, PDP measurement allows for a real-time assessment of the corrosion system and the substrate-inhibitor interaction. Sweeping potentials are used to polarize the surface, changing the chemistry of the substrate-interface, as well as the physicochemical properties and composition of the test surface, from its unbiased state. Because of the PDP's destructive nature, each test should be performed with a fresh sample. EIS, on the other hand, is a nondestructive test that uses a frequency range of 100 kHz to 0.01 Hz and takes a fraction of the time that PDP does. The discrepancy in inhibitor efficiency achieved by PDP and EIS could be due to variances in the nature of the PDP and EIS methodologies, as well as differences in sample preparation and experiment time [16, 45, 46].
3.3. Corrosion surface morphology analysis
After immersion for 2 h in 1M HCl solution with or without 400 mg l–1 PAE, the samples' topography was measured by a profilometer, and the recorded 3D maps are shown in figure 4. The profilometry results yielded an average surface roughness of 1.05 and 0.34 μm for blank and inhibited solutions, respectively. According to figure 4, the addition of PAE to the solution decreased the surface roughness, indicating a lower uniform corrosion for mild steel in the presence of PAE. This confirms the positive effect of PAE on inhibiting the corrosion of mild steel in 1M HCl. Furthermore, it is known that the deviation parameter of the CPE, n, is inversely related to the surface roughness [47]. According to table 2, the surface roughness measurements are aligned with the EIS results as the 'n' values increased from 0.84 to 0.87 between the blank and 400 mg l–1 PAE solutions.
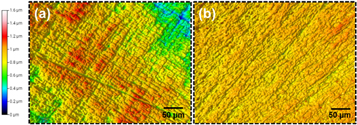
Figure 4. Surface topography maps of mild steel (a) without and (b) with the presence of 400 mg l–1 of PAE in 1M HCl at 298 K.
Download figure:
Standard image High-resolution image3.4. Effect of temperature
With the aim of analysis the effect of temperature on the inhibition behavior of PAE, the optimum concentration of 400 mg l–1 was chosen, and PDP and EIS were performed at temperatures of 298, 313, and 333 K.
Polarization curves for uninhibited and inhibited solutions are shown in figure 5, and the extracted kinetic parameters are tabulated in table 3. According to the PDP results, increasing the temperature from 298 to 313 K decreased the inhibition efficiencies from 70.09% to 52.13%. This might be caused by the degradation of the PAE structure or a reduction in the strength of the adsorption process [2, 34, 48]. Also, it might be a sign of the physical nature of the PAE adsorption process. When the inhibitor molecules are physically adsorbed on the sample surface, a rise in temperature may cause part of the physically adsorbed PAE molecules to desorb, resulting in reduced inhibition efficiency [34, 49, 50]. Further increase in temperature to 333 K rapidly reduced the efficiency to a negative value. Negative inhibition efficiency has also been observed for other inhibitors at high temperatures, e.g., Combretum bracteosum [49], magnesium aluminum polyphosphate [51], Glutmatic acid [52], and Oxyanion Esters of Α-Hydroxy Acids [53]. A negative inhibition efficiency could be caused by the deterioration of inhibitor molecules at high temperatures and formation of adsorbed intermediates that are less protective [42, 49, 54, 55]. As a result, the corrosion process is catalyzed. The potential mechanism for the catalyzed corrosion process at high temperatures can be found at the end of this section. PDP results show that the PAE inhibitor does not function effectively at higher temperatures, and its behavior is highly temperature dependent. Among the various experiments performed in this study, PAE was most inhibitive at 25 °C (298 K) and 400 mg l–1.
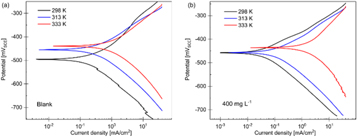
Figure 5. PDP curves for mild steel in 1M HCl without (a) and with (b) 400 mg l–1 of PAE at 298, 313, and 333 K.
Download figure:
Standard image High-resolution imageTable 3. Corrosion parameters for mild steel in 1M HCl blank and with 400 mg l–1 at 298, 313, and 333 K.
| Temperature (K) | CInhibitor (mg l–1) | Ecorr (V) | jcorr (mA.cm−2) | βa (V/dec) | βc (V/dec) | IEj% |
|---|---|---|---|---|---|---|
| 298 | Blank | –0.50 | 0.25 | 0.1 | –0.12 | |
| 400 | –0.46 | 0.06 | 0.07 | –0.1 | 74 | |
| 313 | Blank | –0.45 | 0.37 | 0.09 | –0.10 | |
| 400 | –0.45 | 0.18 | 0.08 | –0.11 | 52 | |
| 333 | Blank | –0.44 | 0.92 | 0.09 | –0.10 | |
| 400 | –0.43 | 1.29 | 0.10 | –0.10 | –38 |
Figures 6(a) and (b) show the Nyquist and bode-phase plots for mild steel in 1M HCl at temperatures of 298, 313, and 333 K with 400 mg l–1 of PAE. Nyquist plots at 298 and 313 K are comprised of a depressed semicircle, indicating the capacitive loop attributed to charge transfer. The diameter of the semicircles decreased with increasing temperature, confirming the temperature had a negative effect on the corrosion inhibition performance. Only one peak is observed in the bode spectra of PAE at 298 and 313 K, confirming the presence of one time constant [56]. At 333 K, the shape of the Nyquist curve changes, and two peaks appear in the bode-phase spectra, implying different inhibitive behavior at this temperature. The Nyquist plot for the sample at 333 K has a depressed semicircle at high frequencies and a second time constant at low frequencies. The first time constant is attributed to the corrosion processes and charge transfer resistance at high frequencies. However, the second one at low frequencies may refer to the relaxation of the adsorption layer, inhibitor film, and adsorption of the inhibitor molecules on the sample surface [56–58]. The alterations in the shape and size of the Nyquist plots have been observed in the literature for many reasons, such as the addition of inhibitor, higher surface exposure of an inhibitor with increasing immersion time, and changes in temperature [56, 58–61]. The change in the PAE inhibition behaviour at elevated temperatures was expected as the PDP results also showed the distinctive behavior of PAE at 333 K.
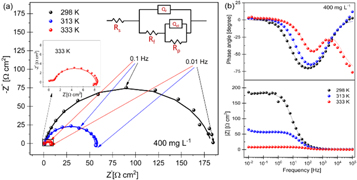
Figure 6. Nyquist (a) and bode-phase plots (b) for mild steel in 1M HCl with 400 mg l–1 of PAE at 298, 313, and 333 (inset) K. The equivalent circuit that was used to fit the experimental data is shown in (a).
Download figure:
Standard image High-resolution imageThe equivalent electrochemical circuit with one time constant (figure 3(a)) was used for 298 and 313 K. Due to the different behavior of PAE at 333 K, an equivalent circuit with two-time constants was used to fit the EIS data (figure 6(a)). The elements in this model consist of Rs, constant phase element of the inhibitor film (Qf), film resistance (Rf), CPE of the double-layer (Qdl), and polarization resistance (Rp). The double layer capacitance was calculated using equation (4) for all temperatures. All numerical data obtained from the EIS fitting analysis at various temperatures are summarized in table 4.
Table 4. EIS fitting parameters for mild steel in 1M HCl with 400 mg l–1 of PAE at 298, 313, and 333 K.
| Temperature (K) | Rs (Ω.cm2) | Rp (Ω.cm2) | Qdl (S.cm–2) | n1 | Cdl (μF.cm–2) | Qf (S.cm–2) | n2 | Rf (Ω.cm2) |
|---|---|---|---|---|---|---|---|---|
| 298 | 0.9 | 179.1 | 2.2 × 10⁻⁴ | 0.87 | 63.60 | — | — | — |
| 313 | 0.8 | 57.6 | 3.3 × 10⁻⁴ | 0.86 | 93.6 | — | — | — |
| 333 | 0.8 | 7.1 | 4.6 × 10⁻⁴ | 0.93 | 191.8 | 8.6 × 10⁻⁵ | 0.83 | 1.1 |
According to table 4, by increasing the temperature of the solution containing 400 mg l–1 of PAE from 298 to 333 K, Rp decreased from 179.2 to 7.1 Ω cm2. A decrease in the diameters of the Nyquist curves with increasing temperature also shows the reduction in polarization resistance. Since polarization resistance refers to a barrier against charge transfer for the corrosion process, a decrease in Rp might be an indication of the inhibition loss, an increase in the rate of the corrosion process, or most probably partial desorption of the inhibitor [58]. The trend of polarization resistances obtained by PDP are consistent with those obtained by EIS, confirming the validity of the experiments. However, as discussed above, a slight difference between the results might be caused by a difference in the duration of the experiments [16]. The Cdl values increased from 63.61 μF cm–2 (for 298 K) to 191.85 μF cm–2 (for 333 K), implying an increase in the capacitance of the double layer. This may be explained by the reduced density of the double layer, which embeds the adsorbed inhibitor film at elevated temperatures [58]. Increased capacitance will facilitate the charge transfer process; hence, the corrosion reaction accelerates at higher temperatures. This results in a significant decrease in the inhibition efficiency.
The negative inhibition efficiency of PAE at 333 K seems to be caused by the formation of the adsorbed intermediates that are less protective and can catalyze the corrosion process [50, 54, 55, 62]. This could be explained by the known mechanism for the inhibition process of mild steel in acidic media (η represents the inhibitor molecules) [62]:


As discussed previously, the PAE molecules replace the water molecules and other ions that have been absorbed initially on the surface [16, 34, 37]. However, the inhibitor species may (6–3) or may not (6–2) combine with the newly generated Fe2+ ions on the mild steel surface to displace the water molecules and form adsorbed intermediate  If the water molecules were displaced by the inhibitor molecules on the surface of the metal (7–3), the adsorbed intermediate
  would form. With the formation of more
  the available
  is decreased, and the rate determining step is less likely to occur. Therefore, depending on the relative solubility of
  further metal dissolution could either be inhibited or catalyzed [49, 63]. The inhibition mechanism of PAE at high temperatures seems to follow the latter. At high temperatures, the intermediate species of PAE and metal ions will increase the corrosion rate of the mild steel. This could be due to the synergistic effects of the different adsorbed intermediates on the metal surface. Plant extracts, e.g., pomegranate arils herein, contain various chemical compounds which may form adsorbed organo-metallic complexes to disrupt the inhibition of the mild steel in acidic media at high temperatures. Due to the presence of many chemical compounds in pomegranate aril extracts, determining the exact combination that may cause the negative inhibition efficiency is quite challenging [49, 64].
In summary, PAE's inhibitive performance is highly temperature dependent. However, the best performance of PAE was observed at 298 K with a concentration of 400 mg l–1, suggesting that room temperature is the optimum condition at which PAE functions perfectly. According to recent review papers [14, 65], the highest inhibition efficiency for green plant extracts has ranged from ≈60% to as high as ≈98%, with the majority of them having an efficiency of over 75%. As a comparison with other fruits, while the highest inhibition efficiency of the tested inhibitor in this study, PAE, was 74%, it was 90% for red apple [66], 82% for beet [67], 87% for myristica fragrans [68], and 62% for cassia italica [69]. The difference between inhibition efficiencies for different plant-derived inhibitors may have been caused by the difference in preparation method, testing procedure, age of the plant, chemical compounds, and geographical conditions [14, 65]. Each of these factors, either individually or through a synergistic mechanism, could significantly affect the inhibition properties of the green inhibitor.
Different parts of plants such as root, fruit, wooden parts (stem, bark), leaf, waste, and flower have been widely evaluated as green corrosion inhibitors with different inhibition efficiencies [9, 14, 17, 24, 25, 65]. It has been shown that each of these parts of a plant contains different phytochemical constituents, hence a diverse inhibition profile [14, 65]. According to the published studies on the corrosion control of mild steel in 1M HCl, there is a variation between the highest inhibition efficiency of the different parts of the pomegranate fruit [9, 17, 24, 25]. For example, the pomegranate arils tested herein had a maximum inhibition efficiency of 74%, compared to 83.3% for pomegranate seeds [25], 94% for leaves [17], 95% [24] and 99% [9] for peels. This variation in inhibition performance of different parts of the pomegranate fruit may have been caused by the difference in inhibitor extraction, experimental method, type and content of phytochemicals [9, 14, 17, 24, 25, 65].
3.5. Thermodynamic calculation
3.5.1. Activation parameters (activation energy, enthalpy, and entropy)
Analysis of the activation energy (Ea) provides valuable information on the adsorption mechanism of the PAE inhibitor. To calculate Ea, the Arrhenius equation was used as follows [34]:

Where 'A' is the Arrhenius pre-exponential factor, 'T' is the absolute temperature, 'R' is the universal gas constant and 'Ea' is the activation energy for the corrosion process.
The obtained Ea values are tabulated in table 5. The linear regression coefficient (R2) is about 0.99, suggesting that the kinetic model is valid for studying mild steel corrosion in 1M HCl. According to table 5, Ea for the blank solution (34.24 KJ. mol−1) is lower than that for inhibited solution (70.74 KJ. mol−1) containing 400 mg l–1 of PAE.
Table 5. Activation parameters of mild steel in blank and inhibited 1M HCl.
| Solution | Ea (KJ mol–1) |
 (KJ mol–1) (KJ mol–1) |
 (J mol–1 K–1) (J mol–1 K–1) |
|---|---|---|---|
| Blank | 34.2 | 31.6 | –209.2 |
| 400 | 70.7 | 68.1 | –97.5 |
As can be seen in figure 7(a), the slope of the Arrhenius curve for the inhibited condition with 400 mg l−1 is higher than that for the blank solution, signifying that the addition of the PAE inhibitor increases the activation energy [34, 70, 71]. One possible reason for the increase in activation energy with added PAE could be the physical adsorption of the inhibitor. Moreover, an increase in the activation energy could be due to significant desorption of the PAE at higher temperatures. After introducing the PAE inhibitor into the blank HCl solution, two competing reactions can occur: (a) adsorption and (b) desorption of the inhibitor. The results of electrochemical tests and thermodynamic calculations herein reveal that by increasing the temperature desorption of the PAE molecules becomes the predominant reaction. As a result, the normal function of the inhibitor, which is protecting the alloy and decreasing the corrosion rate, will be disrupted by exposing a larger surface area of mild steel to aggressive HCl solution and less protective adsorbed intermediates formed at the high temperature, thus increasing the corrosion rate [34, 50, 54, 55, 62]. The thermodynamic calculations are consistent with the results of PDP and EIS.
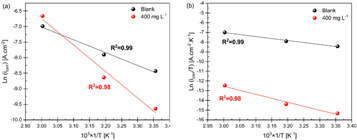
Figure 7. Arrhenius plots of (a) Ln (icorr) and (b) Ln (icorr/T) versus 103.T–1 for mild steel in 1M HCl blank and with 400 mg l–1 of PAE.
Download figure:
Standard image High-resolution imageLikewise, a reduction in the inhibition efficiencies at increasing temperatures along with an increase in Ea for inhibited solutions indicate the physisorption mechanism of PAE molecules on the mild steel surface [2, 6, 8]. Moreover, it is known that an Ea in the range of 40–80 KJ.mol–1 can be interpreted as the physical adsorption mechanism (physisorption) for the PAE inhibitor [6, 72], consistent with the results of other experiments in this study.
To calculate other thermodynamic activation parameters, an another formulation of the Arrhenius equation was utilized [34]:

Where 'h' is the Planck's constant, 'N' is the Avogadro's number, ' ' is the entropy of activation and '
 ' is the enthalpy of activation. The plot of
  versus
  is shown in figure 7(b). The slope of the straight line in figure 7(b) is
  and the intercept is
Table 5 includes the enthalpy and entropy of activation values. The positive signs for  indicate the endothermic nature of the dissolution of mild steel [2, 6, 48]. Also, according to table 5, both
  and Ea are reasonably close and are higher in the solution containing inhibitor (400 mg l–1). This implies that the corrosion process's energy barrier was increased in the inhibited solution without changing the dissolution mechanism, confirmed by PDP and EIS [2]. A more considerable energy barrier for the corrosion process in the presence of inhibitor is attributed to the physical adsorption (ionic) or weak chemical bonding (molecular) between the steel surface and inhibitor species [48]. It can also be seen from table 5 that for both blank and inhibited solutions the Ea values are larger than
  This indicates that a gaseous reaction has been involved in the corrosion process, which is probably the hydrogen evolution reaction [2, 59].
The negative and large  values in both uninhibited (–209.28 J mol–1 K–1) and inhibited (–97.54 J mol–1 K–1) solutions indicate that during the adsorption process, the disorder decreases on moving from reactants to the activated complex, i.e., formation of the adsorbed intermediate
  Therefore, shifting
  towards more positive values by adding PAE signifies that the solvent entropy or randomness increased from reactants to activated complex [3, 6, 48]. Recalling the inhibition mechanism of mild steel in acidic media (reactions (7–1 to 7–7)), the higher
  values for inhibited solutions with 400 mg l–1 of PAE might be a result of the adsorption of the organic PAE molecules (7–3) by substituting the water molecules on the surface [48, 73].
3.5.2. Adsorption isotherm
The inhibition mechanism of the inhibitor on the metal surface can be determined by the relationship between the concentration of the inhibitor (Cinhibitor) and the surface coverage, θ [34]. This relationship can be studied via different relationships, namely the Langmuir, Temkin, and Frumkin isotherms, as shown by the following equations [16, 34, 74]:


Where 'θ' is the surface coverage, 'Kads' is the adsorption-desorption equilibrium constant, 'Cinhibitor' is the inhibitor concentration and  is the lateral interaction term relating the interactions of molecules in the adsorption layer and heterogeneity of the surface [34]. The 'Kads' could also be described as the strength of the adsorption forces between the inhibitor molecules and sample surface [48].
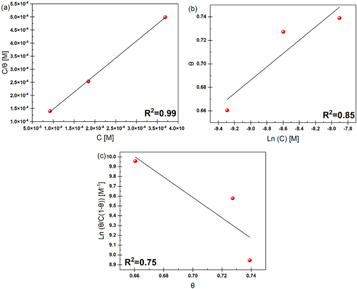
The Langmuir, Temkin, and Frumkin isotherms were tested on the surface coverage data to find the best adsorption isotherm for PAE. Figures 8(a)–(c) shows the results of each adsorption isotherm. The R2 values for Langmuir, Temkin, and Frumkin adsorption isotherms were 0.99, 0.85, and 0.75, respectively. The adsorption behavior of PAE on mild steel in 1M HCl is closest to a Langmuir-type isotherm. Based on the Langmuir adsorption isotherm, all adsorption sites are equivalent, and the binding of particles occurs independently from nearby locations [3, 34].
Figure 8. (a) Langmuir, (b) Temkin, and (c) Frumkin adsorption models for mild steel in 1 M HCl with PAE inhibitor.
Download figure:
Standard image High-resolution image
To further investigate the adsorption isotherm, the free energy of adsorption was calculated by the following equation [16]:

Where 'R' is the universal gas constant, 'T' is the absolute thermodynamic temperature, and 55.5 is the water concentration in solution (mol l–1). The obtained  for PAE in the concentration that provided the highest inhibition efficiency, i.e., 400 mg l–1, is –31.7 KJ mol–1. The negative sign denotes that the adsorption process of PAE on the sample surface occurs spontaneously [72]. The
  on the order of –20 KJ mol–1 is related to the electrostatic interaction between the charged inhibitor molecules and the sample, known as a physisorption mechanism. However, those more negative than –40 KJ mol–1 refer to the charge sharing or charge transfer from an organic species to the metal surface to form a coordinate type of bond, which is called 'chemisorption' [2, 48]. The
  less negative than –40 KJ mol–1 is commonly associated with the physical adsorption of the inhibitor, confirmed by several studies in the literature [41, 56, 75]. Therefore, based on the calculated
  of –31.7 KJ mol–1, the adsorption of PAE seem to be physical, involving electrostatic interaction between the charged inhibitor molecules and the charged mild steel surface. This finding was previously confirmed by the activation parameter, and the negative temperature effect on the inhibition efficiency of PAE.
4. Conclusions
The inhibition behavior of PAE, a green corrosion inhibitor, was evaluated for mild steel in 1M HCl using electrochemical, thermodynamic analysis, and surface chracterization. Whereas the PAE concentration indicated a proportional relationship with its inhibition efficiency, temperature behaved oppositely, where an increase in temperature decreased the inhibition efficiencies. The findings of this study are summarized as follows:
- 400 mg l–1 of PAE gave the highest inhibition efficiency (IEj% = 74).
- Electrochemical measurements at three different temperatures of 298, 313, and 333 K revealed the negative effect of temperature on the PAE inhibition efficiency. It was found that increasing the temperature from 298 to 333 K with 400 mg l–1 of PAE accelerates the corrosion current density from 0.06 to 1.28 mA cm–2, leading to a negative inhibition efficiency.
- The negative effect of temperature on the inhibition efficiency of PAE limits its use as a suitable inhibitor for mild steel in chloride media at high temperatures (333 K).
- Thermodynamic calculations indicate that the inhibition mechanism of PAE is through physical adsorption on the metal surface and follows the Langmuir isotherm model.
Data availability statement
The data that support the findings of this study are available upon reasonable request from the authors.