

Abstract
Cadmium telluride (CdTe) quantum dots (QDs) were prepared via a hydrothermal method, using 3-mercaptopropionic acid (3-MPA) as the stabilizing agent. With the help of absorption and emission spectra, it was found that prolonging the reaction time and raising the reaction temperature can increase the size of the QDs obtained, and hence induce a red shift of fluorescence emission. Rhodamine 6G was used as the reference to calculate the quantum yield (QY), and this showed that the use of extra Cd ions will distinctly increase the QY of CdTe.
Export citation and abstract BibTeX RIS
1. Introduction
Semiconductor nanocrystals, generally called quantum dots (QDs), show significant potential for use in various applications, including light emitting diodes (LEDs) (Wang et al 2011, Qiao 2012), solar cells (Chang and Lee 2007), fluorescence imaging (Larson et al 2003, Nurunnabi et al 2010) and so on. The invention and development of fluorescence microscopy and fluorescent sensors have provided excellent tools to aid the understanding of the dynamics of intracellular networks, signal transduction and cell–cell interaction, as a result of the improved resolution, sensitivity, and versatility they offer (Denk et al 1990, Schermelleh et al 2010, Dodani et al 2011). However, there are two problems associated with fluorescence microscopy; the long operation times and the inconvenient signal-to-noise ratio caused by the autofluorescence of physiological tissues in the visible spectrum (Hobbie et al 1977, Okabe et al 2012). Therefore new probes were required which emitted in the near-infrared (NIR) region (wavelength λ > 700 nm) and were more photostable than current organic fluorophores. The size-dependent emission and outstanding photostability of QDs can just meet the requirements (Kim et al 2004, Sugimoto et al 2014).
Cadmium telluride (CdTe) is an important semiconductor material due to its large exciton Bohr radius (7.3 nm) and narrow bulk band gap of 1.475 eV (Lunz et al 2011, Amelia et al 2012, Panthani et al 2014). Generally, CdTe QDs were prepared via an organometallic method (Nair and Thomas 2010, Mntungwa et al 2012, Yaacobi-Gross et al 2012, Algieri et al 2015), where the prepared QDs were usually capped by hydrophobic ligands, preventing the obtained QDs from being directly used in bio-applications. Another method is the aqueous synthesis method, which allows us to obtain CdTe QDs with excellent water solubility, biological compatibility and colloid stability (Lesnyak et al 2010, Choi et al 2012, Raju et al 2014). It has been reported that colloidal CdTe quantum wires (diameter of 5–11 nm) were grown by the solution-liquid-solid (SLS) method, using Bi nanoparticle catalysts, cadmium octadecylphosphonate and trioctylphosphine telluride as precursors, in trioctylphosphine oxide (TOPO) solvent (Sun et al 2008). Lin and coworkers reported that 3-mercaptopropyl acid (3-MPA) stabilized CdTe QDs were synthesized in aqueous solution, and can be effectively bound to papain, a biomacromolecule, through electrostatic interactions (Lin et al 2003).
In aqueous synthesis of CdTe QDs, sodium hydrogen telluride (NaHTe) has been universally utilized as the tellurium precursor. However, NaHTe is an unstable and very expensive compound, so in our work disodium tellurite (Na2TeO3) is used to replace NaHTe. CdTe QDs have been prepared by a hydrothermal method, using CdCl2 and Na2TeO3 as the Cd source and the Te source, respectively, NaBH4 as the reducing agent to reduce tellurium in Na2TeO3 from +4 to −2 value, and sodium citrate Na3C6H5O7 and 3-mercaptopropionic acid (3-MPA) as the surfactant agent. The dependences of the fluorescence emission on the CdTe size and synthesis parameters were studied in detail.
2. Materials and methods
2.1. Materials
Cadmium chloride (CdCl2), sodium telluride (NaTeO3), sodium citrate, 3-mercaptopropionic acid (3-MPA) and sodium borohydride (NaBH4) were purchased from Sigma Chemical (Bornem, Belgium). All other reagents and solvents were purchased from Aldrich Chemical (Bornem, Belgium) at the highest grade commercially available.
2.2. Methods
The CdTe QDs were obtained through the following reaction:

In detail, x mL of 0.2 M CdCl2 (x = 0.25, 0.5, 0.75, 1 mL to get Cd:Te = 2, 4, 6 and 8 respectively) was diluted into 20 mL with H2O, then 50 μg of sodium citrate, 61 μL of 3-MPA, 0.25 mL of 0.1 M Na2TeO3 and 31.25 μg of NaBH4 were added successively under magnetic stirring. This mixture was poured into a Teflon coated bottle and heated in an autoclave at 140 °C for 1 h (Adschiri et al 1992, Horváth et al 2007). The obtained solution was subsequently loaded into the dialysis tubing for purification. The sample solution in the dialysis membrane was collected and kept in darkness for subsequent characterizations.
2.3. Instruments
The hydrodynamic size and surface potential of all nanoparticles were measured on a Zetasizer Nano Series Zen 3600 (Malvern, Worcestershire, United Kingdom), where 1 mL of the sample solution of about 2 mM was put in the cell, and measured at 37 °C.
The TEM (transmission electron microscope) images were obtained on a JEM-2100 (JEOL, Tokyo, Japan), operated at 80 kV. Samples were prepared by dropping CdTe colloid on ultrathin (3 nm) carbon films (figure S5 in the supporting information).
The excitation/emission spectra were obtained using an LS-55 spectrofluorometer (Perkin-Elmer, Waltham, USA). The absorption spectra were obtained on a Lambda 35 UV/Vis system (Perkin-Elmer, Waltham, USA). The stability of the CdTe QDs have been confirmed under the excitation light source over 30 h (figure S6 in the supporting information).
3. Results and discussion
3.1. Determination of the concentration of Cd and Te in CdTe QDs
Since it was almost impossible to distinguish the signals of Cd from those of Te using the inductively coupled plasma (ICP) technique, a new method, combining the absorption spectrum and the emission spectrum, was employed to determine the accurate concentrations of Cd and Te in the obtained CdTe QDs. Both Cd2+ and Te4+ ions can react with Rhodamine B (denoted as RhoB) to form (RhoB)4[TeI8] and (RhoB)4[CdI6] (denoted as Te-RhoB and Cd-RhoB), respectively, with an absorption peak at 580 nm but with different absorption factors (Rao and Ramakrishna 1982, Kim et al 2012, Talio et al 2012). Therefore, an equation set was created by fitting the absorption intensity and emission intensity of Cd-RhoB/Te-RhoB solution, to determine the concentrations for each component (see supporting information).
The absorptions at 580 nm measured by UV–vis was described by the following equations


where the concentrations are expressed in 10−6 M.
By combining equations (1) and (2), the absorption of a mixture of Cd and Te (A) was confirmed to obey to equation (3):

To solve this equation, another set of data is needed. Therefore, corresponding Te and Cd standard curves for fluorescence were measured. The Cd-RhoB and Te-RhoB complexes formed are non-fluorescent, so the decreased RhoB concentration, caused by the presence of Cd or Te, showed weaker fluorescence, compared to the untreated Rhodamine B. The equations found for Cd complexes and Te complexes are as follows:


where IntCd and IntTe are the fluorescence integral intensities of the Cd-RhoB complex and Te-RhoB complex, respectively. So, the intensity for a mixture of Te complex and Cd complex is expected to be:

Combining equations (3) and (6) allows us to obtain the Cd2+ and Te4+ concentrations (see supporting information).
3.2. Dependence of emission on QDs concentration
The size effect of QDs is well known: the wavelength of the fluorescence emission shows red shift as the diameters of QDs increase (Liu et al 2010, Luther et al 2011, Mocatta et al 2011). However, the influence of the QDs' concentration on the emission has been rarely reported. Chin et al described an in vitro study of InP/ZnS dual-emissive QDs for multispectral intraoperative fluorescence imaging, where the clinical radioscintigraphy results showed a concentration-dependent emission shift and emission intensity change (Chin et al 2010). Here the influence of the QDs' concentration on the emission wavelength and the emission intensity is studied.
The absorption spectra of CdTe QDs (diameter D = 7 nm) with different concentrations are shown in figure 1. As the concentration of CdTe QDs increases, the absorption intensity shows a corresponding increasing trend, but keeps the max absorption wavelength fixed at 590.3 nm. This phenomenon was reported in the work of Yu and coworkers (Yu et al 2003) who explained that the diameter was the only factor relevant for the wavelength of the first absorption peak of QDs, and an empirical formula was described to get the value of the QD diameter by fitting.
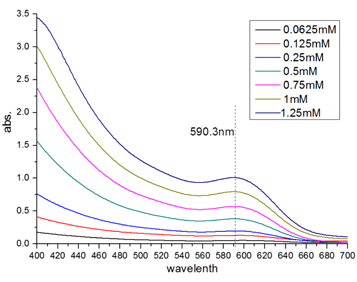
Figure 1. Absorption spectra of CdTe QDs at different concentrations (diameter of CdTe D = 7 nm).
Download figure:
Standard image High-resolution imageTo study the influence of CdTe QD concentration on the fluorescence emission, the above CdTe samples with different concentrations were characterized by the emission spectra, as shown in figure 2. It was found that as the CdTe concentration increases from 0.0625 to 1.25 mM, the emission of CdTe QDs shows a linear red shift from 622 to 646 nm (λex = 350 nm), from 622 to 640 nm (λex = 500 nm) and from 615 to 633 nm (λex = 590 nm). After fitting, experimental equations for the wavelength curves with λex = 350, 500 and 590 nm are given by equations (7), (8), and (9), respectively:


where λ350, λ500 and λ590 are the max fluorescence wavelengths for the CdTe QDs excited at 350, 500 and 590 nm, respectively. This phenomenon matched the in vivo experiments reported by Chin et al (Chin et al 2010). When the QD concentration increases, there is more self-absorbance and as a result, the shorter-wavelength fluorescence emitted from smaller QDs will be absorbed by bigger QDs, inducing a red shift of the emission wavelength.
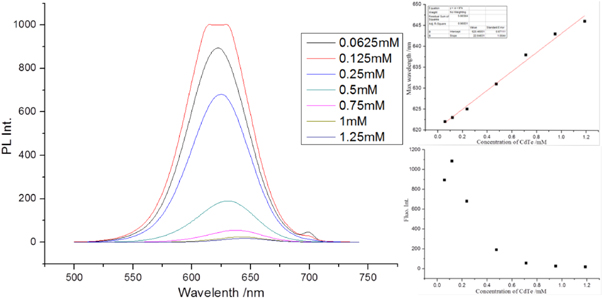
Figure 2. Emission spectra of the CdTe QDs (D = 7 nm) colloid at different concentrations (λex = 350 nm). On the right hand side, the wavelength for max fluorescence intensity as a function of the CdTe concentration (up), and change of fluorescence intensity with increasing the CdTe concentration (down). Spectra with λex = 500 nm and λex = 590 nm are shown in the supporting information.
Download figure:
Standard image High-resolution imageHowever, the emission intensity also shows concentration dependence. When excited at 350 nm, the fluorescence intensity presents a reciprocal function decrease. However, when excited at 500 and 590 nm, the change of fluorescence intensities are like a parabola. After an increase at low concentrations, a decrease is observed, with max intensities at ∼0.3 mM for both curves (see figures S3 and S4 in the supporting information). At low concentration range, the self-absorbance effect was not prominent as the QDs colloid was too diluted, so the fluorescence intensity increased when the concentration increased. When the QD concentration exceeds a critical value (∼0.3 mM in this work), the self-absorbance (called self-quenching) effect plays a dominant role, where radiationless energy transfer occurs between CdTe nanoparticles or some aggregates formed. In addition, the change in fluorescence intensity is not the same for different QDs with different excitation wavelengths. This phenomenon was not reported before, and will be studied in future research.
3.3. Fluorescence of CdTe QDs and synthesis parameters
The quantum-size effect of QDs had been widely studied (Padilha et al 2011, Zhitomirsky et al 2012, Verma et al 2014) and the change in emission wavelengths as a function of the QDs' diameter was normally explained by the relationship between the band gap and surface vacancies (Dohnalová et al 2013). Here the emission of obtained CdTe QDs has been studied as the synthesis parameters changed, including reaction temperature T, heating time t and the initial concentration ratio between Cd and Te.
The effect of the initial concentration ratio between Cd and Te on the fluorescence of CdTe QDs was shown in figure 3. It was found that as the Cd/Te ratio increased from 2:1 to 8:1, the fluorescence emission wavelengths did not show obvious change, but a large increase in the intensity was observed (figures 3(a)–(c)). The diameters of CdTe QDs measured by PCS showed that the CdTe QDs increased slightly from 4.89 to 5.78 nm as the Cd/Te ratio increased from 2:1 to 8:1. It can be assumed that the excess Cd2+ ions, together with 3-MPA, will complex on the surface of CdTe QDs, but not on CdO or Cd(OH)2 (Karayigitoglu et al 1994, Zhang et al 2013), so the diameters of the obtained CdTe QDs slightly change as the Cd/Te increases. The increase in fluorescence intensity with larger Cd/Te initial concentration ratio is assumed to be due to the formation of a layer of cadmium-thiol complexes on the surface of the CdTe core. Such complexes can be considered a wide-band-gap material and also have a higher potential for the ground-state electron, which results in the increase in fluorescence intensity.
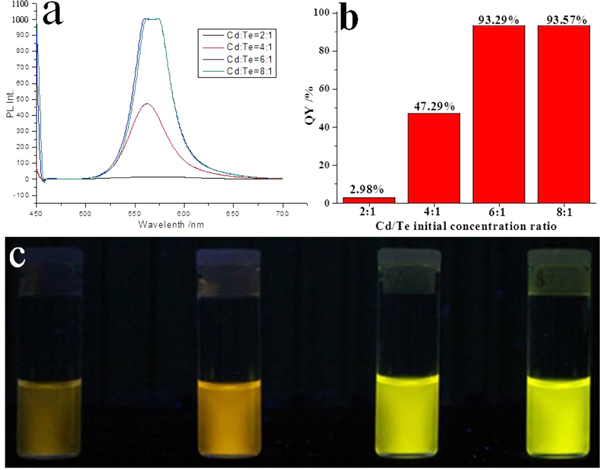
Figure 3. Optical properties of CdTe QDs with different Cd/Te initial concentration ratios. The synthesis parameters for the QDs colloid were T = 140 °C and t = 1 h. (a) The emission spectra for the four samples, where the excitation wavelength λex = 450 nm; (b) the QY value of each sample; (c) pictures of four CdTe QDs colloids under UV lamp (λex = 366 nm) and the Cd/Te ratios for samples from left to right were 2:1, 4:1, 6:1 and 8:1.
Download figure:
Standard image High-resolution imageThe effect of heating time t on the optical properties is shown in figure 4. When the reactants were heated for 0.5, 1, 1.5 and 2 h, the obtained CdTe QDs had PCS diameters of 4.84, 5.50, 6.65 and 7.68 nm, respectively. As shown in the absorption spectra (figure 4(a)), the absorption peak showed a red shift when the heating time t increased, which matched up with the increase in QD diameter. This change is caused mainly by Ostwald ripening. The molecules that dissolved from the smaller-sized CdTe QDs grew onto other CdTe QDs to form larger-sized CdTe QDs (Lan et al 2009). The emission spectra in figure 4(b) showed a red shift for the emission wavelength with prolonged heating time for CdTe synthesis. Different samples of QDs have different fluorescence colors, according to their size: green emission for 4.84 nm QDs, yellow emission for 5.50 nm QDs, orange emission for 6.65 nm QDs and red emission for 7.68 nm QDs. As reported by other teams (Norris and Bawendi 1996, Klimov et al 2000), the bigger QDs will emit fluorescence at longer wavelengths, as a result of the increase in exciton binding energy and reduction for emission energy. The corresponding QY increased from 39.68% to 50.98% (see figure 4(d)), which proved that longer heating times t decrease surface defects on CdTe QDs, improve the crystallinity, and then increase the QY of the obtained CdTe QDs.
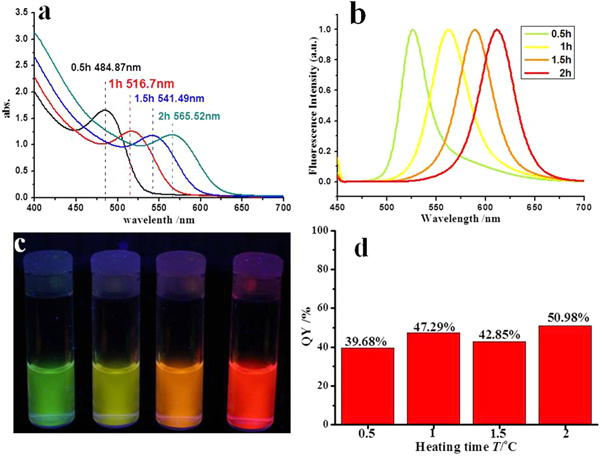
Figure 4. Optical properties of CdTe QDs after different heating times. The synthesis parameters for the QDs colloid were T = 140 °C and Cd/Te = 4:1. (a) The absorption spectra; (b) normalized emission spectra for the four samples (λex = 450 nm); (c) picture of four CdTe QDs colloids under UV lamp (λex = 366 nm); the heating time t for samples from left to right were 0.5, 1, 1.5 and 2 h; (d) QY value of each sample.
Download figure:
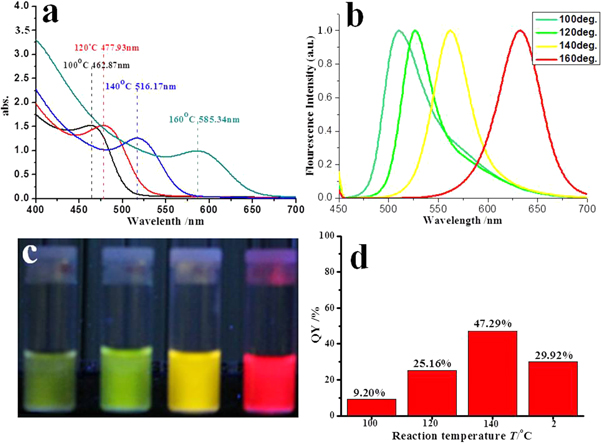
Standard image High-resolution imageAnother factor that influences the emission of prepared CdTe QDs is the reaction temperature T. In these experiments, the heating time was fixed at 1 h and the Cd/Te was fixed at 4:1, and four CdTe QDs samples were prepared at 100 °C, 120 °C, 140 °C and 160 °C. Absorption and emission spectra were collected for the four samples, as shown in figures 5(a) and (b), respectively. The absorption peak shows a red shift from 463 nm to 585 nm, which was due to the increase in the diameter of PCS QDs from 3.93 to 5.81 nm. When the temperature is increased, the number of the CdTe clusters does probably not change, but the size increases. Based on Ostwald ripening, the initial rapid growth of the CdTe particles is due to the contribution of CdTe molecules diffusing onto the smaller CdTe clusters. The rate of such a process is directly proportional to the exposed surface area of the particle and the reaction temperature T. So the steady-state size of the particle (rmax) can generally be described by the following equation (Mohamed et al 1999):

where θ is the angle that specifies the degree of contact of the particle with the substrate, N0 is the concentration of the CdTe molecules on the surface, α is a factor representing the fraction of the exposed surface area, ρs is the surface density of the particle, ν is the mean Cd-Te vibration frequency, E0 is the diffusion activation energy, Q is the desorption activation energy, and k is the Boltzmann constant. It is deduced from equation (10) that a temperature increase will result in larger rmax, which matches up with the data from PCS. The increase in the size of CdTe QDs, caused by the higher reaction temperature, results in the red shift of emission peak in the spectra, as shown in figure 5(b), where the emission peak moved from 512 to 634 nm as a result of the size effect. The QYs of CdTe QDs increased from 9.20% to 47.29% as T increased from 100 °C to 140 °C, which should be caused by the increased CdTe crystallinity with higher T. However, when the temperature increased to 160 °C, the QY abruptly decreased to 29.92%, which has never been reported before and will be systematically studied in future work.
Figure 5. Optical properties of CdTe QDs synthesized at different reaction temperatures. The synthesis parameters for the QDs colloid were t = 1 h and Cd/Te = 4:1. (a) absorption spectra; (b) normalized emission spectra for the four samples (λex = 450 nm); (c) pictures of four CdTe QDs colloids under UV lamp, λex = 366 nm, and the reaction temperatures T for samples from left to right were 100 °C, 120 °C, 140 °C and 160 °C. (d) QY of CdTe QDs.
Download figure:
Standard image High-resolution image
4. Conclusions
Cadmium telluride CdTe QDs have been successfully synthesized via a hydrothermal method. The use of Na2TeO3 as the Te source and NaBH4 as the reducing agent avoided the instability and expense of widely-used NaHTe. The size of CdTe QDs depends on the reaction temperature and heating time, and the increase of the two parameters resulted in bigger CdTe particles. Through the study of optical properties, it was found that the fluorescence emission shows red shift as the size of CdTe QDs increases, and the fluorescence intensity is dependent on the initial molar ratio between Cd and Te. When extra Cd ions are employed, Cd-3-MPA complex forms on the surface of CdTe, resulting in higher fluorescence intensity. A new method was employed to measure the concentrations of Cd and Te in CdTe, by combining absorption and fluorescence methods. This novel method proved to be an efficient method to measure the concentrations of Cd and Te ions in a mixture.
Acknowledgments
This work was supported by the Fonds de la Recherche Scientifique (FNRS), the ARC, UIAP and ENCITE programs. The support and sponsorship provided by COST Actions and the EMIL program are kindly acknowledged. The authors thank the Center for Microscopy and Molecular Imaging (CMMI, supported by the European Regional Development Fund and the Walloon Region).