
Abstract
Additive manufacturing (AM) surfaces offer the possibility of novel cooling channel geometries for high temperature applications. AM processes can optimize the internal geometry of cooling channels, which is generally constrained by limitations of conventional machining processes. The AM process gives rise to surface textures that depend on the build and scan orientations that also potentially contribute to heat-transfer characteristics and provide additional considerations for optimization. The motivation behind this research work is to explore the correlation between AM roughness characteristics (build-orientations, density of spatter deposits and their sizes, amplitudes/wavelengths, etc) and the resulting effect on heat transfer and pressure drop across cooling channels. In this study, the actual AM surfaces with different build angles were fabricated using Laser powder bed fusion (LPBF) and the roughness data of these surfaces were acquired. These measured surface topographies were used for developing simplified surfaces for the purposes of CFD simulations. Modeled AM surfaces with different build orientations were used to analyze the effect of built orientation and spatter deposits in terms of heat transfer for different flow conditions. The CFD simulations also informed the design of the experimental set-up for the validation of computational results. For the comparison, a reference smooth surface is machined from forged Inconel-625 for experiments and CFD simulations were also carried out for the validation. Results from CFD simulations show that the surface features (such as build angles and spatter deposits) significantly affect the heat transfer and fluid flow in terms of Nusselt number and pressure drop and the surface area impact on heat transfer is minimal in all the cases for both laminar and turbulent flow conditions. Under turbulent flow conditions, transverse track alignment shows the highest efficiency in terms of the Nusselt number and adding particles improves heat transfer efficiency for smooth and parallel-tracked surfaces. However, when the flow becomes laminar, reversed behavior is observed and surfaces show downside effects in terms of Nu. Also we define a performance factor that assesses the combined effects of both the thermal and the fluid flow characteristics to differentiate the performance of the AM channels.
Export citation and abstract BibTeX RIS

Original content from this work may be used under the terms of the Creative Commons Attribution 4.0 licence. Any further distribution of this work must maintain attribution to the author(s) and the title of the work, journal citation and DOI.
Nomenclature
| ρ | Density of fluid (kg/m3). |
| Ac | Cross sectional area of the channel (mm2) |
| As | Surface area (mm2) |
| DH | Hydraulic diameter (mm) |

| Mean hydraulic diameter (mm) |
| f | Friction factor. |
| h | Heat transfer coefficient (w/m2-K) |
| I | Current (Amp) |
| Inclin | 45° Inclined tracked surface |
| IWP | 45° Inclined tracked surface with particles |
| Paral | Parallel tracked surface |
| PWP | Parallel tracked surface with particles |
| Smth | Smooth surface |
| SWP | Smooth surface with particle |
| Trans | Transverse tracked surface |
| TWP | Transverse tracked surface with particles |
| k | Kinetic energy (J) |
| Kf | Thermal conductivity of water (w/m-K) |
| L | Channel length (mm) |
| Nu | Nusselt number. |
| ρp | Particle density (No of particles/mm2) |
| PCh | Perimeter of channel (mm) |
| Pi | Inlet surface average pressure (kPa) |
| Po | Outlet surface average pressure (kPa) |
| q | Heat input (w) |
| q' | Heat flux (w/m2) |
| R | Resistance (Ω) |
| Re | Reynolds number |
| STD | Standard Deviation |
| Tm | Bulk mean temperature (K) |
| Ts | Interface surface temperature (K) |
| Tso | Surface average outlet temperature |
| v | Mean velocity (m/s). |
| V | Voltage (volt) |
| ΔP | Pressure drop (kPa) |
| ω | Turbulent frequency |
1. Introduction
To adopt additive manufacturing (AM) for parts having complex cooling channels, an understanding of the relationship between the as-built surface finish and heat transfer need to be developed. In laser powder bed fusion (LPBF, one of the AM techniques), there are several build parameters (e.g., part orientation during the build) that affect the final part surface topography and hence heat transfer [1].
Many studies have been carried out to investigate the effect of AM process variables on the surface roughness. Delgado et al [2] investigated the effects of build orientation (the orientation of the normal to the built surface) on surface roughness and dimensional tolerance for LPBF parts. He showed that build angles extensively affect the roughness of AM parts compared to other process parameters. However, this study is limited to two build angles only. In addition to that Fox et al [3] investigated the effects of built orientation on surface roughness in more detail. They varied the orientation of the built surface to the Z-axis of the build chamber and position within the chamber. To understand the relationship between topographies of real AM surfaces and its effects on heat transfer, surfaces with different orientations were fabricated using LPBF and analyzed [3].
Other authors examined the effects of roughness of AM parts over heat transfer. Snyder et al [4], investigated the effects of build directions on surface roughness of AM parts and its further effects on heat transfer. For this study, the authors built test coupons with different build angles and developed an experimental set-up. From this study the author showed that build direction affects the heat transfer and pressure drop. Kandilkar et al [5] also studied the effect of surface roughness on pressure drop in microchannels. They suggested that the maximum profile peak height (Rp) and mean spacing of profile elements (RSm) correlates with the friction factor. In addition, some authors also quantified the performance of micro channels with rough surfaces by defining evaluation factors. In this regard, Yuan Xing et al equation (9) [6] have defined the thermal performance to evaluate the performance of circular rough micro-channels. However, these studies are limited to channel geometries only and a detailed investigation of the effects of built orientation (including the effects of spatter deposits with waviness) only on heat transfer and fluid flow have not been explored.
In this study we focus on the orientation of weld tracks relative to the flow direction. This orientation can be realized in the AM parts built through adjustments to part orientation within the build chamber [1]. We also introduce a new performance factor that captures both the thermal and hydraulic characteristics of a channel which vary with the roughness and orientation of the AM channel relative to the flow direction.
Simplified surfaces were developed for use in computational fluid dynamics (CFD) simulations and were based on measured surface topographies from prior work by the authors [1]. The simplifications were necessary to reduce the computational overhead and meshing issues associated with the modeling of real surfaces (i.e., surfaces with a wide range of spatial wavelengths present). Also, to better model AM surfaces, a unique approach to treating particles/spatter deposits (e.g., ejecta from the melt pool, partially melted powder particles, etc) and their distribution has been adopted in this study. This framework was used to analyze heat transfer in terms of Nusselt number (Nu), pressure drop (ΔP) and the new performance factor (PF), while separating the effects of track orientation and particles/spatter.
CFD simulations for different flow conditions (e.g., laminar and turbulent) and quantities of heat supplied were performed using the commercial CFD software, STAR-CCM+. The CFD simulations also informed the design of the experimental set-up for the validation of computational results. The experimental set-up is designed to analyze the effects of having one AM surface of the four surfaces of a cooling channel. This allows variation in weld track orientation and the effect of the wide range and complexity of topographies, commonly seen on as-built AM surfaces, to be explored.
2. Modeling of AM surfaces
In CFD, modeling of roughness using a 'sand-grain' model is a commonly known technique [7]. In this approach, the profile Root Mean Square (RMS) value of roughness (rq) is used to estimate the roughness heights (Ks see figure 1 in [7]) of spherical grains and represents the roughness as spherical grains. However, this model assumes an isotropic, statistically stationary surface topography [8], which does not describe LPBF AM surfaces because of the large dynamic range of surface variability and presence of spatter deposits. Therefore, we developed an approach which can represent the variabilities (e.g. build orientations, distribution and modeling of particles with different heights) of AM surfaces in a more realistic and specific way. Our approach is based on characterization of significant changes in topography with build orientation [9]. In this work, several characterization techniques (using focus variation microscope) were used to understand the effect of build orientations on surface features. Key characteristics of that work were the area scale [10], amplitude-wavelength content, and positions of partially-melted powder particles on the surface [1]. Therefore, AM surfaces were modeled by acquiring the roughness data from the LPBF AM surfaces with different build orientations. The methodology to model AM surfaces is depicted in figure 2.
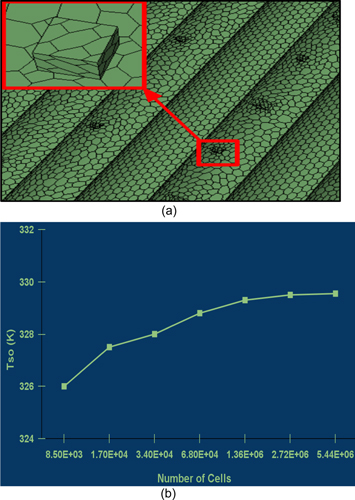
Figure 1. (a) Meshing of modeled AM surfaces with spatter deposits. (b) Grid independence analysis.
Download figure:
Standard image High-resolution image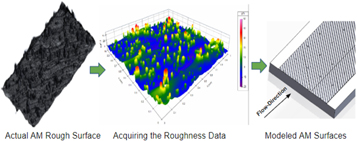
Figure 2. Modeling of AM surfaces.
Download figure:
Standard image High-resolution imageTo model the AM surfaces, mean (RMS) dimensions (wavelength = 30 μm and amplitude = 150 μm) of measured surfaces have been used. According to build orientations, three critical surface patterns (weld tracks parallel to the flow, weld tracks transverse to the flow, weld tracks inclined to the flow) are modeled and a smooth surface is modeled as a reference surface to compare the difference in terms of heat transfer and pressure drop.
In this approach, spatter was also modeled separately and then both surface area and hydraulic diameters were calculated. Modeled AM surfaces with spatter deposits are shown in figure 3.
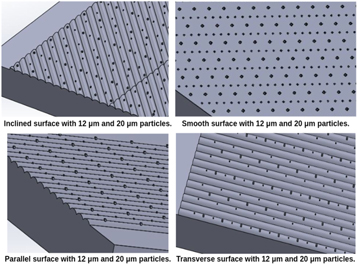
Figure 3. Modeled AM surfaces.
Download figure:
Standard image High-resolution image2.1. Modeling of spatter deposits
From the surface roughness characterization, we also learned that the ideal shape for spatter deposits could be a sphere, an elliptical, an oblate, a prelate, or a rugby ball. Therefore, in the early stage we also modeled the small numbers of spherical particles on top of weld-tracked surfaces and carried out the CFD simulations. However, when we tried to increase the number of particles according to the particle densities determined in table 1, we struggled with meshing. Therefore, we started working on different shapes for the particles (rectangular, hexagonal, octagonal and cuboids) and found that the cuboid with similar surface area is the best among them because it gives the similar results (in terms of Nu and ΔP) as we got from the spherical ones and these also allowed us to accommodate the numbers of particles according to the particle densities without having any issue with the meshing. Comparison of Nu for cuboid and hemispherical particles has also been discussed in figure 3 of [8]. Since, the difference between the results for both particles is negligible (less than 1%) and therefore we do not need to account for any numerical coefficients to compensate for the differences in the numerical results.
Table 1. Particle densities for different AM surfaces.
| Surfaces | ρp (30 μm) | ρp ( 20 μm) | ρp (12.5 μm) |
|---|---|---|---|
| Smooth | 16.00 | 6.00 | 11.95 |
| Parallel | 13.25 | 6.67 | 11.95 |
| Transverse | 21.10 | 6.70 | 10.00 |
| Inclined | 20.67 | 6.80 | 9.40 |
Therefore the spatter deposits were modeled according to the approach discussed in [8]. In this approach, spatter deposits have been represented as cuboid particles and for the distribution of particles, particle densities were calculated on the basis of particle histogram discussed in [9].
2.2. Channel dimensions
On the basis of build-orientation shown in figure 3 and distribution of spatter deposits, hydraulic diameter and interface surface area was calculated for each case ans shown in table 2.
Table 2. Hydraulic diameters for various surfaces.
| Surfaces |
 (μm) (μm) | As (mm2) |
|---|---|---|
| Smth | 2000.00±0.0 | 240.0 |
| SWP | 1996.89±2.70 | 244.8 |
| Paral | 1907.62±0.02 | 264.0 |
| PWP | 1906.93±0.05 | 268.8 |
| Trans | 1970.27±25.74 | 268.8 |
| TWP | 1970.79±24.91 | 273.6 |
| 45° Inclin | 1900.08±3.59 | 288.0 |
| 45° IWP | 1891.23±16.41 | 295.2 |
Equation used to calculate hydraulic diameter is as follows:

In CFD, the surface area was calculated using the surface integral of each cell at the fluid-inconel interface.
3. CFD analysis
To perform CFD analysis, rectangular micro-channels with different AM surfaces were modeled. These micro-channels incorporate two different materials,Inconel and high temperature Formlab resin, as shown in figure 4. The side and upper walls are made of resin while the bottom part of the channel was made of inconel. The purpose of using two different materials is to isolate the effects of AM surfaces by reducing the heat loss to the side and upper walls. The use of plastic walls keeps the majority of the thermal loss to the AM surface and thus enables the study of the effect of different AM surfaces.
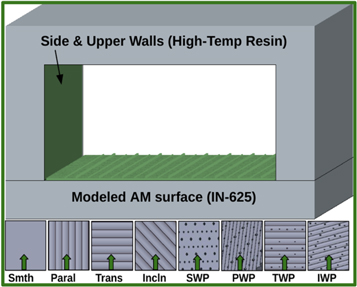
Figure 4. CFD model of AM channel and surfaces (green arrows represent the flow directions).
Download figure:
Standard image High-resolution imageTo perform CFD simulations, steady-state fluid flow and heat transfer have been considered and heat losses due to radiation were neglected. To solve the RANS equation, Mass flow inlet and pressure outlet boundary conditions have been applied at the entry and exit of the channel respectively. Constant heat flux was provided at the bottom of the channel and all the side and upper walls of the channel were assumed to be insulated. For Re = 1000, fully developed laminar flow were assumed at the outlet of the channel.
For simulations, in-built Reynolds-averaged Navier–Stokes (RANS) models [17] were used and are discussed in the subsection below. Channel dimensions are discussed in table 3.
Table 3. Channel dimensions of CFD model.
| Parameters | Values (mm) |
|---|---|
| Length | 60.0 |
| Width | 4.0 |
| Height | 1.5 |
| Thickness | 0.5 |
3.1. Turbulent model
For most thermo-fluid problems, it is not necessary to resolve minute fluctuations of turbulent flow. Therefore, the majority of numerical simulations for turbulent flow problems can be done with Reynolds-averaged Navier–Stokes (RANS) equations [11]. For a particular turbulent flow problem, it is required to use a suitable RANS model based on applications.
For our study, we are using the k-ω RANS model because this model allows an accurate near wall treatment which is recommended for rough surfaces. Also this model is well suited for wall bounded and low Reynolds number flows. In the k-ω RANS model, two transport equations are solved for kinetic energy k and turbulent frequency ω and it also has straightforward Dirichlet boundary conditions, which leads to significant advantages in numerical stability [11].
In this study, we are using shear stress transport (SST), a variant of the k-ω model which is a combination of the original Wilcox k-ω model [11] for near walls and the standard k–ε model away from walls [12].
3.2. Conjugate heat transfer model
The proposed problem to study the heat-transfer characteristics of various AM surfaces is a coupled thermal-fluid problem. The coupling is taken into account by using the conjugate heat transfer (CHT) technique. In this technique, RANS equations for the fluid flow and the heat conduction equation for heat transfer within the solid are interactively solved to steady-state and for that the time-marching algorithm is used [13]. The surface temperature is obtained by solving the RANS equations and then can be used as a boundary condition to determine the heat flux through the solid surface. Thereafter, this heat flux is used as a boundary condition for solving the RANS equations furthermore in the next time-step. This procedure has been repeated until a solution is reached out to the steady-state [13].
3.3. Meshing and grid independence analysis
For the meshing, prismatic boundary layer cells were used to resolve the boundary layers at fluid-solid interfaces. In order to capture the circulation near walls, the growth size of prismatic layers were kept 15 percent of the base size with an increment of layer size of 1.2.
The smallest size of the particle considered in this study is 12.5 μm and the smallest cell size of the mesh is 4.2 μm and the numbers of cells to define the boundary of the deposits adjacent to the wall are 12. Figure 1(a) shows the meshing of particles and number of cells adjacent to the wall.
To get results with acceptable accuracy and independent of grid sizes, grid independence analysis was performed. In this analysis, the surface average temperature of outlet has been used as a criterion for mesh sufficiency. Various trades had been carried out to optimize the mesh size ranging from 85000 to 5 million cells (figure 1(b))and the optimized cells were 3 million (approximately).
4. CFD results
CFD results for the characterization of heat transfer and fluid flow have been evaluated in terms of three parameters: the Nusselt number, Nu, the pressure drop, ΔP, and the performance factor, PF, and these are discussed in subsections below.
4.1. Characterization of heat transfer
The effects of AM surface roughness on heat transfer were studied using the average Nusselt number, Nu, given by [4].

This definition has been used previously by Snyder et al to evaluate the extent of convective heat transfer for different AM channels [4].
Figures 5 and 6 show the CFD simulation results of Nu for various channels for both turbulent and laminar flow conditions, respectively. The simulations show that the Nu changes with build orientation, with transverse weld track orientation (Trans) performing the best for turbulent flow (figure 5). Figure 5 also shows that the effects of spatter deposits are minimal for transverse (Trans versus TWP) and inclined (Inclin versus IWP) track surfaces while it has a greater impact on parallel (Paral versus PWP) track and smooth (Smth versus SWP) surfaces.
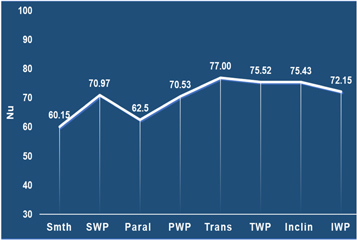
Figure 5. Nu for turbulent flow (Re = 4000) conditions. See the nomenclature section for interpretation of the horizontal axis labels.
Download figure:
Standard image High-resolution image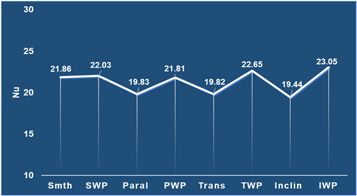
Figure 6. Nu for laminar flow (Re = 1000) conditions. See the nomenclature section for interpretation of the horizontal axis labels.
Download figure:
Standard image High-resolution imageAs the Reynolds number decreases and flow becomes laminar, the addition of tracks without particles reduces Nu (Smth versus Paral versus Trans versus Inclin in figure 6), presumably due to stagnation of fluid in the valleys of the weld tracks. We also find that the addition of particles for laminar flow improves heat transfer for all the cases compared to the same geometry without particles. The particles create wakes that improve diffusion and mixing among adjacent fluid layers, increasing convective heat transfer.
To highlight the role of surface texture more clearly, we look at the percent change in the Nusselt number by using the smooth surface without particles (Smth) as a reference. This is shown for the turbulent flow condition in figure 7 (notice the zero percent value change for Smth).
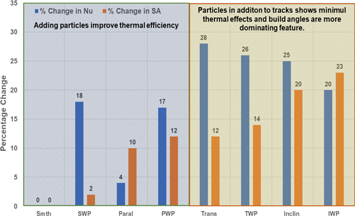
Figure 7. Effects of surface characteristics on percentage change in Nu and surface area for turbulent flow (Re = 4000) conditions.
Download figure:
Standard image High-resolution imageThe figure has been divided into two regions (light blue and light yellow) to highlight the surface feature dominating the heat transfer characteristics observed for turbulent flow (track orientation versus particles).
We see that the presence of particles alone for turbulent flow causes an 18% increase in the Nusselt number for the smooth (SWP) surface (yellow region). The parallel tracks alone increase Nu by 4% but it jumps to 17% with the addition of particles (PWP). Thus, the addition of tracks parallel to the flow increases heat transfer, but the addition of particles increases heat transfer more significantly. The blue region highlights the channel behavior with the addition of tracks at an angle to the flow (transverse and inclined). In contrast, here we see a significant improvement caused by the track orientation alone (28% for Trans and 25% for Inclin). The addition of particles only slightly changes these numbers and interestingly slightly reduces heat transfer compared to what is seen with adding particles to smooth and parallel conditions.
As seen in figure 6, when the mass flow rate is low and the flow becomes laminar, an AM surface texture has a quite different effect. With laminar flow, the addition of tracks, regardless of their orientation, consistently reduces the percentage change in Nu (figure 8) because, as discussed above, the stagnation of the fluid in the track valleys effectively reduces the hydraulic diameter of the channel.
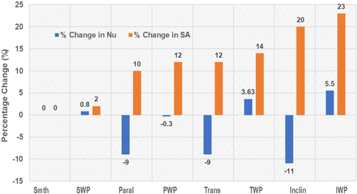
Figure 8. Effects of surface area on heat transfer for laminar flow (Re = 1000) conditions.
Download figure:
Standard image High-resolution imageThe addition of particles counters this with generation of wakes that improve diffusion and mixing among adjacent fluid layers, increasing Nu.
4.1.1. Effect of surface area on heat transfer
As roughness increases, surface area also increases and according to the classical literature, heat transfer is directly proportional to the surface area [14]. Figure 7 also shows the percentage increase in surface area with the addition of particles and tracks, with tracks having a larger percent area increase. If the surface area effect dominated, we would expect the percentage change in Nu to track the percentage change in surface area, and this is not the case. In the turbulent limit, the added mixing (or diffusion) within adjacent layers of fluid caused by the particles and tracks appears to play a more significant role than the increased surface area alone would predict. In the laminar flow limit, the percentage change in the Nusselt number likewise does not track with surface area, again suggesting the impact of the surface texture on the flow also dominates the heat transfer characteristics.
4.2. Characterization of fluid flow
To characterize the fluid flow due to the effects of roughness, results have been evaluated in terms of pressure drop and the friction factor. Here the pressure drop is defined as the difference between inlet and outlet surface average pressure,

The friction factor is defined as [6]

For both turbulent and laminar flow, the pressure drop increases with added surface texture (figures 9 and 10), and the amount depends on the track orientation and particle details. While the trends are similar for turbulent and laminar flow, the highest pressure drop is at a different condition for turbulent (highest at TWP) versus laminar (highest at Inclin) flow, indicating the difference in diffusion among fluid layers in the two flow conditions is important.
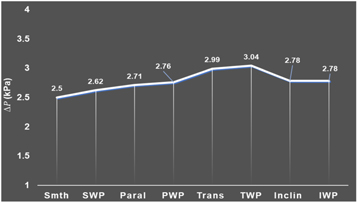
Figure 9. Pressure drop for turbulent flow (Re = 4000).
Download figure:
Standard image High-resolution image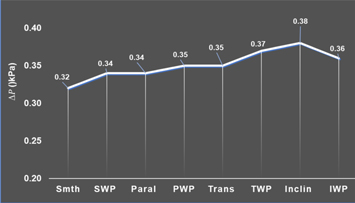
Figure 10. Pressure drop for laminar flow (Re = 1000).
Download figure:
Standard image High-resolution image4.2.1. Effect of surface area over pressure drop
From the literature [14], it has been suggested that roughness increases the interface (fluid-solid) surface area and this causes higher resistance in the direction of fluid flow, thus leading to increased pressure drop. This would suggest pressure drop should track with increasing surface area which is a measure of increasing roughness. Again, this is not directly the case. For turbulent flow (figure 11) pressure drop tracks with increasing roughness (added surface area), but departs from this trend for the inclined tracks with and without particles. For laminar flow (figure 12) pressure drop tracks with roughness but clearly departs from the trend for the inclined with particle geometry. This suggests that the details of the fluid mixing given the texture geometry and the flow condition are important for predicting the pressure drop.
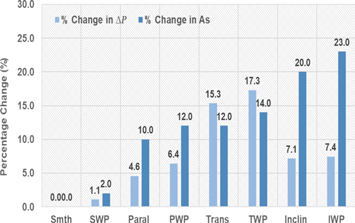
Figure 11. Effects of surface area on pressure drop for turbulent flow (Re = 4000) conditions.
Download figure:
Standard image High-resolution image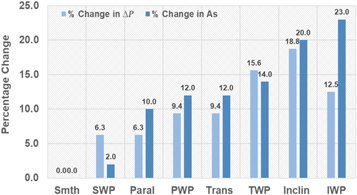
Figure 12. Effects of surface area on pressure drop for laminar flow (Re = 1000) conditions.
Download figure:
Standard image High-resolution image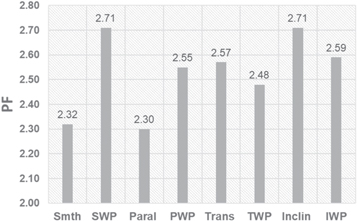
Figure 13. Performance factor of various channels at laminar flow conditions.
Download figure:
Standard image High-resolution image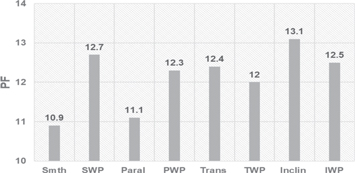
Figure 14. Performance factor of various channels at turbulent flow conditions.
Download figure:
Standard image High-resolution image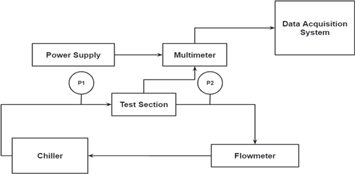
Figure 15. Flow loop for experimental investigation.
Download figure:
Standard image High-resolution image4.3. Performance of AM channels
In order to evaluate the overall performance of the AM channels, we define a performance factor that assesses the combined effects of both the thermal and the fluid flow characteristics. We calculate a performance factor (PF) as

The performance factor is a dimensionless number where a high PF value indicates high convective heat transfer with low pressure drop (low friction factor). A large Nusselt number is obviously desirable and a low pressure drop is important if pumping power requirements are a consideration. Also, table 4 depicts the friction factor values for various surfaces and at different flow conditions. The IWP surface has the highest values of performance factor for both laminar and turbulent flow conditions (figures 13 and 14), meaning it is the best performing surface.
Table 4. Friction factor for different modeled AM surfaces.
| Surfaces | f(Re = 4000) | f(Re = 1000) |
|---|---|---|
| Smth | 0.057 | 0.111 |
| SWP | 0.058 | 0.118 |
| Paral | 0.055 | 0.112 |
| PWP | 0.056 | 0.116 |
| Trans | 0.063 | 0.119 |
| TWP | 0.064 | 0.126 |
| Inclin | 0.057 | 0.125 |
| IWP | 0.056 | 0.118 |
5. Experimental investigation
To validate CFD results an experimental setup with an exchangeable AM part has been designed and developed for this study. Detailed design of this setup is discussed in subsections below.
5.1. The experimental setup
An experimental setup has been designed as discussed in section 3. It has been fabricated such that the side and upper walls of the channel should be of high temperature resin using stereolithography (SLA).
The experimental set-up (figure 16) has been designed such that the maximum temperature at the metal-plastic interface should not exceed the deflection temperature of high-temperature resin. Figures 15 and 17 show the flow loop and actual setup respectively.
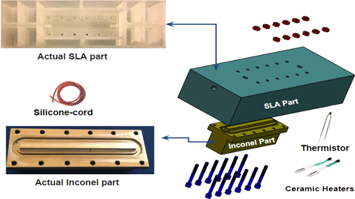
Figure 16. Full assembly of experimental setup.
Download figure:
Standard image High-resolution image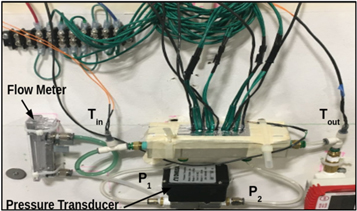
Figure 17. Actual experimental setup.
Download figure:
Standard image High-resolution imageThis test-section is equipped with converging and diverging sections at inlet and outlet (figure 18) respectively for the smooth entry and exit of the fluid from the test section.
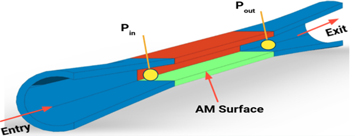
Figure 18. Measurement of pressure drop during experiment.
Download figure:
Standard image High-resolution imageTo measure temperature along the length of the channel and also at the inlet and outlet, calibrated 5 KΩ thermistors have been used. To provide constant heat supply, four 12 V and 40W ceramic cartridge heaters are used.
5.2. Fabrication of smooth Inconel part
For the experimental investigation, an Inconel part with smooth surface ( ) has been fabricated at UNC Charlotte machine shop. For this, a forged Inconel-625 rod was machined and carbide tools were used for drilling of holes (shown in figure 16).
5.3. Fabrication of SLA part
The experimental setup incorporates two different materials, Inconel-625 and high temperature Formlab resin, as shown in figure 4. The side and upper walls are made of resin while the bottom part of the channel was made of inconel. The purpose of using two different materials is to isolate the effects of AM surfaces by reducing the heat loss to the side and upper walls. The use of plastic walls keeps the majority of the thermal loss to the AM surface and thus enables the study of the effect of different AM surfaces. However, the LPBF is an expensive technique (in terms of time, cost and post processing) and more suitable for high temperature alloys such as inconel and not for the carbon resin materials. On the other hand, SLA is less expensive, requires minimal post-processing and highly recommended for the polymers like carbon resins. Therefore, that part was prepared by SLA [15, 16].
The SLA part has been fabricated in 3-D printing facilities of UNC Charlotte. In this facility, Formlab SLA 3-D printer has been used.
Fabrication of the SLA part has been done in the following three stages and figure 19 depicts all these stages.
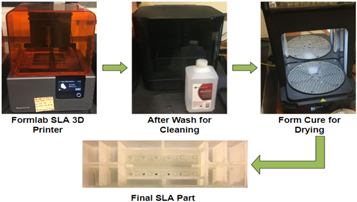
Figure 19. Fabrication of SLA part.
Download figure:
Standard image High-resolution imageIn the first stage, part is fabricated using 3-D CAD model which takes 6–7 h, in the second stage fabricated part is cleaned using Formlab after wash for 30 min and in third stage the cleaned SLA part is dried using Formlab cure for 10 min and after that our part is ready to use.
5.4. Comparison of CFD and experimental results
Validation of CFD results has been done by performing various experiments with different inlet temperatures and heat inputs at different flow conditions with the smooth Inconel-625 channel. Both experimental and CFD results are discussed in the following subsections.
5.4.1. Results with different inlet temperatures
For the preliminary investigation, experiments were performed without the heat supply but with different inlet temperatures (20 °C, 25 °C and 30 °C) at laminar flow conditions. These results were then compared with CFD results (shown in figures 20 and 21).
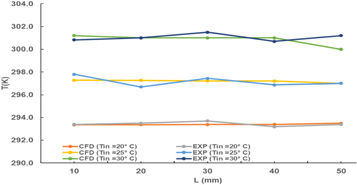
Figure 20. Temperature along the length of the channel for different inlet temperatures (Re = 1000).
Download figure:
Standard image High-resolution image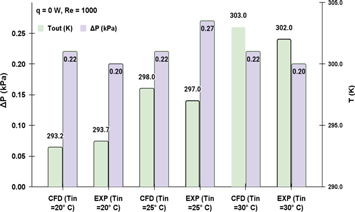
Figure 21. Outlet temperatures and pressure drop for different inlet temperatures and no heat input (Re = 1000).
Download figure:
Standard image High-resolution imageIn figure 20, temperatures are plotted along the length of the channel and in figure 21, outlet temperature and pressure drop have been plotted for different inlet temperatures without heat input. We see from the experiment that the temperature repeatability is on the order of ±0.2°. From this limited sampling, we estimate the experimental pressure drop is 0.22 ± 0.02 kPa on average over these temperature conditions compared to the constant CFD pressure drop of 0.22 kPa for all temperatures.
5.4.2. Results with constant heat supply
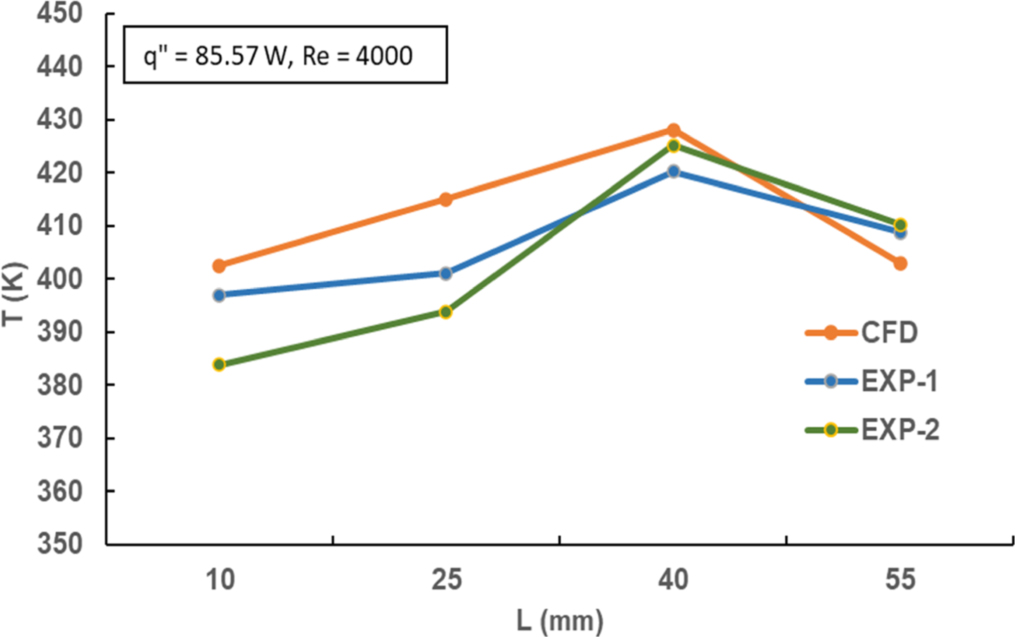
Experiments were performed with constant heat inputs and at different Reynolds numbers using smooth Inconel parts. In figures 22–23, experiments were performed at two different flow conditions (laminar and turbulent) and two heat inputs (q' = 50.258 W and 85.57 W).
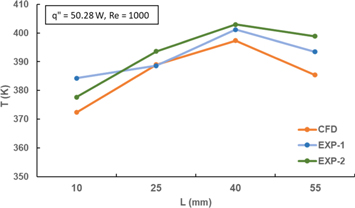
Figure 22. Temperature along channel length for a constant heat input of 50.28 W (Re = 1000).
Download figure:
Standard image High-resolution image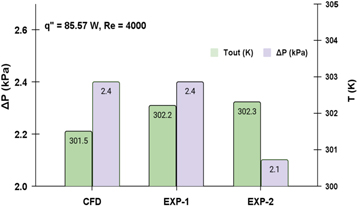
Figure 23. Results for constant heat input (Re = 4000).
Download figure:
Standard image High-resolution image
Figure 24. Temperature along channel length for constant heat input (Re = 4000).
Download figure:
Standard image High-resolution image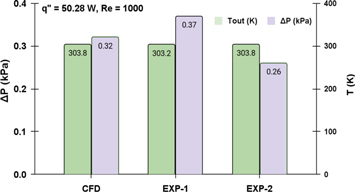
Figure 25. Results for constant heat input (Re = 1000).
Download figure:
Standard image High-resolution image
For repeatability tests, the same experiments were performed at two different times. From figures 22–23 It can be observed that CFD results are in good agreement with experimental results however the gap between CFD and experimental results increased compared to the results shown in figures 20–21.
The differences we observe between CFD and experimental results is considered small in the CFD community [4, 5], given the challenges of estimating many realistic experimental parameters for the CFD simulations and the many sources of uncertainty in the experiments.
A detailed uncertainty analysis is underway to establish a quantitative comparison. Preliminary estimates suggest the experimental uncertainty in the heat supply and the location of the temperature readings are significant and reasonably account for the observed differences with simulation.
6. Conclusion
Numerical investigation of fluid-flow and heat-transfer characteristics of various modeled AM surfaces were carried out for both laminar and turbulent flow conditions. For the validation of numerical (CFD) results, experiments were performed with smooth Inconel parts for different flow conditions and heat inputs. CFD results were in reasonable agreement with experimental observations, given large uncertainties in a few experimental parameters. A detailed uncertainty analysis is underway. The CFD results show that the track orientations of AM surfaces and spatter deposits are the most dominating features of AM surfaces and the surface area impact on heat transfer is minimal in all the cases for both laminar and turbulent flow conditions. Under turbulent flow conditions, transverse track alignment shows highest efficiency in terms of the Nusselt number and adding particles improves heat transfer efficiency for smooth and parallel tracked surfaces in the turbulent limit. However, when the flow becomes laminar, opposite behavior of modeled AM surfaces was observed and surfaces show downside effects in terms of Nu. The next experimental steps include estimating uncertainty contributions based on [18, 19] and measurement of surface roughness characteristics with actual non-smooth AM surfaces are underway.
Acknowledgments
This work was partially funded by the Center for Precision Metrology Affiliates program at the University of North Carolina at Charlotte and the National Institute of Standards and Technology. Jason Fox (NIST) provided detailed LPBF process insight required for AM fabrication of the test samples and on-going advice on surface topography characterization. J. Tarr (NIST) supported the fabrication of AM samples. We would also like to thank Chris Evans (UNCC/NIST) for on-going support) and, Alkan Donmez and David Deisenroth from NIST for their help with the design of the experimental setup.
Data availability statement
All data that support the findings of this study are included within the article (and any supplementary files).
Disclaimer
Certain commercial entities, equipment, or materials may be identified in this document in order to describe an experimental procedure or concept adequately. Such identification is not intended to imply recommendation or endorsement by the National Institute of Standards and Technology, nor is it intended to imply that the entities, materials, or equipment are necessarily the best available for the purpose.