


Abstract
SnO2 and 5 wt% Ni doped SnO2 nanoparticles (SnO2:Ni NPs) were successfully synthesised by a template-free hydrothermal method. X-ray diffraction (XRD) patterns depicted polycrystalline nature of the NPs in rutile-type cassiterite phase with dominant (110) and (101) Bragg diffraction peaks. Rietveld refinement of XRD patterns supported single phase tetragonal crystal structure having space group P42/m n m. With Ni doping, crystallite size of NPs decreased from 39 nm to 35 nm whereas lattice strain increased from 3.56 × 10⁻³ to 3.99 × 10⁻³. This is attributed to the substitution of Sn4+ ion by Ni2+ ions. The morphology of the SnO2 NPs also changed from regular spherical shape to elongated irregular shape upon Ni doping. The dominant Raman peak obtained at 634 cm−1 matched with the signature peak for rutile SnO2 (Raman A1g mode). Further, we observed disappearance of Eg mode due to Ni doping, which indicated the formation of oxygen vacancies. Also, XPS analysis indicated an increase of oxygen vacancy concentration in the doped NPs due to charge imbalance between Sn4+ and Ni2+. The direct optical band gap of SnO2 increased from 3.97 eV to 4.11 eV when doped with 5 wt% Ni and it is ascribed to Burstein–Moss effect. Irrespective of higher optical band gap of SnO2:Ni NPs, they showed enhanced photocatalytic activity to degrade Rhodamine B (RhB) dye molecules under UV-visible irradiation. The first order kinetic reaction rate constants for degradation of RhB were found to be 0.014 min−1 and 0.045 min−1 in case of SnO2 and SnO2:Ni NPs respectively. The enhanced photocatalytic activity in SnO2:Ni NPs is explained by relating to the formation of more oxygen vacancies and chemisorptions of O2 and H2O molecules followed by generation of radicals. This work demonstrates the superiority of SnO2:Ni NPs for use as photocatalytic material for industrial waste water treatment.
Export citation and abstract BibTeX RIS
1. Introduction
Metal oxide semiconductors like TiO2, ZnO, and SnO2 are continually drawing attention of researchers as these are promising candidates for a number of technological applications due to their light absorption properties, charge-transfer characteristics and electronic structures. Among these, bulk crystalline SnO2 possesses tetragonal rutile structure (cassiterite phase), oxygen deficient n-type electrical conductivity and a direct band gap (Eg ) equal to 3.6 eV (344 nm). The unit cell consists of two six-fold coordinated tin and four three-fold coordinated oxygen atoms. It is one among many metal oxides extensively investigated as transparent conducting material due to excellent optical and electrical properties. Tin oxide nanoparticles (NPs) have shown high active surface area, quantum confinement, larger band gap and high chemical (thermal) stability. Due to these properties, SnO2 finds itself in many applications which include gas sensors, photocatalysts, medicines, field emission displays, photo-sensors, antistatic coatings, electrodes in lithium-ion batteries and solar cells, etc [1–5]. Dimension of these NPs is a significant aspect from the application point of view. Among various synthesis techniques, hydrothermal process offers a viable and attractive option to researchers as it adopts simple operation, low cost, easily processable and environment friendly strategy.
Like varying the experimental parameters, doping is considered as an important strategy to tune the optical and electrical properties of NPs to suit their use for any particular application. A large amount of research may be found to be devoted to modifying its optical absorption properties for use as photocatalyst. This is achieved by substituting elements or by controlling nanoparticle size and morphology or by causing internal strain within materials. Doping metal cations in SnO2 was established to be a successful strategy to enhance the response towards visible light region and obstruct charge carrier recombination. A wide range of metal ions like Mn [6], Co [7], Ni [8], Cu [9], Zn [10], Sb [11], Bi [12] and Ce [13], etc are investigated as dopants in SnO2 for their suitability towards degradation of hazardous dye molecules present in waste water released from food, paper, textile and leather tanning industries, etc This waste water treatment process has advantages over other processes like biodegradation, physical adsorption and reverse osmosis. These methods involve incomplete degradation of dye molecules and may lead to producing secondary pollutants in waste water.
This study reports a simple template-free hydrothermal method to synthesise undoped and 5 wt% Ni doped SnO2 nanoparticles (SnO2:Ni NPs). Further, a low valence cation e.g. Ni in SnO2 creates a defect state having energy 0.26 eV below the conduction band and it acts as an electron trap by virtue of which it may hinder the recombination process of photogenerated electron–hole pairs. This is a condition essential for realisation of enhanced photocatalytic activity in nanoparticles. At the same time, although radius of Ni2+ ion is the same as that of Sn4+ ion, the formation of defects is expected in the host lattice SnO2 at 5 wt% Ni doping concentration as it approaches the solubility limit [14]. However, there is still lack of complete understanding about the effect of defects on photocatalytic activity. So, there is continuous effort to understand photocatalytic applicability of SnO2 over last few years [15, 16]. This study is an attempt in this direction to find an answer by analysing the properties of samples with the help of some basic, but essential techniques such as x-ray diffraction (XRD), field emission scanning electron microscopy (FESEM), transmission electron microscopy (TEM), UV-visible spectroscopy, x-ray photoelectron spectroscopy (XPS) and micro-Raman spectroscopy. These techniques are widely accepted essential tools for the characterisation of nanosized materials to probe crystalline phase, size, strain and lattice defects, etc in solids. The synthesised NPs are expected to offer their suitability for many potential applications. In this study, the photocatalytic activity of SnO2 NPs is investigated towards degradation of Rhodamine B (RhB) solution.
2. Materials and methodology
Tin oxide nanocrystalline powders were synthesised by hydrothermal method [17]. All chemicals taken were of analytical grade and used without further purification. 2.707 gm (0.15 M) SnCl2
 2H2O and 7.2072 gm (1.5 M) urea were dissolved in 80 ml distilled water and stirred for 0.5 h. The suspension solution was then heated in an autoclave at 150 °C for 24 h. The precipitate obtained was washed with distilled water and harvested by processing with several centrifugation and re-dispersion cycles [18]. The product was sintered at 700 °C for 7 h in air to produce SnO2. To prepare Ni doped SnO2 sample, requisite amount of nickel acetate was added to the precursor solution to obtain 5 wt% with respect to Tin in the final solution and followed the same procedure as in case of SnO2.
The phase of the samples was determined by XRD (Rikagu, Ultima IV) using CuKα radiation (λ = 1.54056 Å) and scanning 2θ at the rate of 2° min−1 in the range 5°–80°. The surface morphology was investigated using FESEM (Zeiss, Gemini 300). Chemical composition of the samples was analysed qualitatively using energy dispersive x-ray analysis (EDAX). The nanoparticles are further probed for their internal crystalline structure by TEM (JEOL JEM 2100 PLUS) operating at 200 kV. Optical absorbance spectra were recorded in the wavelength range 200–800 nm using a UV–vis spectrophotometer (Cary Win 300 UV–vis). For this purpose, 10 μM solutions were prepared by dispersing each sample in ethanol. Raman measurement was carried out in the range of 350–1000 cm−1 using a micro-Raman spectrometer (Horiba) with 532 nm laser excitation.
The surface chemical-state compositions of the nanostructures were analysed by XPS in a Thermo-VG Scientific ESCALab 250 microprobe with a monochromatic Al Kα x-ray source (1486.6 eV), operated with a typical energy resolution of 0.4−0.5 full width at half-maximum.
The photocatalytic activity was accounted by degrading the Rhodamine B solution. For this purpose, 0.25 g of SnO2 NPs was mixed with 20 ppm of Rhodamine B and the resulting solution was stirred under UV illumination of peak wavelength 365 nm. The sample was measured for optical absorbance at intervals of 10 min till complete degradation of Rhodamine B solution occurred.
3. Results and discussions
3.1. X-ray diffraction
Figure 1 shows the XRD patterns of the SnO2 and Ni doped SnO2 NPs. Both the NPs are crystalline and showed many sharp Bragg diffraction peaks. The dominant peaks for the SnO2 are observed at 2θ = 26.43° and 2θ = 33.88° which are assigned respectively to the (110) and (101) planes of the rutile-type cassiterite phase of SnO2 (JCPDS card No. 71–0652). Also, the two diffraction patterns showed other prominent peaks of lower intensity, which are identified according to standard patterns [19]. Further, phase purity of the synthesised samples was investigated by Rietveld refinement of SnO2 and 5 wt% Ni doped SnO2 NPs. The refinement was done using FULLPROF software [20]. Rietveld refined XRD patterns indicate formation of single phase having tetragonal crystal structure with space group 'P42/m n m'. The fitting parameters obtained after structural refinement are depicted in table 1. The goodness of fit (χ2) for SnO2 and 5 wt% Ni doped SnO2 was found to be 3.41 and 4.40 respectively. This indicates a good agreement between the observed and refined patterns for the samples. Moreover, as compared to the parent sample (SnO2), a decrease in lattice parameters in 5 wt% Ni doped SnO2 is observed with the shifting of dominant peaks i.e. 2θ = 26.43° and 33.88° to higher values. For brevity, the peak at 2θ = 26.43° is shown as inset in figure 2. This feature could be due to the lower ionic radii of Ni2+ ion substituting the higher ionic radii of Sn4+ ion.
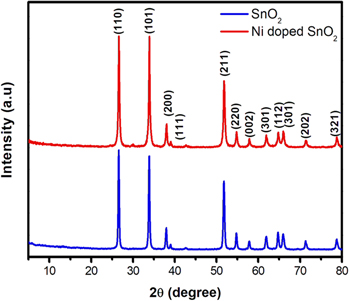
Figure 1. X-ray diffraction patterns of SnO2 and 5 wt% Ni doped SnO2 NPs.
Download figure:
Standard image High-resolution imageTable 1. Crystal structure parameters of SnO2 and 5 wt% Ni doped SnO2 nanoparticles.
| Samples | SnO2 | 5 wt% Ni doped SnO2 |
|---|---|---|
| Space group | P42/m n m | P42/m n m |
| Lattice parameters | ||
| a (Å) = b (Å) | 4.74071(5) | 4.73607(13) |
| c (Å) | 3.18839(9) | 3.18540(7) |
| Cell volume (Å3) | 71.65693(9) | 71.44966(8) |
| R-factors (%) | ||
| Rp | 11.5 | 13.4 |
| Rwp | 14.6 | 16.7 |
| χ2 | 3.41 | 4.40 |
| <Sn-O>avg | 2.062 Å | 2.058 Å |

Figure 2. Rietveld refinement of x-ray diffraction patterns of SnO2 and 5 wt% Ni doped SnO2 NPs.
Download figure:
Standard image High-resolution imageThe crystallite size and strain in both samples were determined using Williamson-Hall plot [21]. Crystallite size was found to be 39 nm in SnO2 and 35 nm in Ni doped SnO2 samples. Similarly, lattice strain was determined to be 3.56 × 10⁻³ in SnO2 and 3.99 × 10⁻³ in Ni doped SnO2 samples. So it may be noticed that crystallite size decreases with 5 wt% Ni doping. Though both Ni2+ and Sn4+ have comparable ionic radii, the slight decrease in crystallite size may be attributed to formation of Ni-O-Sn. It has been reported that when Ni2+ ions replace Sn4+ ions, crystal defects are formed in the crystal lattice which leads to generation of oxygen vacancies (VO ) [22].
3.2. Electron microscopy
Figure 3 shows the FESEM images of SnO2 and Ni doped SnO2 NPs recorded at similar operating conditions. In SnO2, spherical NPs are formed which are embedded in hollow tubular microstructures. But, in Ni doped SnO2, the shape of NPs is elongated and irregular. It is also supported in TEM observation (figure 4). The morphology and internal crystallinity of the constituent nanoparticles are also probed by transmission electron microscope. The dark field images and corresponding selected area electron diffraction (SAED) patterns are represented in figure 4. Both samples indicate polycrystalline nature in their SAED patterns. Concentric rings corresponding to lattice planes (110), (101), (200) and (211) as depicted in XRD analysis are drawn in SAED patterns of both samples. More number of bright diffraction spots in SAED pattern of Ni doped SnO2 shows improved crystallinity compared to undoped NPs.
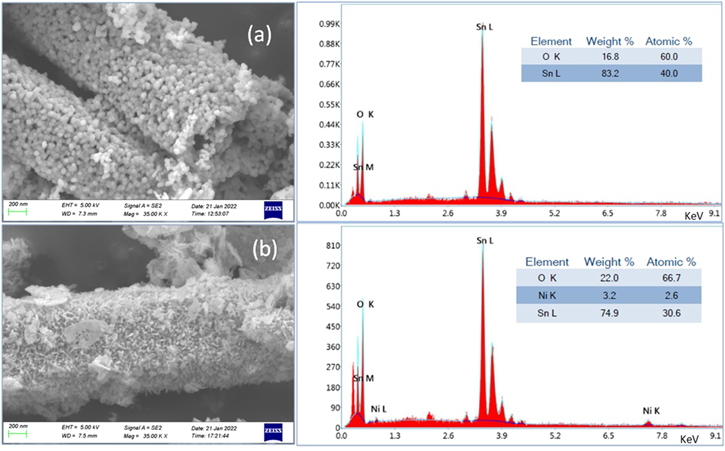
Figure 3. FESEM images and EDAX spectra of (a) SnO2 and (b) 5 wt% Ni doped SnO2 NPs.
Download figure:
Standard image High-resolution image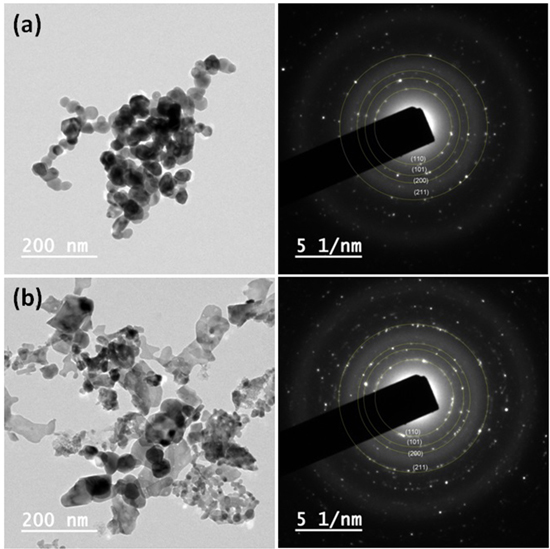
Figure 4. Transmission electron microscopic views of (a) SnO2 and (b) 5 wt% Ni doped SnO2 NPs. Corresponding SAED patterns on the right hand side.
Download figure:
Standard image High-resolution imageBesides microscopic characterisation, for finding the purity or contents of materials in the prepared sample, EDAX spectra were recorded as depicted in figure 3. The two most intense peaks corresponding to SnLα and OKα in the NPs confirm the SnO2 phase. NiKα line in the doped sample depicts the presence of Ni. The atomic % and weight % calculated by the EDAX analytic software are shown as inset in the EDAX spectrum figures. Although, EDAX poses a qualitative approach and does not reflect the true values about the concentration of various elements present in the samples, still it may be inferred that SnO2 is Sn rich [Sn/O = 0.666], whereas almost stoichiometry is maintained in Ni doped SnO2 sample [(Sn+Ni)/O = 0.497]. It may also be said that Ni is incorporated in the SnO2 host at Sn sites and has significant influence on the structural properties.
At normal condition, four significant point defects exist in SnO2, i.e. oxygen vacancies (VO ), tin vacancies (VSn ), oxygen interstitials (Oi ) and tin interstitials (Sni ). Among these, VO and Sni are major defects as they are donor defects and contribute to the n-type intrinsic conductivity of SnO2. Further, VO has lowest formation energy, thereby becoming dominant donor defect in SnO2 [23]. This is also verified experimentally [24, 25]. However, presence of Sni states cannot be ruled out. If formation of oxygen vacancies is considered to be promoted in Ni doped samples [22], then higher oxygen content in Ni doped sample is attributed to chemisorptions of free oxygen molecules at the surface sites of nanoparticles as discussed later.
3.3. Optical absorption
The absorbance spectra and optical band gap for SnO2 are shown in figure 5(a). Better transparency is found to be possessed by Ni doped SnO2 NPs compared to SnO2 NPs. This can be attributed to the higher oxygen content in the doped sample as found from its EDAX spectrum. As SnO2 has direct band gap (Eg ), it is determined by extrapolating the linear part of the (αhν)2 versus hν plot (known as Tauc plot) to energy hν axis [26]. Accordingly, it is found to be 3.97 eV and 4.11 eV for SnO2 and Ni doped SnO2 respectively [figure 5(b)], which are higher than the reported value of bulk SnO2, i.e. 3.6 eV. Band gap of a material strongly depends on the size, strain and carrier concentration. There are many reports that indicate band gap narrowing in SnO2 upon Ni doping [27, 28]. Band gap shrinkage is explained on the basis of many body effects like electron–electron interactions and electron-impurity interactions. In this study, we observed slight increase in band gap of SnO2 with 5 wt% Ni doping. Usually, widening of band gap energy is ascribed to Burstein–Moss effect [29]. Non-stoichiometric SnO2 has n-type electrical conductivity. Ni substitution at Sn sites may lessen the carrier concentration. However, there may be a net increase in carrier concentration owing to other defects like oxygen vacancies in Ni doped SnO2 NPs, thereby populating the bottom states of conduction band. Thus, transition of electrons to bottom states of conduction band is blocked. This may be the reason for observed higher optical band gap in case of doped sample.
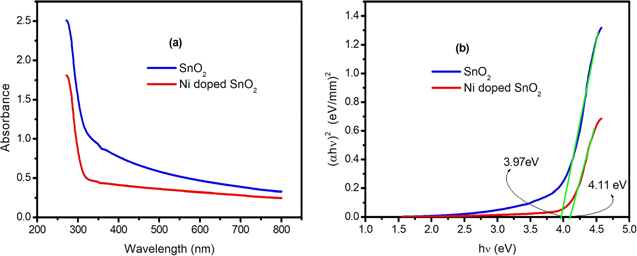
Figure 5. (a) Optical absorbance spectra and (b) corresponding Tauc plots for SnO2 and 5 wt% Ni doped SnO2 NPs.
Download figure:
Standard image High-resolution image3.4. Micro-Raman spectroscopy
SnO2 NPs were also investigated by micro-Raman spectroscopy [figure 6]. The dominant peak is observed at 634 cm−1. It further confirms the purity of the rutile SnO2 samples. Rutile SnO2 belongs to the space group  comprising two SnO2 units. There are two metal atoms and four oxygen atoms in the unit cell. According to Diéguez et al [30], the different phonon modes of the SnO2 at the Brillouin zone are given by the following expression.

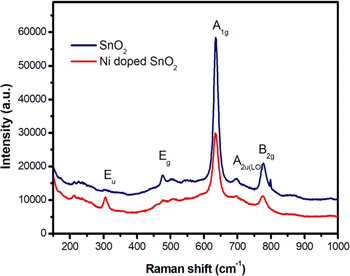
Figure 6. Micro-Raman spectra of SnO2 and 5 wt% Ni doped SnO2 NPs at room temperature (λexc = 532 nm).
Download figure:
Standard image High-resolution imageAmong these, Raman active modes are the non-degenerated A1g , B1g and B2g and the doubly degenerated Eg mode. Eu and A2g modes are IR active modes. It may be noticed that the Eu mode has become Raman active in Ni doped SnO2. The peak located at 634 cm−1, as seen in figure 6, is attributed to the SnO2 characteristic Raman mode A1g. This mode is related to the expansion and contraction of Sn-O bond. Raman peaks at 474 cm−1, 690 cm−1 and 774 cm−1 correspond to the Eg , A2u(LO) and B2g vibration modes respectively [30–32], where the subscript LO in A2u(LO) stands for longitudinal optical phonon mode. The Eg mode is observed due to vibration of two oxygen atoms parallel to c-axis, but in opposite direction. Therefore, this mode may be more sensitive to oxygen vacancies than other modes. The absence of Eg mode in Ni doped SnO2 may indicate very high oxygen vacancy concentration in it.
3.5. X-ray photoelectron spectroscopy
XPS analysis of the pure SnO2 and Ni doped SnO2 samples was carried out to study the surface chemical states of the elements. The data is represented in figure 7. The profile peak fitting of the XPS spectra is done after subtracting Shirley background. Part of the profile fitting is done by the Gaussian function and part by the Voigt function using OriginPro-2021 software. The C 1 s spectrum at 284.8 eV was used as a reference for calibration. The analysis confirms the presence of C, O, Sn and C, O, Sn, Ni in the pure SnO2 nanoparticles and Ni-doped SnO2 nanoparticles respectively. The XPS C1s spectra feature the following bands: non-oxygenated ring C–C (∼284.88 eV), C–O (∼286.35 eV), C=O (∼288.50 eV) in both pure SnO2 and Ni-doped SnO2 [33]. The difference in area percentage of C 1 s between both the samples may be caused due to the doping effect.

Figure 7. High resolution XPS deconvoluted spectra (a-d) for pure SnO2 and (e-h) for 5 wt% Ni doped SnO2 nanoparticles.
Download figure:
Standard image High-resolution imageThe high-resolution O 1 s spectra for pure SnO2 and Ni-doped SnO2 nanoparticles are deconvoluted into two major bands as shown in figures 7(b) and (f) respectively. These peaks correspond to binding energies of 530.41 eV (Metal-Oxygen), 531.45 eV (Oxygen defect) in pure SnO2 and 530.26 eV (Metal-Oxygen), 531.10 eV (Oxygen defect) in Ni-doped SnO2 [34]. The higher binding energy component peak increases in Ni-doped SnO2 sample. This component corresponds to oxygen defect sites with low oxygen coordination. Thus it can be inferred that the oxygen vacancy concentration increases in the SnO2 nanoparticles when Ni is present due to the charge imbalance between Sn4+ and Ni2+. This leads to chemisorptions of a large number of free oxygen molecules on the nanoparticle surface [35]. This may be the reason for which the EDAX analysis shows higher oxygen content in Ni doped SnO2 sample. These chemisorbed oxygen molecules may take part in the photocatalytic activity which is explained later.
The presence of Ni was confirmed by the high resolution XPS Ni 2p spectrum [figure 7(g)] of Ni-doped SnO2 nanoparticle sample. Two typical peaks at ∼855.80 eV and 874.00 eV can be attributed to Ni 2p3/2 and Ni 2p1/2 respectively, and two other peaks at 861.41 eV and 880.35 eV as satellite peaks [36]. The fitted peaks at 855.85 eV and 873.10 eV correspond to Ni2+, whereas the peaks at 856.31 eV and 874.01 eV are ascribed to Ni3+ [37]. In figure 7(c), it is clearly seen that component for Ni 2p is absent in pure SnO2 for obvious reasons.
The Sn 3d spectrum [figure 7(d)] exhibits spin–orbit doublet peaks at ∼486.59 eV (Sn4+ 3d5/2) and ∼495.02 eV (Sn4+ 3d3/2) for pure SnO2. The same [figure 7(h)] is also for Ni-doped SnO2 at ∼486.40 eV (Sn4+ 3d5/2) and ∼494.82 eV (Sn4+ 3d3/2). spin–orbit splitting (Δ = 8.42 eV) of doublet lines for Sn 3d spectrum confirms the presence of Sn4+ state [38]. For Ni doped SnO2, these peaks are slightly shifted to lower binding energies which may be due to the presence of Ni ions in SnO2.
3.6. Photocatalytic activity
The absorbance spectra of Rhodamine B solution were recorded from 400 nm to 650 nm as shown in figure 8. The surface plasmon resonance (SPR) band for Rhodamine B dye was recorded in 553 nm. The falling intensity shows the degradation of the solution with time due to presence of NPs. It may be noticed that the SPR band at 550 nm takes 100 min to disappear in presence of Ni doped SnO2 NPs whereas the band can be still observed after the same time in case of undoped SnO2 nanoparticles [figures 8(a)–(b)]. It took 130 min to disappear completely in case of undoped SnO2 nanoparticles (not shown in figure). Thus, it indicates that the synthesised SnO2 NPs are good catalysts whereas Ni doping makes it better. It may also be seen that the band position is more red-shifted to a greater extent in case of Ni doped SnO2 nanoparticles.
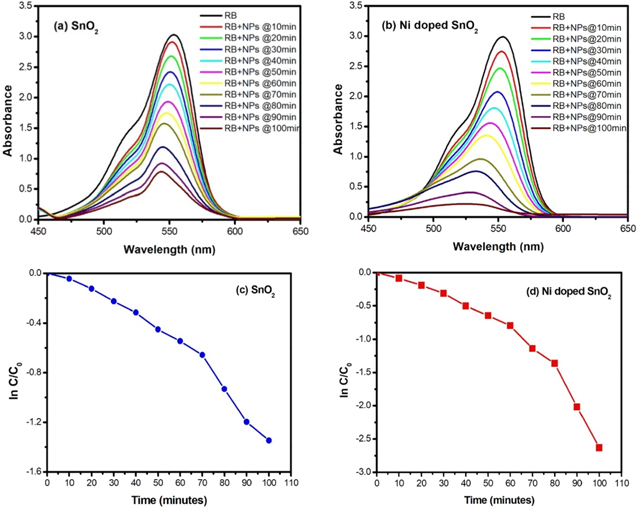
Figure 8. Absorbance spectra of Rhodamine B solution over (a) SnO2 and (b) 5 wt% Ni doped SnO2 NPs respectively; (c), (d) corresponding photocatalytic pseudo-first-order kinetics respectively.
Download figure:
Standard image High-resolution imageIn order to obtain the accurate kinetic data of the Rhodamine B degradation, rate constant (k) was calculated by first order kinetic reaction equation given by  where C0 and C are respectively the initial and final concentration of Rhodamine B solution after time
t
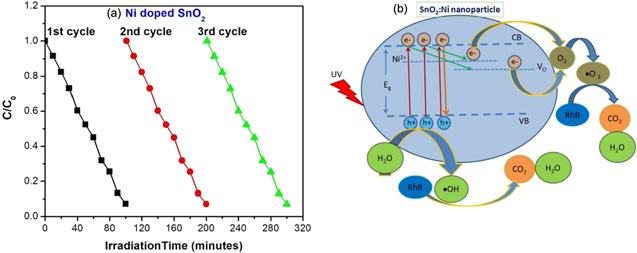
. Depending on the nature of the plots in figures 8(c)–(d), the data set is divided into two time ranges to calculate rate constant, i.e. 0–60 min and 60–100 min The values are found to be 0.009 min−1 up to 60 min and 0.021 min−1 after 60 min in case of undoped SnO2. These values increase to 0.014 min−1 and 0.045 min−1 in case of doped sample. Stability or repeated usability of the catalyst bears importance similar to enhancement of photocatalytic activity of the nanoparticles for practical applications. To know the stability of Ni doped SnO2, photocatalytic experiment, i.e. degradation of Rhodamine B under UV visible light, was performed for three cycles under the same conditions. The graph was plotted between irradiation time and RhB degradation as shown in figure 9(a). It depicts good stability of the Ni doped SnO2 nanoparticle which means that it can be potential photocatalytic material for industrial waste water treatment. The slight decrease in activity observed after each cycle may be due to incomplete collection of the photocatalytic material [12].
where C0 and C are respectively the initial and final concentration of Rhodamine B solution after time
t
. Depending on the nature of the plots in figures 8(c)–(d), the data set is divided into two time ranges to calculate rate constant, i.e. 0–60 min and 60–100 min The values are found to be 0.009 min−1 up to 60 min and 0.021 min−1 after 60 min in case of undoped SnO2. These values increase to 0.014 min−1 and 0.045 min−1 in case of doped sample. Stability or repeated usability of the catalyst bears importance similar to enhancement of photocatalytic activity of the nanoparticles for practical applications. To know the stability of Ni doped SnO2, photocatalytic experiment, i.e. degradation of Rhodamine B under UV visible light, was performed for three cycles under the same conditions. The graph was plotted between irradiation time and RhB degradation as shown in figure 9(a). It depicts good stability of the Ni doped SnO2 nanoparticle which means that it can be potential photocatalytic material for industrial waste water treatment. The slight decrease in activity observed after each cycle may be due to incomplete collection of the photocatalytic material [12].
Figure 9. (a) The recycling performance of 5 wt% Ni doped SnO2 by RhB degradation under UV irradiation, (b) Schematic representation of the photocatalytic activity of Ni doped SnO2 nanoparticle to degrade RhB dye molecules.
Download figure:
Standard image High-resolution image
In general, photocatalytic mechanism can be explained based on the generation of electron–hole pairs in NPs under illumination which interact with the dye molecules adsorbed on the NPs surface. This interaction leads to the generation of reactive oxygen species which cause breaking of the dye molecules [39]. The superior photocatalytic activity of Ni doped SnO2 NPs has been attributed to the charge separation process facilitated by Ni2+ ions by inducing a defect state (0.26 eV) below the conduction band. Kumar et al observed suppression of electron hole recombination process in Ni doped ZnO enhancing its degradation efficiency [40]. Le et al [12] have proposed a mechanism in which both photogenerated electrons ( ) and holes (
 ) get involved in a series of reactions with adsorbed oxygen and water molecules to form
  and
and  radicals. The reactions are given as follows.


The  and
and  radicals react with the RhB molecule (cationic dye molecule) and break it (degradation) to form CO2 and H2O.
As explained in earlier reports [41], Ni is localised at the surface sites of nanoparticles and gets oxidised by surrounding SnO2 nanoparticles. In this study, XPS analysis reveals the fact that Ni promotes formation of oxygen vacancies in lattice and then chemisorption of oxygen/water molecules at nanoparticle surface as confirmed by EDX analysis. Further, Ni substituted at Sn sites is expected to lower the electron density in SnO2 nanoparticle. Hence, the improved photocatalytic activity may be preferably ascribed to the increase in oxygen vacancy concentration and hole concentration. Under UV irradiation, the hole concentration may increase further and some of the photogenerated electrons may be trapped by defects due to Ni2+ and Vo preventing recombination with holes. The holes may be taking part in the degradation process of RhB molecule as proposed by Le et al [12]. As shown schematically in figure 9(b), electrons are excited from valence band (VB) to conduction band (CB), when the nanoparticle is irradiated with UV light. Some electrons are lost due to recombination with holes. Transition of electrons from conduction band to Ni2+ and VO states may be taking place, followed by migration to adsorbed oxygen molecules and subsequently,  radicals are formed which then react with RhB dye molecules.
4. Conclusions
The structural, optical and photocatalytic properties of SnO2 and SnO2:Ni NPs were probed in this work. The NPs were successfully synthesised by following a simple, template-free procedure using hydrothermal method. XRD analysis confirmed the crystalline nature of these NPs having rutile-type cassiterite phase of SnO2. Further, Rietveld refined XRD patterns supported single phase tetragonal crystal structure having space group P42/m n m. The decrease in lattice parameters and crystallite size was observed in Ni doped SnO2 with an opposite trend in lattice strain values. This is attributed to the substitution of Sn4+ ions by Ni2+ ions in the host lattice. FESEM and TEM results showed regular spherical shape of nanoparticles (arranged in hollow tubular form) and irregular elongated shapes in case of SnO2 and Ni doped SnO2 NPs respectively. The optical absorption properties were investigated with the help of UV–vis spectrophotometer. The direct optical band gap (Eg ) was determined to be 3.97 eV for SnO2 and 4.11 eV for SnO2:Ni NPs from their Tauc plots. The higher band gap for doped NPs is explained on the basis of Burstein–Moss effect. Raman spectroscopy also confirmed the formation of rutile-type cassiterite phase of SnO2. Peaks are observed at 474 cm−1, 634 cm−1, 690 cm−1 and 774 cm−1 corresponding to the Eg , A1g , A2u(LO) and B2g vibration modes respectively. The peak at 634 cm−1 is the characteristic A1g Raman mode of SnO2 related to expansion and contraction of Sn-O bond. XPS data analysis showed significant increase of oxygen vacancy concentration in the SnO2:Ni NPs due to the charge imbalance between Sn4+ and Ni2+. The increase of oxygen vacancy concentration led to chemisorptions of more free oxygen molecules on the nanoparticle surface. The photocatalytic efficiency of the SnO2:Ni NPs was found to be considerably higher than that of pure SnO2 NPs. The observed high photocatalytic activity in SnO2:Ni NPs under UV irradiation is attributed to generation of electron–hole pairs in NPs and the charge separation process facilitated by Ni2+ ions and VO defects. We observed a dominant red shift in band position in case of Ni doped SnO2 NPs. Due to the fact that Ni doped SnO2 NPs depict faster response to degrade RhB dye molecules compared to SnO2 NPs, it may be inferred that Ni doped SnO2 NPs are better catalysts than undoped SnO2 NPs for the purpose of waste water treatment in industries.
Acknowledgments
The authors gratefully acknowledge the help from Department of Geology towards XRD analysis and the financial help from Centre of Excellence for Env. Pub. Health, Ravenshaw University, Cuttack, India under OHEPEE (26913/HED/HE-PTC-WB-02-17) by Government of Odisha.