

Abstract
Exhaled breath and gastric-endoluminal gas (volatile products of diseased tissues) contain a large number of volatile organic compounds, which are valuable for early diagnosis of upper gastrointestinal (UGI) cancer. In this study, exhaled breath and gastric-endoluminal gas of patients with UGI cancer and benign disease were analyzed by gas chromatography-mass spectrometry (GC-MS) and ultraviolet photoionization time-of-flight mass spectrometry (UVP-TOFMS) to construct UGI cancer diagnostic models. Breath samples of 116 UGI cancer and 77 benign disease subjects and gastric-endoluminal gas samples of 114 UGI cancer and 76 benign disease subjects were collected. Machine learning (ML) algorithms were used to construct UGI cancer diagnostic models. Classification models based on exhaled breath for distinguishing UGI cancer from the benign group have area under the curve (AUC) of receiver operating characteristic curve values of 0.959 and 0.994 corresponding to GC-MS and UVP-TOFMS analysis, respectively. The AUC values of models based on gastric-endoluminal gas for UGI cancer and benign group classification are 0.935 and 0.929 corresponding to GC-MS and UVP-TOFMS analysis, respectively. This work indicates that volatolomics analysis of exhaled breath and gastric-endoluminal diseased tissues have great potential in early screening of UGI cancer. Moreover, gastric-endoluminal gas can be a means of gas biopsy to provide auxiliary information for the examination of tissue lesions during gastroscopy.
Export citation and abstract BibTeX RIS
Abbreviation
| VOCs | volatile organic compounds |
| UGI | upper gastrointestinal |
| GC-MS | chromatography-mass spectrometry |
| UVP-TOFMS | ultraviolet photoionization time-of-flight mass spectrometry |
| ROC | receiver operating characteristic curve |
| AUC | area under curve |
| RF | random forest |
| XGB | extreme gradient boosting |
| LDA | linear discriminant analysis |
| SVM | support vector machine |
| CI | confidence interval |
1. Introduction
The number of deaths due to UGI cancer (including esophageal and gastric cancer) in 2020 was about 1.313 million, second only to lung cancer with the most deaths [1]. Since early UGI cancer had few or no specific symptoms, nearly 80% of patients had progressed to the advanced stage by the time of diagnosis [2]. The 5 years survival rate was less than 35% due to late diagnosis and rapid deterioration of the disease [2]. In Japan and Korea, where national early UGI cancer screening was implemented, with the proportion of early diagnosis accounting for 60% [3], the 5 years survival rate could reach 90% after effective treatments [4, 5]. Therefore, early diagnosis and treatment are keys to effectively improving the survival rate of UGI cancer patients.
Currently, the commonly used diagnostic methods include imaging examination, serological examination, and electronic endoscopy with pathological diagnosis of biopsy [6]. Imaging examination is not suitable for early diagnosis because of its radioactivity, poor sensitivity, and tendency to miss small lesions [7]. The sensitivity and specificity of serological markers are ordinary for UGI cancer diagnosis [8, 9]. Endoscopy with biopsy is the golden standard for the diagnosis of esophagogastric cancer. It is not recommended for large-scale screening on account of the disadvantages of invasiveness, low patient compliance, and the need for experienced physicians [10, 11]. Accordingly, it is imperative to find a non-invasive, highly sensitive, and convenient diagnostic method.
Exhaled breath analysis has received extensive attention in the field of disease diagnosis because of its advantages of non-invasiveness, low cost, convenience, and high universality [12, 13]. Amal et al [14] used cross-reactive nanoarrays to analyze the exhaled breath of 484 patients (including 99 gastric cancer patients). They distinguished between gastric cancer and precancerous lesions patients with 73% sensitivity, 98% specificity, and 92% accuracy. Kumar et al [15] employed selected ion flow tube mass spectrometry to analyze 29 VOCs in exhaled breath of 210 subjects. The accuracy of the classification model for distinguishing esophageal and gastric adenocarcinoma from noncancer controls was 86.0%. Jung et al [16] analyzed the exhaled breath of 26 gastric cancer patients and 17 controls by real-time proton transfer reaction mass spectrometry. A prediction model was constructed based on four significantly elevated VOCs in gastric cancer patients. The model showed the highest AUC of 0.842 with 61% sensitivity and 94% specificity. Although exhaled breath analysis has great potential, its clinical application is limited by the insufficient understanding of sources, behaviors, and metabolic pathways of VOCs in exhaled breath [17, 18]. By analyzing the volatile components from different sources within the same individual, that is, individual volatolomics analysis, complementary information can be obtained to assist in explaining the source and metabolic pathway of VOCs [19]. Gastric-endoluminal gas is secreted directly by the cancer cells and diseased tissues [20]. Simultaneous analysis of the exhaled breath and gastric-endoluminal gas within the same patient can assist in determining the source of VOCs in exhaled breath [20].
GC-MS is one of the most frequently used tools for qualitative and quantitative analysis of unknown compounds in complex exhaled breath samples [21]. Tedious sample pretreatment and time-consuming analysis process limit the application of GC-MS in clinical disease screening [22]. UVP-TOFMS is a promising exhaled breath analysis tool with the advantages of fast analysis, high sensitivity, and no sample preconcentration [23]. By analyzing VOCs in exhaled breath, UVP-TOFMS has been used in the diagnosis of COVID-19 [24], lung cancer [25], and esophageal cancer [26]. The UVP-TOFMS consisted of a vacuum ultraviolet lamp ion source, a radio-frequency quadrupole ion guide, and an orthogonal acceleration time-of-flight mass analyzer. A direct current Kr lamp as the ion source produced photons with energy of 10.6 eV for components ionization. The ionized components were transferred to the TOF mass analyzer by radio frequency quadrupole for analysis. The structure diagram of UVP-TOFMS is shown in supplementary figure 1.
In this study, exhaled breath and gastric-endoluminal gas of patients with UGI cancer and benign disease were simultaneously analyzed by GC-MS and UVP-TOFMS. Four machine learning (ML) algorithms were used to construct classification models for distinguishing UGI cancer and benign. The metabolic mechanism of significant biomarkers in exhaled breath and gastric-endoluminal gas and their association with UGI cancer were discussed.
2. Methods
2.1. UGI patients and benign subjects
This study was approved by the Ethics Committee on Biomedical Research, West China Hospital of Sichuan University (No. 858, 2021). All subjects were from West China Hospital of Sichuan University and signed informed consent forms. Patients with biopsy-confirmed esophageal cancer, gastric cancer, and benign disease (including gastritis, esophagitis, and stromal tumor) were included in this study. Inclusion criteria were as follows: (1) older than 18 years old, (2) no history of malignancy in the last five years and no anticancer therapy, (3) no ongoing infections, and (4) no signs of liver or renal malfunction. Demographic information was provided in supplementary table 1. All the gas samples were collected from 1 October 2021, to 1 March 2022. All subjects were required to hold a 24 h nucleic acid negative certificate at sampling. Researchers wore masks and medical gloves throughout the sampling and analysis process. After sample analysis, all samples were disinfected with ultraviolet lamps. The study design flow can be seen in supplementary figure 2.
2.2. Sample collection
The collection of gas samples was performed by well-trained researchers following the same protocol. All subjects were required to fast for at least 8 h before sample collection and refrain from smoking, drinking, or eating spicy foods the day before sampling. For possible pollution monitoring, environmental air was collected in parallel (supplementary table 2).
Exhaled breath was collected before the UGI endoscopy. Exhaled breath collection was carried out by a Bio-VOC breath sampler (Markes Int. U.K) and a disposable mouthpiece. Subjects were required to exhale slightly into the Bio-VOC sampler until they felt resistance in their lungs. The dead-space air was discharged through a three-way valve, and the end-tidal gas was retained and transferred into a Tedlar bag (500 ml, Dalian Delin Gas Packing Co., Ltd, China). Each subject was sampled five times to collect about 450 ml of breath (figure 1).
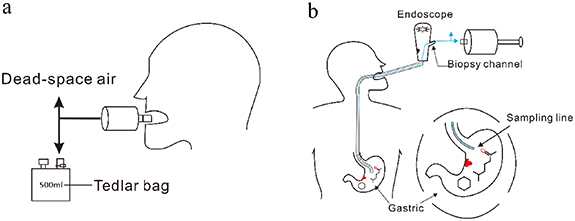
Figure 1. (a) Sampling of end-tail breath via Bio-VOC sampler. (b) Sampling of gastric-endoluminal gas via a suction channel of a standard endoscope with a disposable medical pressure extension tube.
Download figure:
Standard image High-resolution imageGastric-endoluminal gas was collected during the UGI endoscopy. A disposable medical pressure extension tube was inserted into the gastric endoluminal through the biopsy channel of a standard endoscope. The outer end of the tube was directly connected to the Bio-VOC sampler, and the inner end of the tube extended into the gastric cavity. During collection, the gas in the gastric cavity was directly extracted using the Bio-VOC sampler and then transferred into a Tedlar bag (500 ml, Dalian Delin Gas Packing Co., Ltd, China). Each subject was also sampled five times, and the total gas volume was about 450 ml (figure 1). The background analysis of the tube was performed by using a Tedlar bag filled with pure synthetic air as the gastric cavity. Then, using the same sampling process, the gas in the Tedlar bag was extracted by Bio-VOC sampler and transferred into a new Tedlar bag for analysis. After testing, it was found that there was no background interference in the tube. All samples were sent to the laboratory instantly after sampling and analyzed within the same day.
2.3. Sample analysis by GC-MS and UVP-TOFMS
Two kinds of gas samples, exhaled breath gas and gastric-endoluminal gas, were collected from each subject and analyzed by two methods. Firstly, gas samples were directly analyzed by UVP-TOFMS (Aliben science and technology Co., Ltd, Chengdu, China). Gas samples were introduced into the ionization chamber through a PEEK capillary (i. d. 2.10 mm, length 0.50 m). The temperature of the capillary and the ion source was 70 °C. The pressure of the ion source was about 500 Pa, which allowed the sample to be automatically inhaled and then ionized in the ion source. The TOF signal acquisition and accumulation were completed by a 1 GS s−1 analog-to-digital converter, and the acquisition frequency was 20 kHz. Mass spectra were accumulated for 50 s for each sample analysis.
Then further analysis was performed on a Thermo Scientific TRACE 1300 GC system coupled with a TSQ 8000 triple quadrupole system. For analysis of trace VOCs in exhaled breath and gastric-endoluminal gas, a solid-phase microextraction (SPME) device with a divinylbenzene/carboxen/polydimethylsiloxane fiber was used to enrich at 37 °C for 30 min before analysis. Before each batch of sample analysis, the SPME fiber was desorbed at the injection port at 270 °C for 5 min to remove the residual compounds on the fiber. A medium polarity capillary column VF-624 (60 m × 0.25 mm × 1.4 μm) was used to separate VOCs. The GC carrier gas was high-purity helium (99.999%), and the constant flow rate was 1 ml min−1 with a split ratio of 5:1. The oven temperature programs were set as follows: initial 40 °C, held for 5 min, then ramped at 10 °C min−1–160 °C, next ramped at 5 °C min−1–200 °C, and last ramped at 10 °C min−1–220 °C. The MS worked in full scan mode with a mass range of m/z 30–350 and a scan rate of 0.5 scan s−1. The temperature of the ion source and MS transfer line was 250 °C, and the ionization energy of the ion source was 70 eV.
2.4. Data processing
The original data obtained by UVP-TOFMS analysis went through peak identification, integration, and alignment to obtain data matrices containing sample ID and peak (m/z) area. Peak identification was accomplished by our previously developed peak detection algorithm based on wavelet transform and image segmentation [27], and the peak integration was completed with the Monte Carlo method. Peaks (m/z) with missing values greater than 40% in all samples were removed, and peaks with m/z > 200 and m/z < 30 were also removed because of low intensity. The raw data of GC-MS analysis was imported into TraceFinderTM (5.0, Thermo Fisher, USA) for deconvolution and peak alignment. The data matrix containing retention time, sample ID, and corresponding peak areas was obtained after processing. Pollutants were excluded from the gas sample analysis (supplementary table 2). Compounds were tentatively identified by searching in NIST 17, and the match probability was required to be greater than 80%. Then, the identity was confirmed by analyzing the standard if available.
After obtaining the data matrix for classification model construction, the KNNImputer algorithm was used to fill in the missing values. And data were pre-processed by the StandardScaler algorithm to get a normalized form. Then, RF, XGB, SVM, and LDA were employed as classifiers for model construction. The recursive feature elimination algorithm was used to select the optimal feature subset for models. The data were randomly divided into a train set and a test set in the ratio of 7:3. Train set was utilized to construct models, and test set was used to evaluate the model. Furthermore, Mann-Whitney U test was employed to compare the VOCs between cancer group and benign group. VOCs with p < 0.05 were considered statistically significant. Finally, biomarkers for UGI cancer diagnosis were screened. Biomarkers were compounds that had been selected as important features by three or four models when modeling and had significant differences (p < 0.05) between UGI cancer and benign group.
3. Results
3.1. UGI cancer diagnosis based on volatolomics analysis by GC-MS
The data of exhaled breath analysis based on GC-MS was preprocessed to obtain a data matrix with 193 samples and 163 features. The parameters of the classification models based on exhaled breath analysis by GC-MS for UGI cancer diagnosis were provided in supplementary table 3. The ROC performance of four ML models for test dataset predicting is shown in figure 2(a). As shown in figure 2(a), the AUC values of LDA, SVM, RF, and XGB models were 0.895 (95%CI: 0.731, 0.897), 0.959 (95% CI: 0.859, 0.952), 0.943 (95% CI: 0.853, 0.950) and 0.797 (95% CI: 0.680, 0.827), respectively. Among the four models, the SVM model had the best performance in the test set with AUC value of 0.959, sensitivity of 82.6%, and specificity of 91.7%. Eleven biomarkers were screened based on the four models, and their trends were shown in the VOC biomarkers plot of figure 2(a). Among them, dimethyl sulfide, n-propanol, methyl cyclopentane, cyclohexane, trimethylbenzene, and 2,2-dimethyl heptane were significantly increased in the exhaled breath of UGI cancer patients, and chlorobenzene, a-methyl styrene, 3-ethyl styrene, benzothiazole, and 1-methylnaphthalene were decreased. Overall, exhaled breath analysis based on GC-MS was able to differentiate between patients with UGI cancer and benign diseases.
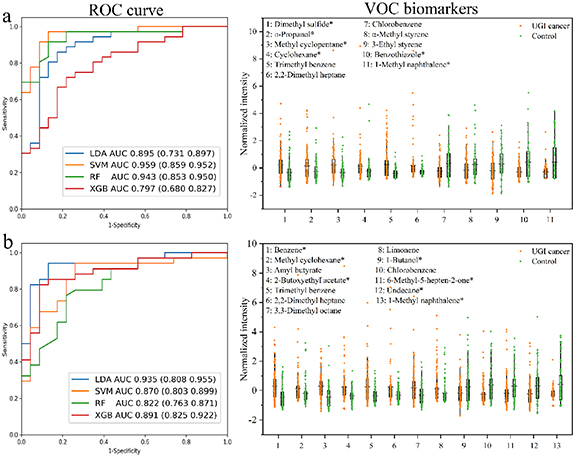
Figure 2. The classification results for differentiating UGI cancer from benign based on (a) exhaled breath and (b) gastric-endoluminal gas by GC-MS analysis. ROC curve plot shows the prediction ability of four models for test dataset. VOC biomarkers are common features selected by the four algorithms when constructing models. *Compounds identified by analyzing standards.
Download figure:
Standard image High-resolution imageThe data of gastric-endoluminal gas analysis based on GC-MS was preprocessed to obtain a data matrix with 190 samples and 190 features. The parameters of the classification models based on gastric-endoluminal gas analysis by GC-MS for UGI cancer diagnosis were also provided in supplementary table 3. The classification results of four ML models are shown in figure 2(b). It could be seen from the ROC curve plot in figure 2(b) that the AUC values of four models for test dataset predicting was more than 0.80, indicating that all models based on gastric-endoluminal gas analysis by GC-MS could distinguish UGI cancer patients from benign disease patients. The LDA model was superior to the other three models, with AUC value of 0.935 (95% CI: 0.808, 0.955), sensitivity of 95.7%, and specificity of 82.6%. As illustrated in the VOC biomarkers plot of figure 2(b), thirteen compounds were selected for UGI cancer diagnosis. The intensities of benzene, methylcyclohexane, amyl butyrate, 2-butoxyethyl acetate, trimethylbenzene, 2,2-dimethyl heptane, 3,3-dimethyl octane, and limonene were significantly increased in the gastric-endoluminal gas of UGI cancer patients, and the intensities of 1-butanol, chlorobenzene, 6-methyl-5-hepten-2-one, undecane, and 1-methyl naphthalene were decreased.
Four identical VOC biomarkers, trimethylbenzene, chlorobenzene, 1-methylnaphthalene, and 2,2-dimethyl heptane, were screened by comparing the results of exhaled breath and gastric-endoluminal gas analysis. As shown in figure 3, trimethylbenzene and 2,2-dimethyl heptane increased in UGI cancer patients both in exhaled breath and gastric-endoluminal gas, while chlorobenzene and 1-methylnaphthalene decreased in UGI patients. Notably, the intensities of all VOCs were higher in the gastric-endoluminal gas than in the exhaled breath. VOCs produced by diseased tissues enter the bloodstream by diffusion, then circulate with the bloodstream and are exchanged at the alveoli or airways before being expelled by exhalation. The concentration of VOCs in the metabolic gas of diseased gastric-endoluminal tissue would be greater than in the exhaled breath obtained by multiple diffusions.
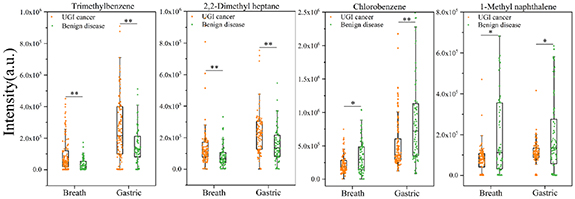
Figure 3. Box-plot of the same VOC biomarkers for UGI cancer diagnosis based on exhaled breath and gastric-endoluminal gas by GC-MS analysis. * p < 0.05; ** p < 0.001.
Download figure:
Standard image High-resolution image3.2. UGI cancer diagnosis based on volatolomics analysis by UVP-TOFMS
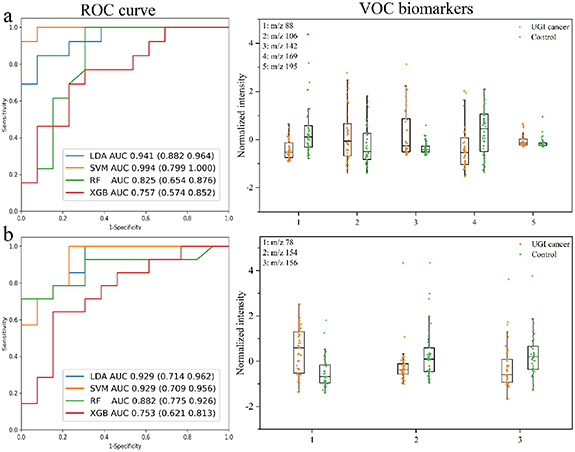
In this study, UVP-TOFMS was used for rapid analysis of exhaled breath and gastric-endoluminal gas samples. The original spectrum obtained by UVP-TOFMS analysis of gas samples is shown in supplementary figure 3, and it was found that a large number of compounds were detected in both exhaled breath and gastric-endoluminal gas. A data matrix with 85 samples and 166 features was obtained by preprocessing the data of exhaled breath analysis based on UVP-TOFMS. The UGI cancer diagnosis model was also constructed by four ML algorithms, and parameters of the models were provided in supplementary table 4. As illustrated in the ROC curve plot of figure 4(a), the linear model based on LDA and SVM (linear kernel) had better performance in the test set, with AUC > 0.90. Overall, the SVM model had the best performance with the AUC value of 0.994 (95% CI: 0.799, 1.000), sensitivity of 92.3%, and specificity of 100.0%. Five common features were selected based on four models, which were m/z 88, m/z 106, m/z 142, m/z 169, and m/z 195 (figure 4(a)). Combining the qualitative result of GC-MS, VOCs in the exhaled breath of healthy subjects summarized by Costello et al [19], and the standards analysis in UVP-TOFMS, m/z 88, 106, 142, 169, and 195 were tentatively characterized as allyl methyl sulfide, xylene, nonanal, dodecane, and isobornyl acetate, respectively (supplementary table 5). These VOCs had the same trend in UVP-TOFMS and GC-MS analysis (supplementary figure 4). The mass spectra of these standards analyzed by UVP-TOFMS are shown in supplementary figure 5.
Figure 4. The classification results for differentiating UGI cancer from benign based on (a) exhaled breath and (b) gastric-endoluminal gas by UVP-TOFMS analysis. ROC curve plot shows the prediction ability of four models for test dataset. VOC biomarkers are common features selected by four algorithms when constructing models.
Download figure:
Standard image High-resolution image
A data matrix with 87 samples and 160 features was obtained by preprocessing the data of gastric-endoluminal gas analysis based on UVP-TOFMS. The data matrix was used for classification model construction, and the model parameters can be found in supplementary table 4. As illustrated in the ROC curve plot of figure 4(b), the linear models had better performances, with AUC > 0.90. This result was similar to the exhaled breath analysis based on UVP-TOFMS for UGI cancer diagnosis. LDA and SVM (linear kernel) are linear classification algorithms. The ultimate goal of classification is to find an optimal decision boundary. Generally, the classification results would be better when the sample size is small [28]. Both RF and XGB are ensemble tree models, which are prone to overfitting when the sample size is small [29]. Due to the small size of samples enrolled in this study, the performances of these models are as expected. Three biomarkers, m/z 78, m/z 154, and m/z 156, were screened (figure 4(b)). They were tentatively characterized as benzene, 2-ethenyl naphthalene, and undecane, respectively. Benzene and undecane had the same trend in gastric-endoluminal gas analysis based on GC-MS and UVP-TOFMS (supplementary figure 6). The mass spectra of these standards analyzed by UVP-TOFMS are shown in supplementary figure 5.
4. Discussion
Characteristic VOCs closely related to the disease were produced by the corresponding cancer cells or 'tumor microenvironment' [30], which then enter the bloodstream through diffusion and circulate with blood throughout the body [31]. VOCs in the blood are exchanged in the alveoli or airway and finally released through exhaled breath [32, 33]. Thus, Exhaled breath reflects the metabolic status of the whole body [34] and can be used not only for UGI cancer diagnosis but also for other diseases [35, 36]. Although exhaled breath analysis has great potential in disease diagnosis, its clinical application is limited due to the insufficient understanding of sources and metabolic pathways of VOCs in exhaled breath [17]. Gastric-endoluminal gas is the in situ metabolic gas of diseased tissues, and direct analysis of in situ metabolic gas can reduce the effect of diffusion and other tissue's metabolism [20, 31]. Four common biomarkers, trimethylbenzene, 2,2-dimethyl heptane, chlorobenzene, and 1-methylnaphthalene, were screened out by comparing the results of exhaled breath and gastric-endoluminal gas by GC-MS analysis. The intensity of these VOCs was higher in gastric-endoluminal gas than in exhaled breath. This phenomenon is similar to the findings of Adam et al [20]. Haick et al [31] estimated the thermodynamic partition coefficient of VOCs between different body fluids based on the concentration balance of a given VOC between 'breath-blood-fat'. They found that the distribution coefficients (λf:b) of most VOCs between tissues and blood were more than 1. The same was true for the coefficient (λb: a) between blood and exhaled breath. It indicated that the same VOCs had the highest concentration in tissues. Combined with Haick's hypothesis [31] and the result that the intensity of the same VOCs in gastric-endoluminal gas was higher than that in exhaled breath, it could be inferred that the concentration of most VOCs would decrease during the diffusion process. Exhaled breath reflects the metabolic status of the whole body and is easier to obtain than other body fluids, so exhaled breath analysis is suitable for large-scale health screening. Gastric-endoluminal gas acquisition is invasive, but it is the metabolic gas of living diseased tissue, which can assist the diagnosis of UGI cancer from the perspective of in situ metabolic molecules.
The relationship between characteristic VOCs and cancer is still unclear, and the metabolic pathways of several important VOCs overlapping with other studies are briefly discussed. The increase of saturated alkanes is related to oxidative stress [14, 22]. In this study, branched alkanes significantly increased in patients with UGI cancer, and Hong et al [37] and Chen et al [38] also found the same phenomenon. Branched unsaturated fatty acids are almost absent in humans [39], while bacteria contain more branched chain unsaturated fatty acids [40, 41]. Therefore, the increase of branched alkanes in UGI cancer patients may be related to bacteria. To our knowledge, cycloalkanes were first reported as biomarkers of UGI cancer. Cyclohexane was found to be significantly elevated in exhaled breath in patients with lung cancer and pleural mesothelioma [42, 43]. Moukhamedieva et al [44] found that methylcyclohexane and methylcyclopentane increased in the exhaled breath after healthy volunteers were exposed to 100% medical oxygen for 2 h. Reactive oxygen species increased significantly in cancer patients and subjects exposed to 100% medical oxygen. It is speculated that the increase of cycloalkanes may also be related to oxidative stress. In this study, trimethylbenzene significantly increased in the exhaled breath and gastric-endoluminal gas of patients with UGI cancer. Adam et al [14] and Hong et al [37] also found that trimethylbenzene significantly increased in the exhaled breath of patients with gastric cancer. Trimethylbenzene is one of the common organic solvents in chemical, plastic, printing, and other industries [45]. It is generally considered to be an exogenous VOC [46]. The increase of trimethylbenzene in the metabolic gas of UGI cancer patients may be related to environmental exposure. Interestingly, this study and Tong et al [47] found that 6-methyl-5-hepten-2-one significantly reduced in patients with gastric cancer, whereas Amal et al [48] found that it was elevated in the breath of patients with gastric cancer. It is difficult to explain the opposite trend because there is no research related to the metabolic pathway of 6-methyl-5-hepten-2-one for reference. The analysis of exhaled breath and gastric-endoluminal gas only cannot clarify the specific sources and metabolic pathways of characteristic VOCs, and further studies are needed.
GC-MS is a classical method for qualitative and quantitative analysis of VOCs in complex matrix samples [21]. Tedious sample pretreatment and time-consuming separation process limit its application in clinical disease screening [21]. UVP-TOFMS is a direct mass spectrometry technology with high sensitivity and without sample pretreatment, but it is difficult to identify compounds accurately [49]. Therefore, UVP-TOFMS and GC-MS complement each other. GC-MS is conducive to discovering new biomarkers [21], and UVP-TOFMS is suitable for rapid sample analysis [24]. In this study, the performance of exhaled breath analysis for diagnosis of UGI cancer based on GC-MS and UVP-TOFMS was comparable, with AUC of 0.959 and 0.994, respectively. Gastric-endoluminal gas analysis based on GC-MS and UVP-TOFMS also had similar performance in distinguishing UGI cancer and benign disease patients, with AUC of 0.935 and 0.929, respectively. These results suggested that volatolomics analysis based on GC-MS and UVP-TOFMS can be used for UGI cancer diagnosis. Exhaled breath analysis based on UVP-TOFMS has the advantages of non-invasiveness, high accuracy, and convenience. Therefore, the combination of breath analysis and UVP-TOFMS is expected to achieve large-scale non-invasive screening of UGI cancer.
The development of real-time online mass spectrometry has accelerated the process of exhaled breath analysis for large-scale health screening. Exhaled breath reflects the metabolic status of the whole body and can be acquired noninvasively many times. Thus, it is an ideal matrix for health screening. The combination of exhaled breath analysis and UVP-TOFMS is expected to achieve large-scale non-invasive screening of UGI cancer. Gastric-endoluminal gas is the in situ metabolic gas of diseased tissues, which can reduce the effects of environment, diffusion, and other tissue's metabolism. The combination of real-time mass spectrometry and gastric-endoluminal gas analysis has potential to achieve in situ rapid gas biopsy to assist in UGI cancer diagnosis. Overall, there are clinical implications in the use of volatolomics analysis for disease diagnosis of this study.
5. Conclusions
The results demonstrated that the breath analysis based on GC-MS and UVP-TOFMS achieved excellent performances in distinguishing patients with UGI cancer and benign disease, with AUC > 0.90. Due to the exhaled breath analysis based on UVP-TOFMS having the advantages of non-invasiveness, rapidity, convenience, and high accuracy, it was expected to achieve non-invasive large-scale screening of UGI cancer. The gastric-endoluminal gas analysis directly reflected the in situ metabolism of gastric lesions tissue, which could excellently distinguish UGI cancer patients from benign disease patients, with AUC > 0.90. It can be a means of gas biopsy for UGI cancer prediction combined with UVP-TOFMS.
Acknowledgments
This research was gratefully supported by the Sichuan Science and Technology Program, China (No. 2022YFG0082).
Data availability statement
All data that support the findings of this study are included within the article (and any supplementary files).
Conflict of interest
The authors declare no conflicts of interest.
Supplementary data (0.6 MB PDF)