

Abstract
While it is widely assumed that poor countries will suffer more from climate change, and that climate change will exacerbate inequalities within countries, systematic and large-scale evidence on this issue has been limited. In this systematic literature review, we examine and synthesize the evidence from the literature. Drawing from 127 individual papers, we find robust evidence that climate change impacts indeed increase economic inequality and disproportionately affect the poor, both globally and within countries on all continents. This result is valid across a wide range of physical impacts, types of economic inequality, economic sectors, and assessment methods. Furthermore, we highlight the channels through which climate change increases economic inequality. While the diversity of different approaches and metrics in the existing literature base precludes extracting a universal quantitative relation between climate change and economic inequality for use in future modelling, our systematic analysis provides an important stepping stone in that direction.
Export citation and abstract BibTeX RIS

Original content from this work may be used under the terms of the Creative Commons Attribution 4.0 license. Any further distribution of this work must maintain attribution to the author(s) and the title of the work, journal citation and DOI.
1. Introduction
Since the late 1980s, global economic inequalities have been decreasing according to most metrics [1, 2]. This has been driven by decreasing inequalities between countries, due to rapid economic growth in Asia, and has occurred despite increasing inequalities within a number of countries [3, 4]. However, this trend could be reversed depending on the extent of climate change impacts, and how those are distributed globally [5]. Indeed, the Intergovernmental Panel on Climate Change (IPPC) [6] reports with high confidence that losses and damages attributed to climate change will be strongly concentrated, and disproportionately affect the poorest and vulnerable populations in the Global South. Climate change affects the economy, as biophysical impacts translate into economic damages in various ways [7]. These economic impacts are expected to be shared unequally between regions, countries, households and individuals. Indeed, different groups may be impacted differently according to geographic location and socio-economic characteristics, and future economic inequality will depend on relative adaptive capacities [8]. Distributive justice calls for a fair distribution of the costs, benefits, and risks associated with climate change. If we accept the moral imperative of ensuring that the burden of climate change does not fall disproportionately on the most vulnerable, a comprehensive analysis of the role of climate change in driving economic inequality is a first necessary step to enable a just transition. A large and growing body of literature explores the impact of climate-related events on inequalities between and within countries. While it is widely assumed that poor countries will suffer more from climate change [9], and that climate change will exacerbate inequalities within countries [10], systematic and robust evidence on a large scale is lacking on the issue. This is despite the fact that some authors have provided reviews on the links between poverty and natural disasters [11], between livelihood resilience and climate change [12], and some systematic mappings of the literature on justice and climate change adaptation [13]. This paper fills this gap, and provides a systematic review of the effect of climate change on economic inequalities from the existing literature. Although climate change will evidently affect inequalities between generations, we focus here on inequalities within a generation. We gather evidence on whether, where and how climate change exacerbates economic inequalities. In doing so, we provide a reproducible and transparent, hence reliable knowledge base to inform policy-making and practice [14]. We first present the methods used for the systematic review, including publication selection and data extraction (section 2), then the results across geographical scopes, physical impacts, economic sectors, types of economic inequality, and assessment methods (section 3). We finally reflect on the implications of our results for policy-making and future research (section 4).
2. Methods
We provide a systematic review of the effect of climate change on economic inequalities from the existing literature, focusing on its distributive dimension across and within countries. For that purpose, we conducted queries on paper titles and abstracts in the Web of Science and Scopus literature databases in February 2023. This section presents the publication selection and data extraction. The final corpus includes 127 papers, listed in the Extended Data section, where bibliometric information is also presented (figure 7).
2.1. Publication selection
We conducted queries on titles and abstracts in the Web of Science and Scopus literature databases in February 2023. We used groups of keywords connected with Boolean operators, filtering for peer-reviewed papers on climate change impacts and their distributive implications. Books, book chapters and working papers were excluded from the results. We aimed for our method to be reproducible, and as transparent as possible. A balance thus needed to be found between explicitly excluding terms from the queries (with the risk of excluding relevant papers), and reaching a large enough corpus. The issue is that all-encompassing queries may include too many irrelevant papers, which should be then screened by hand, with the risk of losing transparency and reproducibility. Abstracts are bound to include a wider diversity of terms than titles. Therefore, we ran different queries for titles and abstracts. We used a smaller, more restrictive set of terms for titles (we included a smaller number of generic terms), and a larger set of more specific terms for abstracts. For titles, the query was organised into two blocks: the first one pertains to climate change and its physical impacts, the second relates to the economic and inequality dimension. For abstracts, the query was organised into three blocks: the first one pertains to climate change and its physical impacts, the second relates to the economic dimension, and the third relates to inequality. All the sets of terms were linked by an AND Boolean. Those two sub-queries were linked by an AND Boolean in the overall query (see schematic representation on figure 1). We ran queries on 6 February 2023, returning 1066 items in the case of Scopus, and 825 items in the case of Web of Science. The query is summarised on figure 1, and the exact queries are presented in the Extended Data section. After merging the results and removing the 768 duplicates, the list of papers contained 1072 items, also after excluding conference proceeding papers, erratums, books and book chapters.

Figure 1. Query structure.
Download figure:
Standard image High-resolution imageEach paper was then screened by two members of the author team using the abstrackr tool (http://abstrackr.cebm.brown.edu/). Abstrackr allows to organize and screen abstracts for systematic literature reviews. We did not use exclusion terms during the screening process. Papers were considered out of scope when they did not provide an assessment of the impact of climate change on income or consumption inequality. The following categories were used to tag the excluded papers: out-of-scope discipline (e.g. electrical engineering, chemistry, etc), irrelevant type of paper or method (e.g. purely theoretical paper, perspective paper), absence of clear link to climate change (e.g. focus on natural disasters disconnected from climate change), absence of economic variable, paper focused on mitigation and not on impacts, no mention of inequality, paper centered on adaptation. The grading system consisted of three labels: include, reject, unsure. The double screening process led to a small number of items that were not concurrently rejected or included by both reviewers. Those cases were then discussed individually within the author team. We retained 199 papers after the abstract screening process, which were then closely read by one member of the author team. The following information was extracted for all selected papers [15]:
- bibliographic information: journal, title, abstract, authors, year of publication, doi
- general scoping information: scope (global, regional, multi-regional, multi-national, national, sub-national); country or region of interest (if applicable); granularity (region, country, county, district, city, household, sub-national, sub-regional, urban-rural), type of inequality considered (income, consumption, GDP, welfare); method (econometric, surveys, or simulation based including integrated assessment model, computable general equilibrium model or microsimulation); type of physical impact (temperature, precipitation, extreme events, sea level rise, droughts, floods); specific sector; channel of impacts (e.g. labour productivity, impact on infrastructure); whether the study is backward-looking (i.e. based on historical data only), forward looking (i.e. simulation scenarios), or both; whether the results only relate to exposure to climate change; whether the effects are strongly or only weakly related to climate change.
- results: whether the paper provides a quantitative estimate of the effect of climate change on economic inequality; the type of inequality metric and its value and unit (if applicable); the sign of the effect of climate change on economic inequality (increase, decrease, neutral, no conclusion, mixed, increase of poverty); the most impacted social group (neutral between poor and rich, no conclusion, mixed, the poor, the rich, the urban, the rural); a key quote from the paper; caveats or limitations highlighted by the authors.
When gathering evidence, we were careful to not over-interpret the results of the papers of the corpus, and to hold on to the wording used in those. For instance, if a paper concluded that 'climate change mainly affects the poor', without explicitly stating that inequalities increase, we refrained from concluding that the paper gave the result that 'climate change increases inequalities', as that result may depend on the effect of climate change on the middle of the income distribution. We did not use a preset definition of the term poor (e.g. people with income below a given level), but relied on the definition used by the authors of the papers of the corpus. This definition may thus vary from one case to the other. After careful review, 72 papers were excluded, because one or several of the following categories applied: (i) literature review, meta-analysis of existing papers, or purely theoretical paper, (ii) absence of a mention of distribution issues, (iii) absence of sentence linking climate change to the frequency or intensity of the studied physical manifestation of climate change, (iv) paper centered on adaptation, (v) paper centered on mitigation, (vi) inequality treated as a driver of another variable of interest, not as an outcome, (vii) focus on energy poverty only. The final corpus contains 127 papers (listed in the Extended Data section), published between 1998 and 2023 (figure 7(a) of the Extended Data section), mainly within the fields of Environmental Sciences & Ecology and Business & Economics (figure 7(b) of the Extended Data section). We note a rapid recent increase in the number of relevant papers, trebling between 2020 and 2022. Also note that while a large body of literature studies the effect of climate policies (such as carbon pricing) on economic inequalities globally [16], in low and middle income countries [17], or in the case of the European Union [18], this is not the focus of this paper.
2.2. Data extraction: main dimensions
Here we present the dimensions we focus on in the data extraction process, and some descriptive statistics from the corpus. We devised six categories to analyse the corpus along its various dimensions (namely, geographical scope, granularity, physical impact, type of inequality, economic sector, assessment method). In each case, we counted the number of occurrences according to the statements made by papers on the impact of climate change on inequalities and on the nature of the most impacted group (cf categories described in table 1). Further descriptive statistics of the corpus are presented in the Extended data section (figures 8 and 9).
Table 1. Outcome categories.
| Outcome category | paper statements |
|---|---|
| regressive effect |
 inequalities increase due to climate change, or inequalities increase due to climate change, or
|
 poverty increases due to climate change, or poverty increases due to climate change, or
| |
 the poor are more impacted by climate change the poor are more impacted by climate change | |
| mixed effect |
 mixed results in terms of the impact of climate change on inequalities, or mixed results in terms of the impact of climate change on inequalities, or
|
 mixed results in terms of which social group is more impacted mixed results in terms of which social group is more impacted | |
| neutral effect |
 climate change does not affect inequalities climate change does not affect inequalities |
| progressive effect |
 inequalities decrease due to climate change, or inequalities decrease due to climate change, or
|
 the rich are more impacted by climate change the rich are more impacted by climate change | |
| no conclusion |
 no explicit conclusion on the effect of climate change on inequality, and no explicit conclusion on the effect of climate change on inequality, and
|
 no explicit conclusion on which social group is most impacted no explicit conclusion on which social group is most impacted | |
| other |
 no explicit conclusion on the effect of climate change on inequality, and no explicit conclusion on the effect of climate change on inequality, and
|
 a particular non-income related group is identified as being most impacted a particular non-income related group is identified as being most impacted |
2.2.1. Scope and granularity
We consider the impact of climate change on inequalities within and between countries, and therefore include papers that provide global results, and papers on specific countries or regions. Scope is defined as the geographical perimeter of the study. Granularity refers to the geographical perimeter or social groups considered when assessing economic inequality within the geographical scope. In the global, regional, multi-regional, and multi-national studies, inequalities are mostly assessed at the country or regional level. Papers assess inequalities at the household level, or at other sub-national social groups or geographical entities (e.g. urban vs. rural, cities, counties, districts, farms). The majority of studies have either a global (35%) or national (32%) scope. The most studied single countries are China (9 papers), Brazil (6 papers), and South Africa (5 papers). There are 67 country-specific papers covering every continent. In terms of geographical distribution, 31 papers focus on Africa, 24 on Asia, 13 on South America, 8 on North America, 4 on Oceania, and 4 on Europe. Figure 8 shows the geographical distribution of the country and multi-country studies of the corpus.
2.2.2. Physical impacts
The scope of this review encompasses all manifestations of climate change. A large body of literature focuses on the impact of natural disasters on inequalities and the distribution of income without a clear focus on the possible links between those events and climate change. While that literature relates to our study, it is outside of its specific scope, and has been reviewed extensively elsewhere [19, 20]. The direct physical impacts of climate change can range from changes in the frequency or intensity of extreme events, such as hurricanes, floods, droughts, or heatwaves, to slower processes such as coastal erosion and changes in average climate conditions. These may lead to a wide variety of impacts, from reduced availability of fresh water and reduced crop yields, to changes in the incidence of vector-borne diseases, depletion of fisheries, mass coral bleaching, wildfires, and more. The main drivers of these impacts include the warming trend (i.e. the evolution of global and regional average temperatures), extreme temperatures, the evolution of precipitation (and its spatial distribution), extreme precipitation, and sea level rise [21]. The types of physical impacts assessed in the corpus overwhelmingly relate to temperature increase (whether mean surface temperature or extreme heat) and precipitation (whether mean precipitation, increased variability of precipitation, or extreme precipitation), amounting to 197 occurrences (some papers may represent several types of impacts). The fact that most papers relate to temperature increase may be partly due to the large number of global studies, to the fact that temperature is easiest to project into the future, and to the difficulty to assess more specific physical impacts at the global scale.
2.2.3. Types of inequalities
We focus on the distributive dimension of economic inequality, i.e. how different dimensions of well-being are distributed within society, and how they may be affected by climate change 4 . Although these dimensions can be both monetary (such as income, wealth) and non-monetary (e.g. health, education), we understand here economic inequality as inequality with regard to income and consumption. Other dimensions can however affect individuals' well-being [22–25], notably health, leisure, the quality of social relations and the natural environment, but are not the focus of this paper. Heterogeneity in individual environmental, social, cultural conditions influence what is accessible to individuals at a given income level. Still, income can be spent to improve achievements and expand capabilities. It can be a strong driver of the sensitivity to climate change impacts, as it often determines other factors that impact sensitivity to climate impacts, such as access to technology (e.g. irrigation, air conditioning), insurance, and health services. In poor countries especially, low-income households often lack appropriate assets that may provide protection against extreme climate events, for instance adequate housing, and sufficient livestock in the case of the rural poor. Besides income, another way to measure economic inequality is to look at disparities in terms of wealth (i.e. the value of owned assets such as housing, cattle, cash or stocks). Wealth is a key dimension of well-being, as it generates income, i.e. it accounts for potential income that could be derived from assets, and can be associated with increased opportunities [26]. In summary, our search queries do not include the following specific categories: health, mortality, food, energy access, and energy use, although those dimensions can be linked to income and consumption, and may appear in the analysis provided by the selected papers. We do not include those terms in the query to avoid selecting papers that would adopt a narrow scope, and would for instance solely focus on a specific component of consumption, while neglecting others. Further, the review aims at assessing the impacts of climate change on economic inequality beyond pure exposure. The papers which report only on the distribution of exposure across different groups are not formally excluded, but are assigned to a specific category in the review.
2.2.4. Assessment methods
The scope of this review encompasses all possible methods to assess the impact of climate change on economic inequality. These include econometric studies, often relying on household surveys, which are required to study income or consumption inequality across households, either at the level of individual countries [27], or at the level of subgroups within countries [28, 29]. Simulation approaches are also relevant. Computable general equilibrium (CGE) models capture the impacts of climate change (in some particular cases, the impacts on agricultural productivity) at the level of large world regions with representative agents. They are sometimes coupled with a microsimulation model, which is based on the modeling of agents and can capture effects on heterogeneous households. The advantages of CGE models are their sectoral detail and their ability to capture trade effects in particular. Integrated assessment models are used to study the interplay of socioeconomic conditions, climate, energy and land use in the context of future scenarios and on a global scale. They can capture inter-regional inequality, as they mostly operate at the level of large world regions, but usually miss sub-regional inequality, as they typically consider a single representative agent by region. However, recent efforts have led to a better representation of intra-regional inequality in those models [18, 30], although inequalities are not always related to climate change impacts. In the NICE model [30], climate damages are distributed across regional income quintiles using an elasticity parameter which is not empirically based.
2.2.5. Outcome categories
A majority of studies shows differential impacts across regions and social groups, but their authors do not always explicitly discuss the consequences of those on inequality, nor provide quantitative estimates of standard economic inequality metrics. Further, inequality metrics, when available, are bound to widely differ in nature across papers. We therefore mainly provide a qualitative rather than quantitative assessment, and simply examine whether inequalities increase or decrease within and between countries due to climate change impacts. We use the outcome categories presented in table 1 to analyse the effect of climate change on economic inequalities.
2.2.6. Agreement indicator
We use an agreement indicator developed in other systematic reviews [31] to summarize the level of agreement regarding the direction of the impact of climate change on economic inequality along all dimensions. This indicator is calculated as  , where i is the possible outcome (regressive effect, progressive effect, mixed or neutral effect), and si
is the share of each outcome for the given category (e.g. geographical scope). By design, the index can range from 0.33 (a full level of disagreement regarding the effect of climate change on inequalities) to 1.00 (a full level of agreement, indicating that 100% of the papers are, for instance, pointing to a regressive effect of climate change on inequalities). For example, if, for a given category, 80% of the papers find a regressive effect, 10% report a progressive effect, and 10% find a mixed or neutral effect, the level of agreement equals 0.64 + 0.01 + 0.01 = 0.66, which indicates broadly consistent although not universal evidence of a regressive effect of climate change on inequalities for that given category.
, where i is the possible outcome (regressive effect, progressive effect, mixed or neutral effect), and si
is the share of each outcome for the given category (e.g. geographical scope). By design, the index can range from 0.33 (a full level of disagreement regarding the effect of climate change on inequalities) to 1.00 (a full level of agreement, indicating that 100% of the papers are, for instance, pointing to a regressive effect of climate change on inequalities). For example, if, for a given category, 80% of the papers find a regressive effect, 10% report a progressive effect, and 10% find a mixed or neutral effect, the level of agreement equals 0.64 + 0.01 + 0.01 = 0.66, which indicates broadly consistent although not universal evidence of a regressive effect of climate change on inequalities for that given category.
3. Results and synthesis
We present the main findings and analysis of the reviewed literature. We synthesize these according to the main relevant dimensions presented above. The result that inequality increases due to climate change or that the poor are more impacted is obtained across a diversity of geographical scopes (figures 2 and 3), physical impacts, economic sectors, channels, types of economic inequality and assessment methods (figures 4–6).

Figure 2. Effect of climate change on economic inequality according to geographical scope. Note that the x-axis gives the share of occurrences in the corpus. The number between brackets indicates the total number of occurrences for a given category.
Download figure:
Standard image High-resolution image
Figure 3. Map of countries where studies show a regressive effect, i.e. that climate change increases economic inequality or that the poor are more impacted. This map includes studies with a national or sub-national scope, and multi-country studies where that result is valid for single countries. This map excludes global studies.
Download figure:
Standard image High-resolution image
Figure 4. Impact of climate change on economic inequality by physical impact, sector, type of inequality, and assessment method. Note that the x-axis gives the share of occurrences in the corpus. The number between brackets indicates the total number of occurrences for a given category. The sum of those numbers may differ from the total number of papers (127), as some papers may fall into several subcategories, for instance in the case where several types of physical impacts are discussed in a single paper.
Download figure:
Standard image High-resolution image
Figure 5. Impact of climate change on economic inequality by channel. Note that the x-axis gives the share of occurrences in the corpus. The number between brackets indicates the total number of occurrences for a given category. The sum of those numbers may differ from the total number of papers (127), as some papers may fall into several subcategories.
Download figure:
Standard image High-resolution image
Figure 6. Level of agreement across studies on the impact of climate change on economic inequality by category (i.e. physical impact, method, type of inequality, channel, sector, scope, granularity, and overall). For each category, the indicator is calculated as  , where i is the possible outcome (regressive effect, progressive effect, mixed or neutral effect, we exclude here studies from the no conclusion and other categories), and si
is the share of each outcome for the given category (e.g. geographical scope). For each category, the color indicates the contribution of each outcome (
, where i is the possible outcome (regressive effect, progressive effect, mixed or neutral effect, we exclude here studies from the no conclusion and other categories), and si
is the share of each outcome for the given category (e.g. geographical scope). For each category, the color indicates the contribution of each outcome ( ) to the level of agreement indicator (H). The figure shows that the dominant outcome is that climate change increases inequality or has more impact on the poor (red) for all categories. These results exclude studies that do not provide any conclusion (i.e. they exclude the no conclusion and other categories, cf table 1). A level of agreement of 1 indicates that all studies within the given category agree on the dominant outcome. The lowest possible level of agreement is 0.33, i.e. in the case where the three considered outcomes represent equal shares of the results. The number between brackets indicates the total number of occurrences for a given category. The sum of all those numbers within a category may differ from the total number of papers (127) as we only account here for a subset of outcomes. Also, some papers may fall into several subcategories, for instance in the case where several types of physical impacts are discussed in a single paper. The level of agreement exceeds 0.5 in all sub-categories except survey methods and sub-national scope. It reaches 1 for some sub-categories, though note that most of those are covered by only a few studies. It reaches 0.75 or above for 34 sub-categories out of 46.
Download figure:
Standard image High-resolution image3.1. Climate change increases inequalities, both globally and within countries on all continents
While the majority of papers (75 out of 127) do not explicitly conclude on the effect of climate change on inequality, most of those papers still identify the poor as being the most impacted (55%), while four papers identify the rich (households [32, 33], counties [34], or countries [35]) as being the most impacted. Three of the those four papers focus on very local situations: one in the particular case of tropical cyclone Bulbul in Bangladesh, where rich shrimp farmers incurred higher losses (explained by the larger size of their farms) [32], one in the case of wildfires in the US, where owners of high-value properties also incurred higher losses [34], and one focusing on the Ethiopian Awash basin, where poor households were found to benefit more from additional rainfall, and suffer less from a decrease in rainfall than non-poor households [33]. One paper with a global scope finds that rich countries are most impacted by climate change, in the particular case of extreme precipitation [35]. This econometric study looks at four different rainfall measures, and finds a greater sensitivity of rich countries to daily rainfall only. The authors explain this last result by the smaller dependence on agriculture and greater dependence on services of rich countries compared to poorer countries. Almost all global studies conclude that climate change increases inequalities or that the poor are more impacted (36 papers, i.e. 78% of global studies, figure 2). Some papers (12) identify other groups as being most impacted by climate change, without indication of income group, e.g. rural, urban, women, particular regions or countries, particular sectors or economic activities. Overall, a minority of papers does not conclude on either dimensions (17%), i.e. on both the effect of climate change on inequalities and on which group is most impacted.
Among the 52 papers which provide a conclusion on the impact of climate change on economic inequality, 35 papers find an increase in inequality due to climate change. Only two papers show a decrease in inequality due to climate change, both of which focus on very specific local circumstances: floods in Pakistan [36], which is however associated with a decrease in income in the affected regions, and inequality of prices between fishers and traders in Mexico [37]. A majority of studies thus concludes that climate change either increases economic inequalities, or has more impact on the poor, or both (69% of the corpus, 83% of the papers which conclude on either dimension). In general, we find that the papers which conclude that climate change increases economic inequalities or that the poor are more impacted cover a much wider range of sub-categories (e.g. types of physical impacts, assessment methods, etc) than those that conclude otherwise (figure 10).
We find that the results presented above can vary slightly according to whether one only considers within or between country inequalities. The result that climate change increases inequality mostly holds for national studies, as 68% of those conclude that climate change increases inequalities or that the poor are more impacted (30 papers). Studies comparing the effect of climate change across countries overwhelmingly find that inequalities between countries increase or that poor countries are more impacted (79% of all occurrences, figure 12). The share of papers focusing on within country inequality and giving the same conclusion is lower (64% of all occurrences, figure 12). The results show that climate change increases economic inequalities and disproportionately affects the poor holds in all world regions (figure 3). The countries with the highest number of studies (more than 5) showing that climate change increases inequality or has more impact on the poor are China, Brazil, Ethiopia and the US. Only 5 country-level or sub-national studies conclude that climate change decreases inequality or that the rich are more impacted, in Bangladesh, Ethiopia, Mexico, Pakistan, and Western USA.
Among all national, sub-national, multi-national and multi-regional studies, 41 studies focusing on the Global South (75% of such studies which provide a conclusion on either dimension) show that climate change increases inequality or that the poor are more impacted. This includes 15 studies that show that climate change increases inequalities, but do not necessarily provide a conclusion on whether the poor are more impacted, notably in Brazil, Lebanon, India, China, the Philippines, Iran, and African countries such as Burkina Faso, Ethiopia, Malawi, Ghana, Tanzania. These include studies with a national and sub-national scope. Among studies focusing on the Global North, 8 provide the same conclusion (in Europe and the US), i.e. 89% of Global North studies which provide a conclusion on either dimension. We thus conclude that this general result is valid across the Global South and the Global North.
3.2. All types of physical impacts increase economic inequalities, through several channels
The share of papers that find that a particular physical impact increases inequality or has more impact on the poor (figure 4 top left, in red) ranges from 60% (precipitation) to 89% (sea level rise), depending on the type of physical impact. Most papers (90) focus on the impact of temperature. In those cases, 72% of papers conclude that temperature change increases inequality or impacts the poor the most. The same biophysical impacts can lead to different damages across groups due to different sensitivities, i.e. different propensities to be adversely affected by a given climate change impact.
Most papers look at impacts on the whole economy or on multiple sectors, and the most studied single sector is agriculture (figure 4 top right). When all or multiple sectors are concerned, 78% of papers conclude that inequalities increase or that the poor are most impacted. That result is weaker for papers focusing on agriculture (44%), as a large share of papers do not provide any conclusion (28%), or identify other groups as being most impacted (e.g. particular agro-ecological zones [38], fruit producers [39], urban households [40], wheat importing regions [41]). How climate change may affect inequalities through its impact on agriculture is not straightforward. Food price hikes may be triggered by reduced agricultural productivity in most regions exposed to climate change. The impact on inequality can depend on the share of household income spent on food (which tends to decrease with income), and on the share of agricultural revenues in total household income. Agricultural productivity and prices, through their consequences on the income of farmers, are still identified by some authors as the main channel through which climate change may increase poverty [42], hence inequality.
Several channels translate climate change impacts into effects on economic inequality. In order to understand how climate change may affect economic inequalities, we report on the impact channels identified in each paper, when those are specified by the authors (figure 5). Those channels include economy wide effects affecting all sectors, agricultural revenues (through decreasing crop yields, livestock revenues, or agricultural total factor productivity), decreasing labour productivity, infrastructure and physical assets, energy demand, water availability, and forests. We find that papers that identify labour productivity (8 papers) or energy (4 papers) as the main channels through which climate change affects economic inequalities overwhelmingly conclude that economic inequalities increase or that the poor are more impacted. A decrease in labour productivity may indeed increase inequality if it reduces the income of low-skilled workers more than the income of high-skilled workers. In particular, outdoor workers, and indoor workers in workplaces without air conditioning may be impacted more. We note that a large share of the papers for which physical assets are identified as the main channel show that inequalities are decreasing due to climate change or that the rich are more impacted. Those correspond to the previously highlighted papers where rich agents incur a higher loss due to the higher value of their property [32, 34]. This is consistent with empirical evidence gathered elsewhere that richer households can also be vulnerable to climate-related shocks because they have a high concentration of capital assets [43], for instance in the case of livestock [44].
3.3. Climate change increases both household and national income inequalities
We categorise studies according to the type of inequalities considered, i.e. the variable that was used to compare social or geographical groups (figure 4 bottom left). The majority of studies considers household or individual income, followed by GDP, and household consumption. The studies focusing on national income (GDP), mostly with a global scope, do not generally provide details on the mechanisms at play at the sectoral level. While some global studies may only refer to GDP, several sectors and mechanisms can be included in the modelling, although those are not explicitly mentioned in the text. Finally, although our review primarily focuses on income and consumption inequality per se, some papers also specifically look at disparities using the normative concept of welfare, which is derived from consumption. In that case, welfare is typically an isoelastic function of consumption, so that changes at the bottom of the distribution are given a greater weight than those at the top of the distribution. Again, we find rather homogeneous results across the types of inequality considered, with a slightly higher share of papers finding that climate change increases economic inequality or has more impact on the poor in the case of GDP (74%, those papers mostly have a global or national scope).
Different indicators have been proposed to give an overall measure of income or consumption inequality [45]. The most commonly used indicator is the Gini index, which measures the gap between the actual distribution of income or consumption and a perfectly egalitarian distribution, i.e. a distribution where every individual would receive the same income or consumption. Other indices focus on both ends of the distribution, for instance the Palma Ratio, which compares the income or consumption of the top 10% of the population with that of the bottom 40% [46]. The Theil index [47] derives from information theory, and offers interesting decomposition properties, because it allows breaking down inequalities between and within different groups. A total of 60 papers of the corpus provide a quantitative analysis. From those, 16 papers quantify results in terms of an inequality index (income Gini, consumption Gini or Theil index), and 12 papers look at specific income groups like deciles. The others conduct other types of analysis without explicit inequality metrics, but sometimes provide a measure of the impact of climate change on a specific income decile. Most of the latter (18 papers) do not conclude regarding the effect of climate change on inequality, though 9 of these still find a larger effect on the poor (including poor countries or cities). Among the 16 papers providing an inequality index (Theil or Gini), 10 papers find an increase of inequality, 3 papers find mixed results, while only one study finds that climate change leads to a decrease in inequality, one concludes that climate change is distributionally neutral, and one does not provide any explicit conclusion. All of the papers quantifying effects on income deciles find a higher effect of climate change on the poor, though most do not draw conclusions on inequality, since their analysis mostly focuses on the lowest income group. They are mostly conducted at the national or sub-national level, and a majority focuses on agriculture as the impact channel. The studies providing an inequality index are very different in scope (spatial, impact channel) and focus (forward/backward looking analysis, method and range of future projection, etc). Therefore, it is impossible to draw more universal quantitative conclusions from the reported changes in the inequality index. The categorization of outcome provided in table 1 is used to bypass the lack of consistent and comparable income and consumption inequality metrics across papers.
3.4. Climate change increases economic inequality across the main assessment methods
The two main methodological approaches used to quantify the linkages between climate change impacts and economic inequality are econometric methods and simulation-based approaches. Econometric methods are used to study the relationship between selected past weather and climate and socioeconomic outcomes related to inequality. They constitute a large share of the literature on that issue, and the most common single method of our corpus (figure 4, bottom right). The four main single simulation approaches appearing in the corpus are general equilibrium modelling, multi-model approaches, integrated assessment models, and microsimulation. The result that climate change increases inequality or has more impact on the poor is robust across econometric and simulation based approaches (over 70% of the whole corpus in each case, over 80% of studies providing a conclusion on either dimension, figure 4 bottom right). We provide separate results for studies based on historical data (backward-looking) and for studies showing prospective scenarios (forward-looking) in the Extended Data section. Those subsets of studies show similar results to those of the whole corpus (figure 12, see also figures 13–16 for more detailed results).
Finally, using the indicator described in the methods section, we find that there is an agreement on the fact that climate change increases economic inequality or has more impact on the poor for all categories: in each case, that outcome is identified as the dominant one (figure 6, in red). In the case of surveys for instance, the level of agreement is rather low (0.44) compared to other categories of papers. The dominant color is red, meaning that those particular papers still point to a regressive effect of climate change on inequalities, although the level of agreement on that outcome is weaker than for other categories of studies. The overall level of agreement (for all studies providing a conclusion) is 0.79.
4. Discussion
An overwhelming majority of studies find that climate change increases economic inequalities or has more impact on the poor. This result is valid across all regions, physical impacts, sectors, types of inequalities and assessment methods, and is particularly salient in studies comparing the effect of climate change across countries. Due to our conservative approach to paper classification, this result does not rely on studies which show differential impacts of climate change across regions or social groups without explicitly concluding on their effect on inequality. For that reason, the evidence for climate change impacts increasing economic inequality may be even stronger than indicated by our assessment. Indeed, this conservative approach might have led us to under-report the evidence of the regressive effect of climate change on economic inequality because of our decision not to categorise studies that did not make explicit statements on those effects. In the final list of papers, only two studies conclude that climate change decreases inequality, both of which focus on very specific local circumstances [36, 37], and four papers identify the rich, either households [32, 33], counties [34], or countries [35], as being more impacted by climate change, again mostly in very specific settings. The main exceptions are found to be a few studies where rich agents incur higher losses due to the higher size or value of owned physical assets. These papers represent less than 5% of the corpus.
We acknowledge limitations in our methodology. First, there are possible pitfalls related to the choice of keywords in the title and abstract queries. As already mentioned, we aimed to reach a balance between using keywords that bring out the most important papers, while at the same time avoiding the selection of unrelated papers, with the risk of possibly omitting papers that might have been relevant. While we aimed for maximum reproducibility and transparency of the methodology used, several steps along the process of paper screening and selection have involved decisions by the team of authors: some papers were excluded from the final list, for instance if it appeared that they did not present a strong enough link to climate change (cf list of categories presented in section 2). One avenue to possibly address this limitation would be to survey the results using machine learning tools [48]. Machine learning systematic reviews are easly scalable, and exclude human interference, but bring their own intrinsic biases. Those relate in particular to the selection of data used to train the algorithm. The question remains also whether these methods would perform better on all the paper selection criteria, which sometimes are rather subtle and involve expert knowledge beyond text mining. A second limitation of our work relates to the lack of consistent reporting of inequality measures across papers, which means that we are unable to provide a quantitative assessment of the size of the effect of climate change on economic inequality.
This review has been motivated by the need to better understand the distributional dimension of climate change impacts, in order to provide the other side of the coin of the widely discussed distributional effects of climate change mitigation. From a public policy perspective, our analysis calls the attention of policy-makers on the issue of inequality, in particular when designing adaptation plans to climate change. Our results clearly show that climate change impacts are regressive across countries, therefore calling for appropriate and targeted compensatory mechanisms at the international level, in particular through international adaptation finance. This issue is strongly linked to the debate surrounding the implementation of a loss and damage fund, as discussed at COP27. Regarding within country inequalities, national policy-makers need to ensure that adaptation and loss and damage funding is actually directed to low-income households to reduce their vulnerability and improve their resilience to climate change impacts. Addressing future climate change impacts on economic inequalities will require considerable policy change and the deployment of financial resources. The results from this study can help policy-makers better integrate climate risk management components into the design of 'climate-proof' social intervention programs in poor regions, which is particularly vital for achieving climate justice goals. Such social intervention programs can be the provision of insurance for smallholders and other primary sector producers. Labour market interventions such as re-skilling or re-training can also achieve additional resilience to climate risks through the enhancement of the productivity and employability of workers in highly exposed sectors.
To help decision-makers achieve this, future research must provide a more robust quantitative assessment of the effect of climate change on inequality. Our analysis provides a first basis to construct an empirical understanding of the interactions between climate change and global inequality. However, it would need to be complemented in several ways to provide comprehensive and robust quantitative estimates with a global scope, which are needed to eventually include inequality in all of its aspects into integrated assessment modelling, and thus make the link between impacts, adaptation and mitigation to inform policy-making. First, and most importantly, researchers need to systematically provide a clear and explicit assessment of their results in terms of inequality, and compute inequality metrics whenever appropriate, in order to provide a more robust quantitative assessment on the effect of climate change on inequality. Indeed, while the existing case studies reviewed here paint a fairly clear qualitative picture, what is currently lacking is a robust quantification across impact sectors and with global coverage. Such a quantification is needed to put future modelling efforts onto a solid empirical foundation, and as such a robust empirical assessment of the incidence of climate damages on different income groups is a key task in future work. It is also important to understand what the underlying drivers for this heterogeneity are, and if there are other socio-economic characteristics besides income that are key determinants, such as governance, institutions, education, and gender. Second, as our results show that the impacts of climate change increase economic inequalities or are concentrated on the poorest, measuring the impacts of climate change in terms of aggregate dollars hides their actual effect on welfare. Therefore, our analysis calls for using welfare indicators more widely in impact assessments. Third, our review is limited to the economic dimension of inequality, and complementary reviews would be needed to gather a better understanding of the impact of climate change on other dimensions of inequality, such as health, education and access to basic services. There is a need for more representation of social heterogeneity, especially in country-level studies. The lack of such representation could partly explain why a large share of the literature offers no explicit and quantified conclusion on the effect of climate change on inequality. Fourth, we note that only a very small number of studies focus on the Middle-East and Eastern Europe. There is thus a clear need for future research to examine the question of the impact of climate change on economic inequality in these regions. Fifth, further systematic studies would also be needed to complement our understanding on the role of adaptation actions and policies in their possibility to alter the effect of climate change impacts on inequality. The same biophysical impacts affect social groups differently depending on their adaptive capacities, and on the implementation of adaptation. It is important to account for how adaptation may mitigate the effects of climate change on inequality, or on the contrary in which conditions adaptation would exacerbate them, as was documented in cases of maladaptation [49]. Finally, there is a need to link to other areas of economics and social sciences studying inequality, as climate-related inequality interacts with other pre-existing inequalities. This is key to be able to design efficient and equitable policies. The research avenues outlined above could pave the way to a more robust and quantitative understanding of the interactions between climate change and global inequality. As such, it would help to tackle these two challenges together in an integrated and targeted way, and provide a basis to design policies that ensure climate justice for all.
Acknowledgments
This work received funding from the PRISMA project of the European Union's Horizon Europe programme under Grant Agreement 101081604.
Data availability statement
The data that support the findings of this study are openly available at the following URL/DOI: https://doi.org/10.5281/zenodo.10894327.
Conflict of interest
The authors declare that they have no known competing financial interests or personal relationships that could have appeared to influence the work reported in this paper.
Appendix: Extended data
A.1. Queries
The Scopus query is presented below (also summarised on figure 1):
TITLE (climat* OR warming OR temperature OR heat* OR "sea level" OR "coastal erosion" OR extreme OR disast* OR hurricane OR cyclone OR storm OR drought OR flood* OR inundation OR *fire OR precipitation OR rain* OR snow* AND ( inequalit* OR distribut* OR unequal* OR convergence OR *econom* OR gdp OR "gross domestic product" OR income OR (household W/2 consumption) OR expenditure OR wealth OR poverty OR impact))
AND
ABS (climat* OR warming OR temperature OR heat* AND ( inequalit* OR distribut* OR unequal* OR convergence ) AND ( ( household W/2 consumption ) OR income OR expenditure OR wealth OR gdp OR "gross domestic product" OR (economic W/1 inequalit*) OR (economic W/1 damage)))
The following analogous query was run on Web of Science in February 2023 also:
TI = (climat* OR warming OR temperature OR heat* OR "sea level" OR "coastal erosion" OR extreme OR disast* OR hurricane OR cyclone OR storm OR drought OR flood* OR inundation OR *fire OR precipitation OR rain* OR snow*)
AND
TI = (inequalit* OR distribut* OR unequal* OR convergence OR *econom* OR gdp OR "gross domestic product" OR income OR (household NEAR/2 consumption) OR expenditure OR wealth OR poverty OR impact) AND AB = (climat* OR warming OR temperature OR heat*) AND AB = (inequalit* OR distribut* OR unequal* OR convergence) AND AB = ((household NEAR/2 consumption) OR income OR expenditure OR wealth OR gdp OR "gross domestic product" OR (economic NEAR/1 inequalit*) OR (economic NEAR/1 damage))
A.2. Bibliometric information
Figure 7 presents the years of publication and the areas of research of the papers of the corpus.

Figure 7. Year of publication and research area. (a) Number of papers in the corpus according to the year of publication, (b) Number of papers in the corpus by area of research (following Web of Science categories).
Download figure:
Standard image High-resolution imageA.3. Geographical distribution of the corpus
Figure 8 presents the geographical distribution of the country and multi-country studies of the corpus. We note that very few papers focus on the Middle-East and Eastern Europe.

Figure 8. Geographical distribution of the papers identified in the systematic review. This map excludes global studies.
Download figure:
Standard image High-resolution imageA.4. Descriptive statistics
Figure 9 presents the scope, granularity, method, physical impact, channel of impact and type of inequality in the papers of the corpus.

Figure 9. Scope, granularity, method, physical impact considered, channel of impact and type of inequality in the papers of the corpus (number of studies). The x-axis indicates the number of papers in the corpus falling into each category. Note that the bars in each graph do not necessarily sum up to the total number of papers, as some papers may fall into several subcategories. GDP includes GDP per capita; income includes income per capita; consumption includes consumption per capita; other includes poverty, expenditures, flood insurance affordability, surplus, wealth, household commuting costs, insured losses and reconstruction costs, economic exposure. Temperature refers to Mean surface temperature or temperature or heat or extreme heat; Precipitation refers to Mean precipitation or precipitations or increased variability in precipitations or extreme precipitation; SLR refers to relative sea level, coastal erosion, salt water intrusion or coastal floods; Floods refers to floods or river flow; extreme events include typhoons, storms, coastal storms, extreme temperature; Ocean refers to Sea surface temperature, marine heatwave, ocean acidity, mean ocean temperature, marine heatwave, ocean salinity or dissolved oxygen; Other refers to sand and dust storms, CO2 fertilization, wildfires, landslides.
Download figure:
Standard image High-resolution imageA.5. Summary results
Figure 10 gives the characteristics of the studies that conclude that climate change increases economic inequalities or that the poor are more impacted, and those of the studies that conclude that climate change decreases inequalities or that the rich are more impacted.

Figure 10. Characteristics of studies finding that economic inequalities increase or that the poor are more impacted (red), and of studies finding that economic inequalities decrease or that the rich are more impacted (blue). The numbers in brackets give the total number of occurrences in the corpus for each category and outcome. Those numbers may differ from the total number of papers (127) as only a subset of outcomes are presented here. They may even exceed the total number of papers, as some papers may fall into several subcategories, for instance in the case where several types of physical impacts are discussed in a single paper.
Download figure:
Standard image High-resolution imageFigure 11 gives the the evolution of the dominant effect of climate change on economic inequality according to the year of publication. The type of conclusion has become diverse over time, as the number of published papers has increased. Nevertheless, the conclusion that climate change has a regressive effect on economic inequality has remained dominant across time, and even more so if one excludes the papers that provide no conclusion.

Figure 11. Effect of climate change on economic equality according to the year of publication. Note that the y-axis gives the number of occurrences in the corpus. The total number of papers in year 2023 is low due to the cut-off date of the corpus (6 February 2023).
Download figure:
Standard image High-resolution imageA.6. Results for subsets of studies
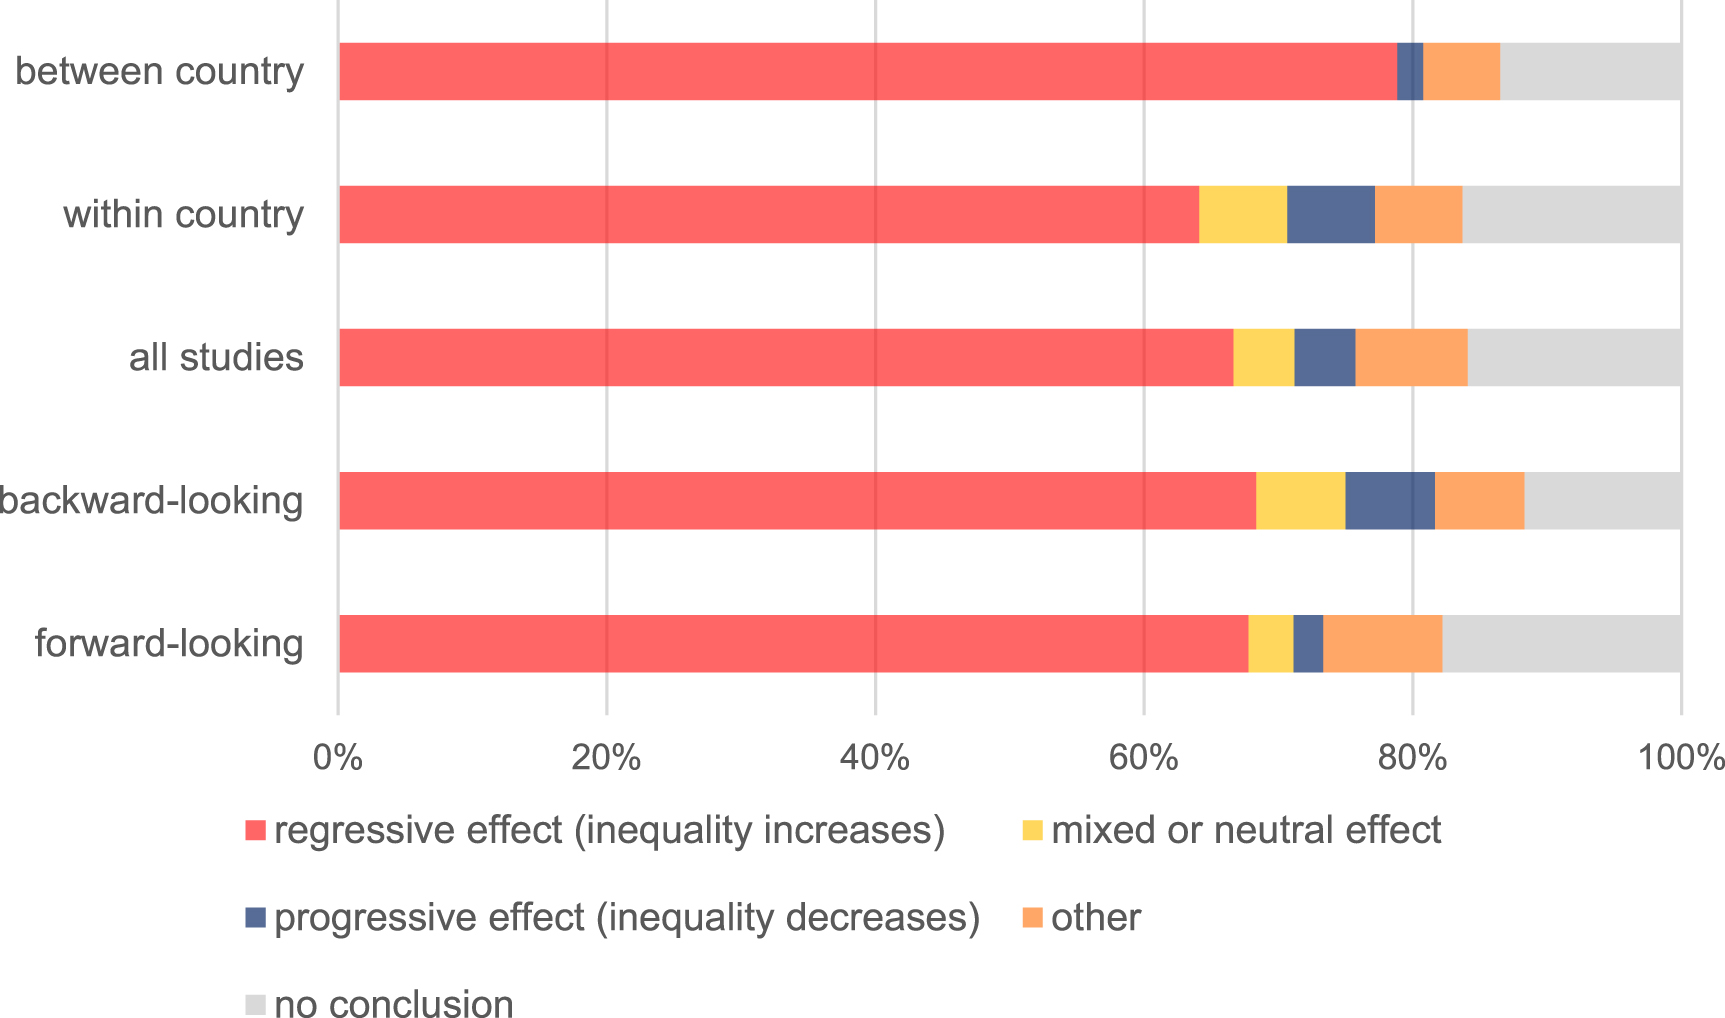
Figures 12–16 give the detailed results of the impact of climate change on inequalities for four subsets of studies, namely backward-looking studies, forward-looking studies, studies focusing on inequalities within countries, and studies focusing on inequalities between countries. Note that some papers examine both within and between country inequalities at the global level (10 papers), 7 of which conclude that climate change increases inequality or that the poor are more impacted, while 2 papers provide no conclusion, and one paper concludes that inequality increases or that the rich are more impacted.
The results for studies based on historical data (backward-looking) and for studies showing prospective scenarios (forward-looking) are very similar to those of the whole corpus (figure 12). There is a larger share of progressive effect results (i.e. decreasing inequalities) in backward-looking studies than in forward-looking studies. However, evidence still points to the fact that climate change has increased economic inequalities in the past or that the poor have been more impacted (68% of all backward-looking studies, 79% of backward-looking studies which provide a conclusion), and that climate change is expected to increase economic inequalities in the future or that the poor will be more impacted (68% of all forward-looking studies, 87% of forward-looking studies which provide a conclusion).

Figure 12. Impact of climate change on economic inequalities in subsets of studies. Note that the x-axis gives the share of occurrences in the corpus.
Download figure:
Standard image High-resolution image
Figure 13. Impact of climate change on economic inequality according to geographical scope.
Download figure:
Standard image High-resolution image
Figure 14. Impact of climate change on economic inequality according to sectors. The number between brackets indicates the total number of occurrences for a given category. The sum of those numbers may differ from the total number of papers (127), as some papers may fall into several subcategories.
Download figure:
Standard image High-resolution image
Figure 15. Impact of climate change on economic inequality according to types of inequality. The number between brackets indicates the total number of occurrences for a given category. The sum of those numbers may differ from the total number of papers (127), as some papers may fall into several subcategories.
Download figure:
Standard image High-resolution image
Figure 16. Impact of climate change on economic inequality according to assessment methods. The number between brackets indicates the total number of occurrences for a given category. The sum of those numbers may differ from the total number of papers (127), as some papers may fall into several subcategories.
Download figure:
Standard image High-resolution image
A.7. Corpus
1. Adjei-MensahK KusimiJ M 2020Dwindling water supplyandits socio-economic impact in Sekyere Kumawu district in Ashanti region of Ghana: public opinion on the role of climate changeGeoJournal851355721355–7210.1007/s10708-019-10026-02. AdomP K AmoaniS 2021The role of climate adaptation readiness in economic growth and climate change relationship: an analysis of the output/income and productivity/institution channelsJ. Environ. Manage.29311292310.1016/j.jenvman.2021.1129233. AggarwalR 2021Impacts of climate shocks on household consumption and inequality in IndiaEnviron. Dev. Econ.26488511488–51110.1017/S1355770X200003884. AlamM M TaufiqueK M R SayalA 2017Do climate changes lead to income inequality? empirical study on the farming community in MalaysiaInt. J. Environ. Sustain. Dev.164310.1504/IJESD.2017.0808485. AlamgirM FuruyaJ KobayashiS BinteM SalamM 2018Farmers' net income distribution and regional vulnerability to climate change: an empirical study of BangladeshClimate66510.3390/cli60300656. AlamgirM S FuruyaJ KobayashiS MostafizR B AhmedM R 2021Farm income, inequality and poverty among farm families of a flood-prone area in Bangladesh: climate change vulnerability assessmentGeoJournal862861852861–8510.1007/s10708-020-10231-27. AlizadehM R et al 2022Increasing heat stress inequality in a warming climateEarth's Future10e2021EF00248810.1029/2021EF0024888. AngelsenA DokkenT 2018Climate exposure, vulnerability and environmental reliance: a cross-section analysis of structural and stochastic povertyEnviron. Dev. Econ.2325778257–7810.1017/S1355770X180000139. ArndtC AsanteF ThurlowJ 2015Implications of climate change for Ghana's economySustainability77214317214–3110.3390/su706721410. ArreyndipN A 2021African continental free trade area (AfCFTA): projected economic impact assessment under future warming in CMIP6Environ. Res. Lett.1609404610.1088/1748-9326/ac1fbd11. AzzarriC SignorelliS 2020Climate and poverty in Africa South of the SaharaWorld Dev.12510469110.1016/j.worlddev.2019.10469112. BaarschF et al 2020The impact of climate change on incomes and convergence in AfricaWorld Dev.12610469910.1016/j.worlddev.2019.10469913. BarbierE B HochardJ P 2018The impacts of climate change on the poor in disadvantaged regionsRev. Environ. Econ. Policy12264726–4710.1093/reep/rex02314. Bayudan-DacuycuyC BajeL K 2019When it rains, it pours? analyzing the rainfall shocks–poverty nexus in the PhilippinesSoc. Indic. Res.145679367–9310.1007/s11205-019-02111-115. BehrerA P ParkR J WagnerG GoljaC M KeithD W 2021Heat has larger impacts on labor in poorer areasEnviron. Res. Commun.309500110.1088/2515-7620/abffa316. BorgomeoE et al 2018The distributional and multi-sectoral impacts of rainfall shocks: evidence from computable general equilibrium modelling for the Awash Basin, EthiopiaEcol. Econ.14662132621–3210.1016/j.ecolecon.2017.11.03817. BreisingerC et al 2013Economic impacts of climate change in SyriaClim. Change Econ.04135000210.1142/S201000781350002418. BurkeM HsiangS M MiguelE 2015Global non-linear effect of temperature on economic productionNature5272359235–910.1038/nature1572519. CallahanC W MankinJ S 2022Globally unequal effect of extreme heat on economic growthSci. Adv.8eadd372610.1126/sciadv.add372620. CallahanC W MankinJ S 2022National attribution of historical climate damagesClim. Change1724010.1007/s10584-022-03387-y21. CalzadillaA RehdanzK TolR S 2011Trade liberalization and climate change: a computable general equilibrium analysis of the impacts on global agricultureWater352650526–5010.3390/w302052622. CalzadillaA et al 2013Climate change impacts on global agricultureClim. Change12035774357–7410.1007/s10584-013-0822-423. CammaranoD et al 2020Integrated assessment of climate change impacts on crop productivity and income of commercial maize farms in northeast South AfricaFood Secur.1265978659–7810.1007/s12571-020-01023-024. CappelliF CostantiniV ConsoliD 2021The trap of climate change-induced "natural" disasters and inequalityGlob. Environ. Change7010232910.1016/j.gloenvcha.2021.10232925. ChakrabortyT HsuA ManyaD SheriffG 2019Disproportionately higher exposure to urban heat in lower-income neighborhoods: a multi-city perspectiveEnviron. Res. Lett.1410500310.1088/1748-9326/ab3b9926. ChenY LiuA ChengX 2020Quantifying economic impacts of climate change under nine future emission scenarios within CMIP6Sci. Total Environ.70313495010.1016/j.scitotenv.2019.13495027. ChenJ et al 2020Global socioeconomic exposure of heat extremes under climate changeJ. Clean. Prod.27712327510.1016/j.jclepro.2020.12327528. CiscarJ-C RisingJ KoppR E FeyenL 2019Assessing future climate change impacts in the EU and the USA: insights and lessons from two continental-scale projects*Environ. Res. Lett.1408401010.1088/1748-9326/ab281e29. CororatonC TiongcoM InocencioA Siriban-ManalangA B LamberteA 2018Climate change, food availability and poverty: the case of Philippine riceDLSU Bus. Econ. Rev.28708370–8330. De CianE HofA F MarangoniG TavoniM VuurenD P v 2016Alleviating inequality in climate policy costs: an integrated perspective on mitigation, damage and adaptationEnviron. Res. Lett.1107401510.1088/1748-9326/11/7/07401531. DePaulaG 2020The distributional effect of climate change on agriculture: evidence from a Ricardian quantile analysis of Brazilian census dataJ. Environ. Econ. Manage.10410237810.1016/j.jeem.2020.10237832. De SilvaM KawasakiA 2018Socioeconomic vulnerability to disaster risk: a case study of flood and drought impact in a rural Sri Lankan communityEcol. Econ.15213140131–4010.1016/j.ecolecon.2018.05.01033. DiffenbaughN S BurkeM 2019Global warming has increased global economic inequalityProc. Natl Acad. Sci.1169808139808–1310.1073/pnas.181602011634. DottoriF et al 2018Increased human and economic losses from river flooding with anthropogenic warmingNat. Clim. Change87816781–610.1038/s41558-018-0257-z35. EboliF ParradoR RosonR 2010Climate-change feedback on economic growth: explorations with a dynamic general equilibrium modelEnviron. Dev. Econ.1551533515–3310.1017/S1355770X1000025236. ElslerL G et al 2021Social relationship dynamics mediate climate impacts on income inequality: evidence from the Mexican Humboldt squid fisheryReg. Environ. Change213510.1007/s10113-021-01747-537. EskanderS M S U FankhauserS 2022Income diversification and income inequality: household responses to the 2013 floods in PakistanSustainability1445310.3390/su1401045338. EstradaF BotzenW J W 2021Economic impacts and risks of climate change under failure and success of the Paris agreementAnn. New York Acad. Sci.15049511595–11510.1111/nyas.1465239. FantC et al 2020Climate change impacts and costs to U.S. electricity transmission and distribution infrastructureEnergy19511689910.1016/j.energy.2020.11689940. FengL LiuW ZhaoZ WangY 2023Rainfall fluctuations and rural poverty: evidence from Chinese county level dataEcon. Trans. Inst. Change3163356633–5610.1111/ecot.1235141. Ferreira FilhoJ B d S MoraesG I d 2015Climate change, agriculture and economic effects on different regions of BrazilEnviron. Dev. Econ.20375637–5610.1017/S1355770X1400012642. FuruyaJ KobayashiS YamauchiK 2014Impacts of climate change on rice market and production capacity in the lower mekong basinPaddy Water Environ.1225574255–7410.1007/s10333-013-0394-y43. GholizadehH ZoghipourM H TorshiziM NazariM R MoradkhaniN 2021Gone with the wind: impact of soil-dust storms on farm incomeEcol. Econ.18810713310.1016/j.ecolecon.2021.10713344. GoharA A CashmanA 2018Exploring the economic impacts of adapting abstraction policies in response to climate change and variability: application for small island developing statesClim. Dev.10687700687–70010.1080/17565529.2017.141008345. GourevitchJ D DiehlR M WempleB C RickettsT H 2022Inequities in the distribution of flood risk under floodplain restoration and climate change scenariosPeople Nat.441527415–2710.1002/pan3.1029046. GulF JanD AshfaqM 2019Assessing the socio-economic impact of climate change on wheat production in Khyber Pakhtunkhwa, PakistanEnviron. Sci. Pollut. Res.266576856576–8510.1007/s11356-018-04109-747. HaddadE A FarajallaN CamargoM LopesR L VieiraF V 2014Climate change in Lebanon: higher-order regional impacts from agricultureRegion19249–2410.18335/region.v1i1.1948. HallegatteS RozenbergJ 2017Climate change through a poverty lensNat. Clim. Change72506250–610.1038/nclimate325349. HarringtonL J et al 2016Poorest countries experience earlier anthropogenic emergence of daily temperature extremesEnviron. Res. Lett.1105500710.1088/1748-9326/11/5/05500750. HeC et al 2022The inequality labor loss risk from future urban warming and adaptation strategiesNat. Commun.13384710.1038/s41467-022-31145-251. HertelT W BurkeM B LobellD B 2010The poverty implications of climate-induced crop yield changes by 2030Glob. Environ. Change2057785577–8510.1016/j.gloenvcha.2010.07.00152. HounnouF E DedehouanouH ZannouA AgbaheyJ BiaouG 2019Economy-wide effects of climate change in Benin: an applied general equilibrium analysisSustainability11656910.3390/su1123656953. HsiangS et al 2017Estimating economic damage from climate change in the United StatesScience356136291362–910.1126/science.aal436954. IannellaM De SimoneW D'AlessandroP BiondiM 2021Climate change favours connectivity between virus-bearing pest and rice cultivations in sub-Saharan Africa, depressing local economiesPeerJ9e1238710.7717/peerj.1238755. IbarraránM E RuthM AhmadS LondonM 2009Climate change and natural disasters: macroeconomic performance and distributional impactsEnviron. Dev. Sustain.1154969549–6910.1007/s10668-007-9129-956. IslamM M NipaT A IslamM S HasanM KhanM I 2022Economic and non-economic loss and damage to climate change: evidence from a developing country shrimp farms to cyclone BulbulFish. Aquat. Sci.2521430214–3010.47853/FAS.2022.e2057. JacobyH G RabassaM SkoufiasE 2015Distributional implications of climate change in rural India: a general equilibrium approachAm. J. Agric. Econ.971135561135–5610.1093/ajae/aau08458. JuanaJ S MangadiK T StrzepekK M 2012The socio-economic impacts of climate change on water resources in South AfricaWater Int.3726578265–7810.1080/02508060.2012.68750559. KilgarriffP McDermottT K J VegaA MorrisseyK O'DonoghueC 2019The impact of flooding disruption on the spatial distribution of commuter's incomeJ. Environ. Econ. Policy8486448–6410.1080/21606544.2018.150209860. KjellstromT 2016Impact of climate conditions on occupational health and related economic losses: a new feature of global and urban health in the context of climate changeAsia Pac. J. Public Health2828S37S28S–37S10.1177/101053951456871161. KotzM LevermannA WenzL 2022The effect of rainfall changes on economic productionNature6012237223–710.1038/s41586-021-04283-862. LemoineD KapnickS 2016A top-down approach to projecting market impacts of climate changeNat. Clim. Change6515551–5510.1038/nclimate275963. LettaM MontalbanoP TolR S 2018Temperature shocks, short-term growth and poverty thresholds: evidence from rural TanzaniaWorld Dev.112133213–3210.1016/j.worlddev.2018.07.01364. LiQ SunP LiB MohiuddinM 2022Impact of climate change on rural poverty vulnerability from an income source perspective: a study based on CHIPS2013 and county-level temperature data in ChinaInt. J. Environ. Res. Public Health19332810.3390/ijerph1906332865. LimW H et al 2018Long-term changes in global socioeconomic benefits of flood defenses and residual risk based on CMIP5 climate modelsEarth's Future693854938–5410.1002/2017EF00067166. LiuY ChenJ 2021Future global socioeconomic risk to droughts based on estimates of hazard, exposure and vulnerability in a changing climateSci. Total Environ.75114215910.1016/j.scitotenv.2020.14215967. LiuY et al 2020Climate change effects on agricultural production: the regional and sectoral economic consequences in ChinaEarth's Future8e2020EF00161710.1029/2020EF00161768. LiuY ChenJ 2021Socioeconomic risk of droughts under a 2.0∘C warmer climate: assessment of population and GDP exposures to droughts in ChinaInt. J. Climatol.41E38091E380–9110.1002/joc.669169. Lopez-FeldmanA 2013Climate change, agriculture and poverty: a household level analysis for rural MexicoEcon. Bull.331126391126–3970. ManuelL ChizianeO MandhlateG HartleyF TostãoE 2021Impact of climate change on the agriculture sector and household welfare in Mozambique: an analysis based on a dynamic computable general equilibrium modelClim. Change167610.1007/s10584-021-03139-471. MelvinA M et al 2017Climate change damages to Alaska public infrastructure and the economics of proactive adaptationProc. Natl Acad. Sci.114E12231E122–3110.1073/pnas.161105611372. MendelsohnR DinarA WilliamsL 2006The distributional impact of climate change on rich and poor countriesEnviron. Dev. Econ.1115978159–7810.1017/S1355770X0500275573. MendelsohnR BasistA KurukulasuriyaP DinarA 2007Climate and rural incomeClim. Change8110118101–1810.1007/s10584-005-9010-574. MideksaT K 2010Economic and distributional impacts of climate change: the case of EthiopiaGlob. Environ. Change2027886278–8610.1016/j.gloenvcha.2009.11.00775. MooreF C DiazD B 2015Temperature impacts on economic growth warrant stringent mitigation policyNat. Clim. Change512731127–3110.1038/nclimate248176. MulwaR RaoK GummadiS KilaviM 2016Impacts of climate change on agricultural household welfare in KenyaClim. Res.67879787–9710.3354/cr0135777. NazarethM S GurgelA C da CunhaD A 2022Economic effects of projected decrease in Brazilian agricultural productivity under climate changeGeoJournal8795770957–7010.1007/s10708-020-10286-178. NewellR G PrestB C SextonS E 2021The GDP-temperature relationship: implications for climate change damagesJ. Environ. Econ. Manage.10810244510.1016/j.jeem.2021.10244579. NgepahN Tchuinkam DjemoC R SabaC S 2022Forecasting the economic growth impacts of climate change in South Africa in the 2030 and 2050 horizonsSustainability14829910.3390/su1414829980. NgepahN Conselho MwiingaR 2022The impact of climate change on gender inequality in the labour market: a case study of South AfricaSustainability141313110.3390/su14201313181. Ogbeide-OsaretinE N OrhewereB EbhoteO AkhorS O ImideI O 2022Climate change, poverty and income inequality linkage: empirical evidence from NigeriaInt. J. Energy Econ. Policy1233241332–4110.32479/ijeep.1355682. OsberghausD AbelingT 2022Heat vulnerability and adaptation of low-income households in GermanyGlob. Environ. Change7210244610.1016/j.gloenvcha.2021.10244683. PaglialungaE CoveriA ZanfeiA 2022Climate change and within-country inequality: new evidence from a global perspectiveWorld Dev.15910603010.1016/j.worlddev.2022.10603084. PalagiE CoroneseM LampertiF RoventiniA 2022Climate change and the nonlinear impact of precipitation anomalies on income inequalityProc. Natl Acad. Sci.119e220359511910.1073/pnas.220359511985. ParkJ BangaloreM HallegatteS SandhoefnerE 2018Households and heat stress: estimating the distributional consequences of climate changeEnviron. Dev. Econ.2334968349–6810.1017/S1355770X1800013X86. PauwK ThurlowJ BachuM Van SeventerD E 2011The economic costs of extreme weather events: a hydrometeorological CGE analysis for MalawiEnviron. Dev. Econ.1617798177–9810.1017/S1355770X1000047187. PerezL P Rodrigues-FilhoS MarengoJ A SantosD V MikoszL 2020Climate change and disasters: analysis of the Brazilian regional inequalitySustain. Debate1126096260–9610.18472/SustDeb.v11n3.2020.3381388. PonceR D FernándezF StehrA Vásquez-LavínF Godoy-FaúndezA 2017Distributional impacts of climate change on basin communities: an integrated modeling approachReg. Environ. Change171811211811–2110.1007/s10113-017-1152-289. PonceR BlancoM GiupponiC 2014The economic impacts of climate change on the Chilean agricultural sector. A non-linear agricultural supply modelChil. J. Agri. Res.7440412404–1210.4067/S0718-5839201400040000590. PorioE 2014Climate change vulnerability and adaptation in metro ManilaAsian J. Soc. Sci.427510275–10210.1163/15685314-0420100691. PretisF SchwarzM TangK HausteinK AllenM R 2018Uncertain impacts on economic growth when stabilizing global temperatures at 1.5∘C or 2∘C warmingPhil. Trans. R. Soc. A 3762016046010.1098/rsta.2016.046092. QuirogaS SuárezC 2016Climate change and drought effects on rural income distribution in the Mediterranean: a case study for SpainNat. Haz. Earth Syst. Sci.161369851369–8510.5194/nhess-16-1369-201693. ReidH SahlénL StageJ MacGregorJ 2008Climate change impacts on Namibia's natural resources and economyClim. Policy845266452–6610.3763/cpol.2008.052194. RezaiA TaylorL FoleyD 2018Economic growth, income distribution and climate changeEcol. Econ.14616472164–7210.1016/j.ecolecon.2017.10.02095. RosonR SartoriM 2016Estimation of climate change damage functions for 140 regions in the GTAP 9 databaseJ. Glob. Econ. Anal.17811578–11510.21642/JGEA.010202AF96. SaeedW et al 2022The poverty impacts of labor heat stress in West Africa under a warming climateEarth's Future10e2022EF00277710.1029/2022EF00277797. SantosC V d OliveiraA F d Ferreira FilhoJ B d S 2022Potential impacts of climate change on agriculture and the economy in different regions of BrazilRev. Econ. Soc. Rural60e22061110.1590/1806-9479.2021.22061198. SassiM CardaciA 2013Impact of rainfall pattern on cereal market and food security in Sudan: stochastic approach and CGE modelFood Policy4332131321–3110.1016/j.foodpol.2013.06.00299. SawadogoB 2022Drought impacts on the crop sector and adaptation options in Burkina Faso: a gender-focused computable general equilibrium analysisSustainability141563710.3390/su142315637100. SchmidtE GilbertR HoltemeyerB MahrtK 2021Poverty analysis in the lowlands of Papua New Guinea underscores climate vulnerability and need for income flexibility*Aust. J. Agri. Resour. Econ.6517191171–9110.1111/1467-8489.12404101. SequeiraT N SantosM S MagalhãesM 2018Climate change and economic growth: a heterogeneous panel data approachEnviron. Sci. Pollut. Res.25227253522725–3510.1007/s11356-018-2305-7102. SilvaJ A MatyasC J CunguaraB 2015Regional inequality and polarization in the context of concurrent extreme weather and economic shocksAppl. Geogr.6110516105–1610.1016/j.apgeog.2015.01.015103. SmileyK T et al 2022Social inequalities in climate change-attributed impacts of Hurricane HarveyNat. Commun.13341810.1038/s41467-022-31056-2104. StevanovićM et al 2016The impact of high-end climate change on agricultural welfareSci. Adv.2e150145210.1126/sciadv.1501452105. SuhD PomeroyR 2020Projected economic impact of climate change on marine capture fisheries in the PhilippinesFront. Mar. Sci.723210.3389/fmars.2020.00232106. SunY XuC ZhangH WangZ 2017Migration in response to climate change and its impact in ChinaInt. J. Clim. Change Strateg. Manage.935273352–7310.1108/IJCCSM-05-2016-0061107. TaconetN MéjeanA GuivarchC 2020Influence of climate change impacts and mitigation costs on inequality between countriesClim. Change160153415–3410.1007/s10584-019-02637-w108. TebaldiE BeaudinL 2016Climate change and economic growth in BrazilAppl. Econ. Lett.2337781377–8110.1080/13504851.2015.1076141109. TibesigwaB VisserM TurpieJ 2015The impact of climate change on net revenue and food adequacy of subsistence farming households in South AfricaEnviron. Dev. Econ.2032753327–5310.1017/S1355770X14000540110. TolR S 2021The distributional impact of climate changeAnn. New York Acad. Sci.1504637563–7510.1111/nyas.14497111. TolR S 2002Estimates of the damage costs of climate change - part II. Dynamic estimatesEnviron. Resour. Econ.2113560135–6010.1023/A:1014539414591112. TolR S DowningT E KuikO J SmithJ B 2004Distributional aspects of climate change impactsGlob. Environ. Change1425972259–7210.1016/j.gloenvcha.2004.04.007113. TolR S J 2018The economic impacts of climate changeRev. Environ. Econ. Policy124254–2510.1093/reep/rex027114. TolR S J 2010The economic impact of climate change: the economic impact of climate changePerspekt. Wirtsch.11133713–3710.1111/j.1468-2516.2010.00326.x115. UramaN E EbohE C OnyekuruA 2019Impact of extreme climate events on poverty in Nigeria: a case of the 2012 floodClim. Dev.11273427–3410.1080/17565529.2017.1372267116. WangT TengF ZhangX 2020Assessing global and national economic losses from climate change: a study based on CGEM-IAM in ChinaClim. Change Econ.11204100310.1142/S2010007820410031117. WibbenmeyerM RobertsonM 2022The distributional incidence of wildfire hazard in the western United StatesEnviron. Res. Lett.1706403110.1088/1748-9326/ac60d7118. WiltsR LatkaC BritzW 2021Who is most vulnerable to climate change induced yield changes? a dynamic long run household analysis in lower income countriesClim. Risk Manage.3310033010.1016/j.crm.2021.100330119. WintersP MurgaiR SadouletE de Janvry*A FrisvoldG 1998Economic and welfare impacts of climate change on developing countriesEnviron. Resour. Econ.121241–2410.1023/A:1008204419284120. WossenT BergerT HaileM G TroostC 2018Impacts of climate variability and food price volatility on household income and food security of farm households in East and West AfricaAgric. Syst.1637157–1510.1016/j.agsy.2017.02.006121. WunderS NoackF AngelsenA 2018Climate, crops and forests: a pan-tropical analysis of household income generationEnviron. Dev. Econ.2327997279–9710.1017/S1355770X18000116122. YinJ et al 2023Future socio-ecosystem productivity threatened by compound drought-heatwave eventsNat. Sustain.625972259–7210.1038/s41893-022-01024-1123. YuanX-C YangZ WeiY-M WangB 2020The economic impacts of global warming on Chinese citiesClim. Change Econ.11205000710.1142/S2010007820500074124. YuanB CuiY WangX XuH 2022Study on the heterogeneity of China's agricultural economic growth in the context of temperature shocksSci. Rep.121051110.1038/s41598-022-11877-3125. ZhangT et al 2022Increased wheat price spikes and larger economic inequality with 2∘C global warmingOne Earth590716907–1610.1016/j.oneear.2022.07.004126. ZhouL TurveyC G 2015Climate risk, income dynamics and nutrition intake in rural ChinaChina Agric. Econ. Rev.7197220197–22010.1108/CAER-09-2013-0131127. ZidouembaP R 2017Economy-wide implications of climate change in Burkina FasoEcon. Bull.3727978082797–808Footnotes
- 4
We exclude here considerations of procedural justice, which concerns the processes by which achievements (such as being well-nourished or healthy) are distributed.