

Abstract
Long-term (2005–2021) observations from the World Wide Lightning Location Network reveal significantly larger flash counts over heavily trafficked shipping lanes in the northeastern Indian Ocean compared to nearby regions. Here, we use the online coupled meteorology-chemistry model WRF-Chem to examine the impact of aerosols from shipping emissions on lightning activity over one of the world's busiest shipping lanes (5–7° N, 82–92° E). We conduct three case simulations in January 2013, 2015, and 2018 when frequent lightning activities were recorded. The WRF-Chem model with lightning parameterized based on convective cloud-top height captures the temporal evolution of lightning activities but overestimates the magnitude of lightning counts. We find that all three cases consistently show enhanced lightning flash counts due to shipping-induced aerosols by 6.2%–22.3%, accompanied by increased cloud droplet number, cloud water concentration, radar reflectivity, and cloud-top height. Sensitivity simulations show that aerosol-cloud-interactions from shipping aerosols consistently enhance the strength of convection and lightning frequency in all three cases, by increasing cloud condensation nuclei and cloud droplet numbers, delaying precipitation of cloud water, allowing the lift and accumulation of water vapor, increasing release of latent heat, and finally invigorating convections. In comparison, aerosol-radiation-interactions show inconsistent contributions to convection and lightning, which enhance lightning frequency in the 2013 and 2015 cases but decrease lightning frequency in the 2018 case. This inconsistency may be attributed to differences in the number and vertical structure of shipping aerosols and cloud droplet in the three cases. Our study thus approves the certain but complicated anthropogenic impacts on lightning activities through shipping-induced aerosols, which has important implications for understanding future trends in lightning and its impact on atmospheric chemistry and climate.
Export citation and abstract BibTeX RIS

Original content from this work may be used under the terms of the Creative Commons Attribution 4.0 license. Any further distribution of this work must maintain attribution to the author(s) and the title of the work, journal citation and DOI.
1. Introduction
Lightning originates from the electrification of cumulonimbus clouds in thunderstorms (Williams 2005). It causes loss of human life and property, and influences ecosystems, atmospheric chemistry, and the Earth's climate system (Schumann and Huntrieser 2007). Lightning perturbs the ecosystem by modulating the amount of fixed nitrogen in the biosphere (Galloway et al 2004) and by igniting natural wildfires (Krause et al 2014, Pineda et al 2014). Lightning is also the dominant source of nitric oxides (NOx ) in the free troposphere, generating ozone and hydroxyl radical (OH), and thus regulates the atmospheric oxidation capacity and the lifetime of greenhouse gases such as methane (Murray 2016, Finney et al 2018). Its chemical impacts are particularly important over remote tropical oceans where terrestrial sources of NOx are small and photochemistry is active. Here we investigate how shipping emissions influence lightning activity over tropical oceans.
The occurrence of lightning activities is closely tied to the development of convection. Anthropogenic aerosols can affect convection through aerosol-radiation interactions (ARIs) and aerosol-cloud interactions (ACIs) (Rosenfeld et al 2008, Storer et al 2010, Fan et al 2016, Zhang et al 2020, Varble et al 2023) and finally modulate the frequency of lightning. Research on their influences on lightning activity, however, is much less partly due to the much fewer available observations of lightning counts compared to precipitations. Existing studies have revealed possible linkages between aerosols and lightning frequency over land from observations (Lyons et al 1998, Naccarato et al 2003, Altaratz et al 2010, Alizadeh-Choobari and Gharaylou 2017, Blossey et al 2018). Wang et al (2011) showed that high aerosol loading tended to enhance the frequency of heavy rainfalls and lightning strikes over a megacity in China, and attributed the enhancement to changes in cloud microphysics and the release of latent heat released by aerosols. Wang et al (2022), however, presented the different aerosol effects on cloud-to-ground lightning during daytime (inhibit lightning) versus nighttime (no significant impacts) over the polluted Sichuan Basin, and proposed that such a difference could be explained by ARIs. These studies indicate that the impacts of aerosols on lightning vary depending on factors such as background aerosol levels, timing of lightning (daytime vs nighttime), convection strength, etc. Nevertheless, these variations and the underlying mechanisms have not yet been reconciled in current research.
Oceanic areas are ideal regions for studying the aerosol-lightning relationship as thermodynamic contrast is much less distinct over oceanic regions compared to continental areas (Yuan et al 2011, Liu et al 2020). Thornton et al (2017) found significantly higher lightning counts over major oceanic shipping lanes compared to nearby regions and hypothesized that the more active lightning may be attributed to shipping-induced aerosols, but the underlying physical mechanism has not been identified. In particular, it remains rather unclear whether ACIs and ARIs would counteract in modulating oceanic lightning activity as shown in studies over land. As shipping activities, the major anthropogenic sources of aerosols over oceans, are expected to explode with global trade expansion (Wang et al 2021), it becomes increasingly important to examine their impacts on the oceanic atmosphere through modulating convections and lightning activities.
In this study, we examine the role of shipping-induced aerosols in lightning activities over one of the world's busiest shipping lanes located in the northeastern Indian Ocean, based on 17 yr observations of flash counts and numerical simulation using an online-coupled meteorology-chemistry coupled model. We focus on this region because it is covered by high-quality and long-lasting observations of lightning flashes, and here shipping emissions are the dominant anthropogenic sources. We use the model simulation to quantify the aerosol impact on the lightning frequency and explore the underlying mechanism by separating the role of ACIs and ARIs.
2. Materials and methods
2.1. Observation data and region of interest
We apply global observations of lightning strokes from the ground-based World Wide Lightning Location Network (WWLLN) (Virts et al 2013). WWLLN locates lightning strokes using radio receivers distributed across the world. The observation network was initiated in 2003 with 11 sensors (Lay 2004), with the number of sensors increasing to more than 70 in 2013, providing the world's longest record for global lightning observations. These sensors detect impulsive signals from lightning discharges that have steadily propagated in the Earth–ionosphere waveguide within a time window of one microsecond, and each sensor can cover lightning strokes within a distance of about 3000 km (Dowden et al 2002). WWLLN detects very low-frequency ratio (VLF) in lightning and preferentially detects cloud-to-ground (CG) strokes due to its higher VLF value (Rodger et al 2009, Virts et al 2013). Comparison of WWLLN observations with satellite-based observation systems (e.g. the lightning imaging sensor and the optical transient detector satellite instruments, LIS/OTD) and local lightning detection network at overlapping observational years suggests that these observational networks are generally consistent in the magnitude and spatiotemporal distribution of lightning frequencies (Lay 2004, Jacobson et al 2006, Bürgesser et al 2017).
We follow Thornton et al (2017) to focus on lightning activities over the northeastern Indian Ocean, which covers one of the most heavily trafficked shipping lanes in the world. Figure 1 shows the shipping emissions of fine particulate matter (PM2.5) from the Emissions Database for Global Atmospheric Research (EDGAR) and the observed annual mean lightning frequency over this region averaged over 2005–2021. The WWLLN observation clearly shows the hotline of lightning frequency along the shipping lane region centered at around 6° N (5–7° N, 82–92° E), compared to an adjacent reference region (7–9° N, 82–92° E) covered by comparable amounts of sensors (figure 1(b)). Figure 1(c) further shows that the lightning frequency over shipping lanes is about 20%–100% higher compared with that in the reference region during 2005–2021. Such difference is especially notable in years 2013, 2015, and 2018. Since the two oceanic regions are geographically close to each other, we propose that the large difference in lightning frequency between the two regions is more likely due to shipping-induced aerosols which modulate the strength of convection, rather than large-scale meteorological conditions. We also see an increasing trend of lightning activities in the shipping lane region that might be driven by increasing ship emissions, as also proposed by Thornton et al (2017), but this may partly reflect the trend in the detection capability with the increasing number of sensors.
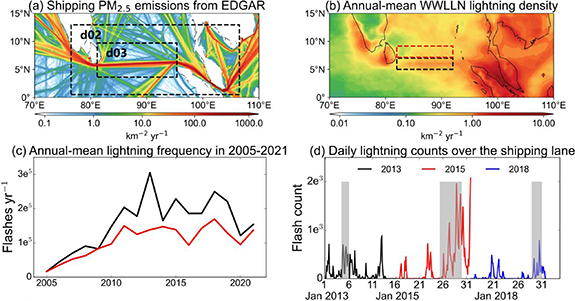
Figure 1. Observed larger lightning frequency over the major shipping lane over the northeastern Indian Ocean compared to adjacent regions. Panel (a) shows the shipping emissions of fine particle matter (PM2.5) from the Emissions Database for Global Atmospheric Research (EDGAR) inventory in 2015. Also shown are the three nested modeling domains in the WRF-Chem model. Panel (b) shows the WWLLN annual mean lightning frequency averaged over 2005–2021 over the northeastern India Ocean shipping lanes (black box, 82–92° E, 5–7° N) and the reference region (red box, 82–92° E, 7–9° N). Panel (c) compares the 2005–2021 time series of annual WWLLN lightning frequency summed over the northeastern India Ocean shipping lanes (black solid line) and the reference region (red solid line). Panel (d) shows daily variability in lightning frequency over the shipping lane in the northeastern Indian Ocean (black boxes in Panel (b)) in January 2013, 2015, and 2018, observed from the WWLLN network. The grey shading represents the periods simulated by the WRF-Chem model.
Download figure:
Standard image High-resolution image2.2. WRF-Chem model simulation
We use the Weather Research and Forecasting model coupled with Chemistry (WRF‐Chem) version 3.6.1 to interpret lightning activities and the impact of shipping emissions. WRF-Chem is an online-coupled meteorology-chemistry model (Grell et al 2005, Fast et al 2006, Powers et al 2017), in which aerosols released and/or chemically generated from shipping emissions can interact with radiation as well as the cloud thermodynamics and microphysics. We design three nested modeling domains centered on the shipping lanes in the northeastern Indian Ocean as shown in figure 1(a). The horizontal resolutions and grid numbers for the three domains are 36 km with 112 × 111 grids, 12 km with 277 × 118 grids, and 4 km with 394 × 172 grids, from the outermost and innermost domains, respectively. We set 50 vertical layers from surface to top pressure at 50 hPa for each domain. Meteorological initial and boundary conditions are provided by the National Centers for Environmental Prediction FNL (Final) Operational Global Analysis data at 1° × 1° resolution. We acknowledge that using the FNL data as initial meteorological fields has inevitably introduced some impacts of shipping emissions on initial background meteorological conditions by assimilating in-situ and remote sensing observations. However, as our study focuses on the short-term responses of convections and lightning activities to shipping emissions, we suggest that the initial meteorological conditions should not significantly affect such response if the model spin-up time is sufficiently long compared to the lifetime of a typical concentration system. We also do not apply any nudging techniques in the simulation to avoid the influence of data assimilation on the results during the simulation period. The initial and lateral boundary chemical conditions are archived from the global simulation using the model for ozone and related chemical tracers model.
The physical and chemical schemes used in our WRF-Chem simulation are listed in table S1. Specifically, we use the 8-bin version of the model for simulating aerosol interactions and chemistry (MOSAIC) for aerosols including sea salts and dust (Zaveri et al 2008), the Lin scheme for microphysics (Lin et al 1983). The MOSAIC module assumes aerosols to be internally mixed so that all particles within a bin have the same chemical composition, while particles in different bins are externally mixed (Zaveri et al 2008). We use the Grell 3D ensemble cumulus scheme (Grell and Devenyi 2002) for the outermost two domains with resolution coarser than 10 km where a convective parameterization is necessary, and do not use the cumulus scheme for the innermost domain since the convective processes can be explicitly solved at a resolution of 4 km (Kain et al 2008). The parameterization of lightning activity is closely related to the convective process that will be described in section 2.3.
Anthropogenic emissions are from the EDGAR (https://edgar.jrc.ec.europa.eu/) inventory. EDGAR provides monthly mean shipping emissions from 1970–2018 at 0.1° × 0.1° spatial resolution for SO2, NOx , CO, total non-methane volatile organic compounds (NMVOCs), NH3, as well as particulate matter compounds, including PM2.5, PM10, black carbon (BC), and organic carbon (OC) (Crippa et al 2016). The shipping emissions in EDGAR are derived based on real-time shipping information from the automatic identification system (AIS) and emission factors (Lack et al 2009). The emissions inventories are then a sum over emission factors scaled by the fuel usage statistics derived from the shipping activity databases. Nevertheless, uncertainties in the shipping information (tracks, fuel type, vessel type, etc) recorded in the AIS database and emission factors may contribute to the uncertainties in the EDGAR shipping emission inventory (Russo et al 2018, Mao et al 2020). The EDGAR inventory also does not include the daily variation of shipping emissions. This limits the model's ability to capture the daily variations in shipping's impact on lightning activity. The model does not implement an online plume model for the shipping emissions (Mao et al 2021).
Figure 1(c) shows that 2013, 2015, and 2018 are the years with the highest lightning frequency over the shipping lane of our interest. Examination of its monthly variation suggests that the lightning activities in this region peak in the boreal winter due to the southward mitigation of the intertropical convergence zone (figure S1). The shipping emissions in January 2013, 2015, and 2018 are 92.9%, 99.9%, and 107.3% compared to the 2010–2018 mean, suggesting that the high lightning frequency in these years is not solely due to differences in shipping emissions. We thus choose three periods with relatively high lightning flash counts scattered in January 2013 (4–6 January), 2015 (25–29 January), and 2018 (28–31 January) as the cases for WRF-Chem simulation (figure 1(d)). We follow previous studies (Federico et al 2014, Gharaylou et al 2020, Guo et al 2022) to set the first 12 h in each simulation for spin-up to allow the meteorological conditions to be adjusted to different scenarios.
2.3. Parameterization of lightning in WRF-Chem
The lightning parameterization used in WRF-Chem is based on cloud-top height ( ) (Price and Rind 1992, hereafter PR92), which has been widely implemented in atmospheric chemistry models (Wang et al
2011, Murray et al
2012). Based on the framework of Vonnegut (1963) and Williams (1985), the lightning frequency in PR92 parameterization is established to be proportional to the fifth-power of convective cloud-top height. Michalon et al (1999) further modified the equation from PR92 for marine flash (
) (Price and Rind 1992, hereafter PR92), which has been widely implemented in atmospheric chemistry models (Wang et al
2011, Murray et al
2012). Based on the framework of Vonnegut (1963) and Williams (1985), the lightning frequency in PR92 parameterization is established to be proportional to the fifth-power of convective cloud-top height. Michalon et al (1999) further modified the equation from PR92 for marine flash ( ):
):


The WRF-Chem model determines the cloud-top height  based on the level of neutral buoyancy, which is calculated based on the Grell–Devenyi convective parameterization. In the innermost domain where the cumulus scheme is turned off, we determine the top level with radar reflectivity larger than 20 dBZ as
  instead. A fixed but region-varied intra-cloud (IC):CG ratio is applied to separate IC and CG flashes in the WRF-Chem model according to Boccippio et al (2001) to match lightning measurements.
The model uses equations (1) and (2) to calculate the flash rate for continental and marine clouds in every timestep ( ), and returns the accumulated lightning counts (
 ) in each model grid as

However, since the model calculates total lightning counts instead of lightning density in each model grid, the simulated frequency derived from lightning counts is grid-scale dependent, i.e. the lightning frequency is bound to the resolution (area) of the model grid. We follow Wong et al (2013) to apply a factor ( ) introduced by Price and Rind (1994) to the simulated flash rate at each model grid. The factor is a function of model grid size, given as:

where  is the grid area in squared degrees, and
  represents the resulting factor scale to the flash rate at the given grid resolution. We note that, however, model at grid resolution within 4–6 km is less influenced by this grid-scale dependence since the initial cloud-top height parameterization is based on radar data at a resolution of 5 km (Williams 1985).
2.4. Model sensitivity simulations
Our Base simulation applies the above settings that include shipping emissions and fully considers both ARIs and ACIs. We also conduct seven sensitivity simulations to assess the influence of shipping emissions on lightning frequency separately through ARIs and ACIs, by excluding shipping emissions in the model simulation and inactivating ARIs and/or ACIs (table S2).
Simulations A (Base simulation) and B, with both ARIs and ACIs available but shipping emissions turned on and off, respectively, quantify the integrated influence of shipping emissions on lightning frequency. ACIs are simulated by linking prognostic aerosols to cloud condensation nuclei (CCN). We use a prescribed cloud droplet number concentration of 10 cm−3 to exclude ACIs in sensitivity simulations C and D, following previous studies (Zhao et al 2017, Zhang et al 2018, Zhou et al 2019). This intends to assess the contribution of ACIs to lightning frequency from shipping emissions. ARIs are simulated by linking aerosol optical properties (such as aerosol optical depth (AOD), single scattering albedo, and asymmetry factor) to the radiation scheme (Chapman et al 2009). We conduct simulations with ARIs turned off in the presence (simulation E) and absence (simulation F) of shipping emissions to investigate the contribution of ARIs to lightning frequency from shipping emissions. Absorbing aerosols (such as BC) also influence cloud distribution by modifying atmospheric temperature profiles, known as the aerosol semi-direct effect. In this study, ARI's impact quantified as the difference between simulations E and F also included the aerosol semi-direct effect (Zhang et al 2018). We additionally conduct simulations G1/G2 by inactivating ARIs and ACIs in the presence/absence of shipping emissions, in order to verify whether shipping emissions will influence lightning frequency if there is no aerosol-climate feedback. All these simulations are conducted for the three selected cases in 2013, 2015, and 2018.
3. Results and discussions
3.1. Evaluation of AOD, precipitation, and lightning flash counts in WRF-Chem simulation
Figures 2 and S2–S4 evaluate the simulated AOD, daily precipitation, and lightning flash counts in the shipping lanes region (5–7° N, 82–92° E) in the WRF-Chem model for the three cases. The datasets for evaluation are the second version of Modern-Era Retrospective Analysis for Research and Applications for AOD, the Tropical Rainfall Measurement Mission (TRMM) satellite for precipitation, and WWLLN for lightning flash rate, respectively.
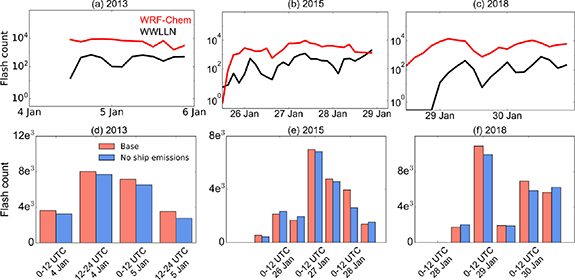
Figure 2. Evaluation of the WRF-Chem simulated lightning flash counts and the differences due to shipping emissions. Panels (a), (b), and (c) show the 3 h average flash counts observed by WWLLN and simulated by WRF-Chem over the shipping lanes (82–92° E, 5–7° N) in the innermost domain (4 km) during 4–6 Jan 2013, 25–29 Jan 2015, and 28–31 Jan 2018, respectively. Panels (d), (e), and (f) summarize the 12 h averaged lightning flash counts in the Base simulation (simulation A, table S2) and NoShip simulation (simulation B) in the 2013, 2015, and 2018 cases, respectively.
Download figure:
Standard image High-resolution imageFigures S2–S4 show shat our WRF-Chem simulation captures the overall spatial distributions of AOD and precipitation over the region of interest for all three cases. with the spatial correlation coefficients of 0.64 (N= 12 210, p< 0.01) and 0.44 (N= 32 292, p< 0.01) in the 2015 case as an example for AOD and precipitation, respectively. It reproduces the high AOD values over the Indian Peninsula and Indochina Peninsula, but overestimates that over the Bay of Bengal (figure S2). The model also reproduces the high precipitation with over 100 mm per day over Indonesia, consistent with the TRMM observations, but overestimates precipitation over the oceanic region at around 6° N, 90° E.
Capturing the magnitude and temporal evolution of lighting flash counts in meteorology-chemistry coupled models is much more challenging than that of AOD and precipitation, as it involves the combined uncertainty in lightning parameterization and in simulating convection, aerosol properties and its interaction with radiation and clouds. Our WRF-Chem simulation largely reproduces the temporal variation of the WWLLN observed lightning counts for all three cases (figures 2(a)–(c)), indicating the simulation successfully reproduces the temporal evolution of convections and lightning activities. However, it overestimates lightning count by an order of one or two magnitudes. Similarly, Wong et al (2013) also found that the WRF simulation biased high in lightning flash rates by an order of magnitude compared to ground-based detection networks in the United States. This discrepancy reflects both measurement bias and model deficiency. WWLLN sensors preferably detect CG flash (section 2.1), but have limited ability to detect IC flash. Even though the current WWLLN network has been shown to capture more lightning counts than the satellite-based LIS/OTD dataset in the equatorial Indian Ocean (Virts et al 2013), it may still underestimate the true frequency of lightning counts due to an insufficient number of sensors and its inability to count IC flashes. From the model perspective, the PR92 scheme solely relies on the cloud top height as an indicator of convention strength, however, stronger convections are not always indicative of more frequent lighting activities (Xu et al 2017). The high bias in the simulated lightning counts may also reflect the model's overestimation of precipitation over the shipping lane region (figures S2–S4). More efforts are required to improve the accuracy of the simulation of lightning in weather or climate models.
3.2. Impact of shipping emissions on lightning flash counts
We find that lightning counts averaged over the shipping lanes (82–92° E, 5–7° N) in the Base simulation (simulation A) are 2.7%, 5.5%, and 4.4% larger than those in the simulation without shipping emissions (simulation B), in the simulation periods of 2013, 2015, and 2018, respectively. Such difference is particularly large when convection is active and lightning frequency is high, reaching 22.3% on 28 January 2015 and 10.5% on 29 January 2018 (table 1). We also note that the differences in lightning frequency introduced by shipping emissions show temporal variabilities, with larger lightning frequency in some periods when shipping emissions are excluded (figures 2(d)–(f)).
Table 1. Difference in lightning flash counts and parameters related to convection strength due to shipping emissions in active convection periods.
| Parameters Both ACIs and ARIs | 2013 | 2015 | 2018 |
|---|---|---|---|
| Flash counts | +6.2% | +22.3% | +10.5% |
| Cloud droplet number | +3.2% | +4.3% | +8.9% |
| Cloud water content | +2.7% | +6.5% | +1.2% |
| Radar reflectivity | +1.3% | +2.1% | +0.2% |
| Cloud-top height | +0.3% | +4.8% | +4.8% |
| ACIs excluded | 2013 | 2015 | 2018 |
| Flash counts | +4.5% | +0.25% | −6.6% |
| Cloud droplet number | Fixed | ||
| Cloud water content | −3.4% | +4.6% | +6.7% |
| Radar reflectivity | +0.1% | +0.1% | <0.1% |
| Cloud-top height | +3.8% | −2.3% | −1.2% |
| ARIs excluded | 2013 | 2015 | 2018 |
| Flash counts | +3.9% | −2.6% | +15.8% |
| Cloud droplet number | +5.6% | +4.0% | +9.9% |
| Cloud water content | +3.1% | +3.1% | +2.6% |
| Radar reflectivity | +0.4% | +0.6% | +0.3% |
| Cloud-top height | +2.7% | −0.7% | +8.8% |
a Numbers are estimated as the difference between the Base and NoShip simulation ((Base-NoShip)/Base × 100%) with different scenarios of ACIs and ARIs, averaged over the shipping lanes (82–92° E, 5–7° N). Cloud droplet number, cloud water content, and radar reflectivity are calculated from surface to 20 km height. b 12UTC on 4 January to 12UTC on 5 January, 2013. c 0UTC on 27 January to 0UTC on 28 January, 2015. d 0UTC on 29 January to 12UTC on 30 January, 2018.
The shipping-induced enhancement in the lightning counts can be entirely attributed to the interactions between shipping-induced aerosols and the atmosphere through ARIs and ACIs. This is supported by our simulations of G1 and G2 (table S2), which show that the simulated lightning counts remain exactly the same when shipping emissions are included but with both ARIs and ACIs invalidated in the simulation. We quantify that shipping activities enhance the AODs by 1.3%–7.2% over the shipping lane region in the three cases by direct emissions of particles (PM2.5, PM10, BC, OC) and secondary formation of aerosols from the emission of precursors (SO2, NOx ). The shipping-induced enhancement of aerosols, even at a relatively small magnitude, has shown moderate influence on the mean lightning frequency in the three cases.
We next examine the involved physical processes of how these shipping-induced aerosols alter the lightning frequency. We analyze the regional mean difference in simulated cloud droplet number, cloud water content, radar reflectivity in the altitude range of 0–20 km, and cloud-top height attributable to shipping emissions during the period with the most active convection in each case. We find that shipping-induced aerosols increase the convection strength and the lightning frequency by 6.2%–22.3% for all three cases, when ACIs and ARIs are both considered (table 1). Mechanically, the shipping-induced aerosols serve as additional CCN and increase the cloud droplet number by 3.2%–8.9%, leading to more but smaller cloud droplets according to the Twomey effect (Twomey 1977). With the reduction of the effective radius of cloud droplets, the collision-coalescence processes are hindered and the precipitation of cloud water is delayed. Our simulations suggest both an invigoration of updrafts (0.3%–4.8% increase in cloud top heights) and cloud water content (1.2%–6.5%) (table 1, figure 4). That is to say, the enhancement in lightning, although parameterized here using only cloud top height, may be both dynamic and microphysical in nature. While liquid and ice water content are altered by the Twomey effect described above, the invigoration of updrafts may result from some combination of (1) increased latent heat release while freezing (Rosenfeld et al 2008) and (2) increases in environmental humidity (Abbot and Cronin 2021). The latter is indicated by small increases in environmental humidity due to shipping-induced aerosols in all three cases (figure S5).
The increase in regional mean cloud-top height of 0.3%–4.8% in response to the consistent increase in cloud water and radar reflectivity is responsible for the enhancement of lightning frequency, however, it is not proportional to the increase in lightning flash count. This may reflect the nonlinear relationship between cloud-top height and flash count in the PR92 parameterization. Our analyses thus support that shipping emission aerosols foster the convection through microphysical processes and lift the convective cloud-top height, ultimately contributing to the enhancement of lightning counts.
The microphysical processes and their contribution to lightning activity also involve strong temporal evolution, as illustrated in the 2015 case (figure 3). The most significant convection events occurred at around 0 UTC and 22 UTC on 27 January (figure 3(e)). We find that shipping emissions contribute to substantial increases in the mixing ratio of the cloud droplet number, cloud water content, and radar reflectivity in these two periods, effectively enhancing the lightning frequency. In comparison, there is an apparent decrease in cloud water content and radar reflectivity before the activation of convection. This is because when additional aerosols are activated as CCN, the effective radius of cloud droplets becomes smaller, which suppresses the formation of precipitation and convection at its early stage, according to the Twomey effect. Cases in 2013 and 2018 also show similar patterns (figures S6–7). This also explains the temporal variability of shipping-induced lightning flash counts as shown in figure 3.
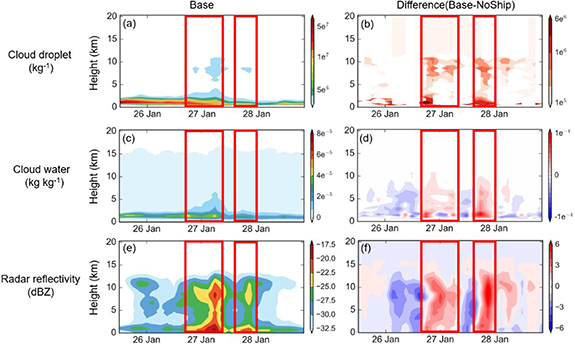
Figure 3. Temporal evolution of the simulated cloud droplet number, cloud water content, and the radar reflectivity in January 25–29, 2015, and contribution from shipping emissions. Results are averaged over the 82–92° E, 5–7° N domain. Panels (a), (c), (e) show the results from the Base simulation, which includes shipping emissions and considers both ARIs and ACIs. Panels (b), (d), (f) show the contribution from shipping emissions, estimates as the difference between the Base (A) and NoShip (B) simulation.
Download figure:
Standard image High-resolution image3.3. Quantification of ACIs and ARIs contribution to the shipping-induced enhancement of lightning frequency
We use the methods described in section 2.4 to separate the influence of ACIs and ARIs on lightning frequency, and results are summarized in table 1. We find that when ACIs are inactivated in the model, shipping emissions lead to changes in lightning flash counts of +4.5%, +0.25%, −6.6% for the 2013, 2015, and 2018 cases, respectively. These responses are significantly lower than the consistent increase of 6.2%–22.3% when both ACIs and ARIs are considered. Such differences are also reflected in the simulated cloud droplet number, cloud water content, radar reflectivity, and cloud-top height. Since the cloud droplet has been set to 10 cm−3 in the model to inactivate ACIs, the simulated CCN is fixed to a relatively low concentration, limiting the role of the shipping-induced aerosols to serve as CCN and to develop the convective cloud via the microphysical processes as described in section 3.2. This is supported by a much smaller shipping-induced increase in the radar reflectivity of only about 0.1% when the ACIs are inactivated, compared to the 0.2%–2.1% increase when both ACIs and ARIs are considered in the model, and the opposite contribution to radar reflectivity during the active convection period when excluding ACIs in all cases as shown in figure 4. In response, the cloud top height decreases by −2.3% and −1.2% in 2015 and 2018 cases with inactivated ACIs. The above results support the importance of ACIs in invigorating convections and enhancing lightning frequency.
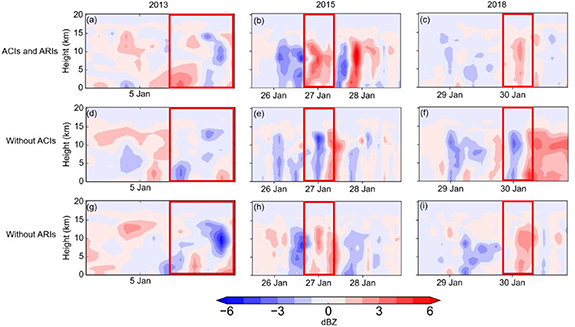
Figure 4. Influence of ACIs and ARIs on the temporal evolution of shipping-induced radar reflectivity in the WRF-Chem simulations. The figure shows the evolution of the domain-mean difference in the radar reflectivity due to shipping emissions, under the circumstance when (a)–(c) both ARIs and ACIs are considered, (d)–(f) without ACIs by fixing cloud droplet, (g)–(i) without ARIs in 2013, 2015, and 2018.
Download figure:
Standard image High-resolution image
In comparison, ARIs' impacts on lightning frequency are inconsistent in the three cases. In the 2018 case, the removal of ARIs increases the shipping-induced lightning enhancement from 10.5% to 15.8% (table 1), indicating that ARIs suppress convection and lightning activity, which is consistent with Zhang et al (2020). In contrast, ARIs enhance convection and lightning activity in 2013 and 2015 cases, and the contributions are comparable to ACIs. We also notice that inactivating either ACIs or ARIs both show much fewer changes in lightning counts (+0.25% and −2.6%) compared to the 22.3% increase when both ACIs and ARIs are active in the 2015 case, suggesting that there can be strong interactions between ACIs and ARIs (Lohmann and Feichter 2001). Figure 4 further shows inconsistent or uncertain responses of cloud properties and lighting activities to shipping emissions when ARIs are excluded from the model.
We find the inconsistent responses of lighting activities to ARIs are associated with different aerosol levels in three selected cases. Aerosol loading over the shipping lanes was relatively low in 2018, as evidenced by a 50% lower regional mean AOD in 2018 than in 2013 and 2015 cases. With higher aerosol loadings and with ARIs activated in the simulation, shipping-induced aerosols heat the air temperature at around 3–5 km and cool the air temperature at around 1 km above the surface in the 2013 and 2015 cases (figure S8). This may reflect the radiative effect of shipping-induced sulfate and BC aerosols. Sulfate aerosols are accumulated below 1 km above the surface (figure S9). These aerosols could scatter the shortwave radiation to the atmosphere ahead (3–5 km above the surface), where BC aerosols there further absorb the radiation and heat the atmosphere. Moreover, ingestion of aerosols in warm clouds (which can reach around 5 km according to figure 3(c)) may increase the albedo and the cloud reflectance (Twomey 1977), resulting in the heated air temperature at around 3–5 km. The anomaly heating then leads to a positive anomaly in the vertical velocity at 3–5 km (red dashed line in figures S8(a), (b), and hence invigorates convection aloft and enhances lightning flash counts.
We hypothesize that the low aerosol loadings in the 2018 case may limit the scattering effect and the resulting heating of the lower atmosphere as in the 2013 and 2015 cases, and hinder the development of convection as supported by the much smaller change of vertical velocity in Figure S8c compared to figures S8(a) and (b). Furthermore, we find that the average cloud droplet number over the shipping lanes in 2018 is much lower than that in 2013 and 2015 (4.7 × 10⁵ kg−1 versus 1.1–1.4 × 10⁶ kg−1). It is possible that the heating and evaporation of cloud droplets may significantly reduce the cloud droplet numbers, impeding the ACIs-involved cloud microphysics and the development of convection (Liu et al 2022). The evaporation itself can also suppress the convection because of reduced latent heat. The ARIs impact also includes the influence on cloud status and distributions through altering the atmospheric temperature profiles, but which is difficult to independently quantify. These results point to a complicated effect of ARIs on convection that might be tied to the number, composition, and vertical structure of aerosols, as well as the interaction with ACIs.
4. Conclusions
We have examined the role of shipping-induced aerosols in lightning activities over one of the world's busiest shipping lanes using the coupled meteorology-chemistry model WRF-Chem. We conduct three case simulations in different years with the most active lightning activity during 2005–2021. All three cases demonstrate consistently that the shipping-induced aerosols increase lightning flash counts by 6.2%–22.3%. The increases in lightning flash counts are in alliance with enhanced cloud droplet number, cloud water concentration, radar reflectivity, and cloud-top height. We find that both ACIs and ARIs exert significant impacts on the development of convection and lightning. ACIs show a consistently positive contribution to the lighting counts. The positive ACIs contribution reflects the microphysical role of shipping-induced aerosols in serving as additional CCNs, delaying the precipitation of cloud water, and allowing the lift and accumulation of water vapor. Convections are invigorated as supported by enhanced cloud-top height, likely by the increasing release of latent heat and change in environmental humidity. In comparison, ARIs show an uncertain and inconsistent contribution to convection and lightning frequency. It shows a positive contribution to lightning in 2013 and 2015, but a negative contribution in 2018. This difference reflects a complicated effect of ARIs on convection that might be related to the number, composition, and vertical structure of aerosols, as well as the interaction with ACIs. In general, our results point to the dominant role of ACIs in the positive aerosol-lightning relationship over the tropical shipping lanes, at least in the cases we examined in this study.
Our study thus proves the anthropogenic impacts on lightning activities through shipping-induced aerosol modulation on convections. In particular, our study reveals and quantifies the different roles of ACIs and ARIs in various stages and episodes of lightning activities. Future shipping activities are projected to increase consistently with economic growth, total seaborne trade, and the average installed power per ship under most emission scenarios (Eyring et al 2005, Kalli et al 2013, Zhao et al 2020). Our study thus has important implications for understanding future trends in lightning activity and its consequence on atmospheric chemistry and climate, with the rapid increase of anthropogenic emissions especially in developing tropics. While our study has examined three short-term cases in years with top records of lighting counts, our study is not able to quantify the long-term impacts of shipping-induced aerosols on trends in lightning activities (Wang et al 2018, Qie et al 2021), and does not fully disentangle the interactions between the ARIs and ACIs as well as the interactions between convective clouds and the surrounding atmosphere. Such impacts are also tied to long-term changes in shipping emissions that will be influenced by changes in fuel type. The lightning parameterization based on convective cloud-top height, even which has been widely used in chemical and weather forecasting models, may not capture the full impact of the aerosol-induced microphysical changes and may therefore underestimate the sensitivity of lightning counts to the perturbations of aerosols. More observations and modeling studies are required to understand the relationship between aerosols (including specific compositions), convections, and lightning, and to improve the representation of lightning in numerical models.
Acknowledgments
We thank the WWLLN (http://wwlln.net), a collaboration among over 50 universities and institutions, for providing the lightning data used in this paper. We thank Robert Holzworth for obtaining WWLLN data. We are grateful to Mary Barth for her valuable advice on lightning simulation. Xiao Lu acknowledges funding from the Guangdong Basic and Applied Basic Research project (Grant No. 2020B0301030004), the Guangdong Basic and Applied Basic Research Foundation (2022A1515011554),and the National Natural Science Foundation of China (Grant No. 42105103).
Data availability statement
Measurements of lightning flash counts are available from the World Wide Lightning Location Network (WWLLN) (http://wwlln.net). MERRA2 data are publicly available at https://gmao.gsfc.nasa.gov/reanalysis/MERRA-2/datacube. WRF-Chem simulation data are available at https://zenodo.org/records/10011869.
Supplementary data (2.4 MB DOCX)